@Banana3Stocks What’s happening today is par for the course. Blip on the radar, nothing more. Just digesting the games we made and setting up for next leg higher. Luv how $meta is strong today.
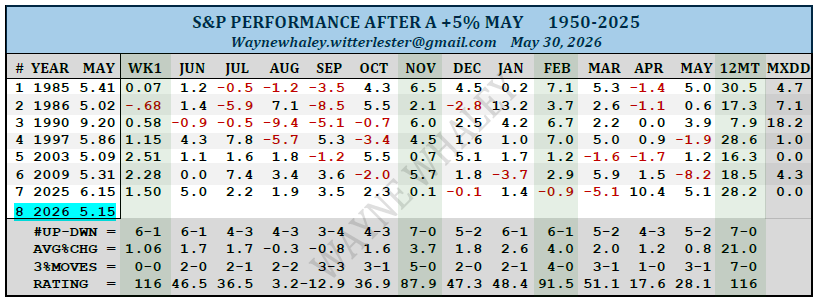
THE S&P AFTER A 5% MAY
The S&P was up 5.15% in May of 2026.
I see seven prior, post 1950, years in which May was up +5%.
After those seven prior +5% May's, the first week of June was 6-1 for a 1.05% avg gain which is much in line with our May 24th post on May24-June5 performance history.
The following month of June was 6-1 in this +5% May setup for a 1.76% avg mtly gain.
The following 12 months were 7-0 for a gaudy 12mt avg gain of 21%.
It is only seven data points and, in and of itself, not enough reason to go giddy on equity exposure but if you have a handful of similar type results, all pointing in the same direction, they, as a group, are worthy of respect.
The six of seven, 12 mt performance data points coming in above +15% supports the Bullish perspective that the setup is likely not of the random statistical noise genre.
And one of the reasons it makes my current 'Top Ten Studies Supporting Equity Ownership' list.
[email protected] for subscription inquiries to my Weekly Market Studies.
S&P PERFORMANCE AFTER 7 CONSECUTIVE POSITIVE WEEKS UP NET +15%
For this study, define a week as any seven consecutive calendar days.
As of Thursday, May 14, the S&P concluded seven consecutive positive weeks (1.6, 3.7, 3.1, 1.0, 1.4, 1.8 & 2.2%) Thursday through Thursdays for a net 15.8%, seven-week, gain.
Although only seven cases, they take on some statistical significance owing to the fact all seven cases were followed by a double-digit gain in the next 12 mts for an avg 15.5% gain.
As well, the study garners support from the analogous, 34 case study the prior week shared with study subscribers based on a similarly defined weekly methodology applied to six consecutive positive weeks up net 10% which occurred Thursday, May 7th with summarized performance for that scan provided in the second table below.
Those 34 cases had a discernable, above normal forward performance history across the following 12 mts with the +10% moves over the following 12 mts, 22-0 to the positive.
There are studies aplenty which support the Bearish case as well, but these of the consecutive win variety fall on the Bullish side of the ledger for now. [email protected] for Study Subscription inquiries.
The current tech rally hasn’t seen much backing and filling.
Despite a weak day today, Nasdaq 100 is still above its 10DMA for 32 straight days, marking the 11th best streak since 1985.
6 months later, $NDX was positive 100% of the time, with an average gain of 11.8%. $QQQ
S&P 500 just made its 5th new high in May, and it points to huge gains ahead.
In every case where $SPX made 5+ ATHs in May, rest of year was positive 100% of time with 11% median gain.
Max drawdown always stayed below 11%, and the yearly peak never came before November. $SPY
@Banana3Stocks This crushed $ups and $fedex. $amzn will treat this business unit with low cost and great UI for their customers causing a switch. This shows the strength and confidence of their network from the time they left ups. Amazing to see the speed of how they execute.
We’re sticking with our 8,100 year end 2026 target for S&P 500.
So far, $SPX has tracked the outlook we laid out in Dec 2025.
We don’t see a 20%+ correction, or a break of March low. Most gains are likely to be concentrated in 2H 2026.
Outlook slides pinned on profile.