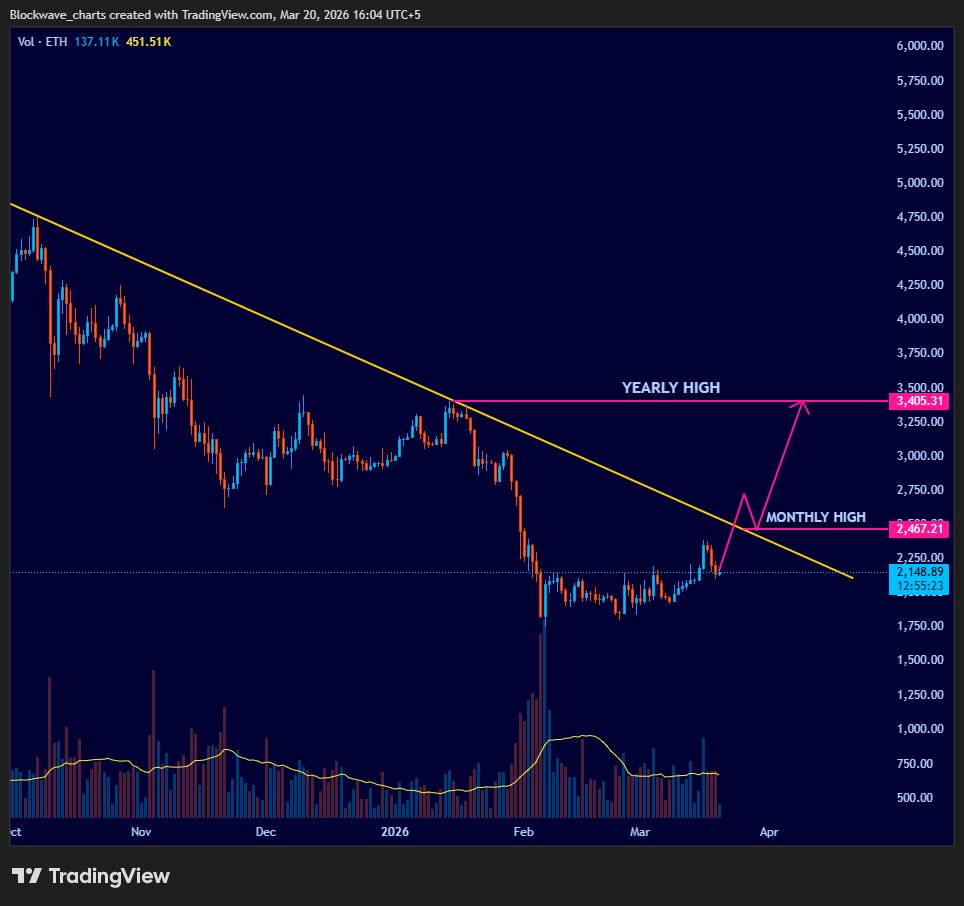
ETHUSDT (1D)
$ETH has broken out of the descending trendline with improving momentum. If breakout holds, price can continue towards the order block. Sustained momentum may push it further towards the yearly high.
Order Block: $2.8K–$3.0K
Yearly High: $3.4K
BTCUSDT (1D)
$BTC is trading inside an ascending channel and approaching resistance. If rejected from the upper trendline, price can drop towards the lower trendline. A strong close above it can push price towards the order block.
Lower Trendline: ~$70K
Order Block: $85K–$90K
USUALUSDT (1D)
$USUAL is moving towards the descending trendline and approaching the monthly high with improving momentum.
Monthly High: $0.0197 (+50%)
Yearly High: $0.0317 (+130%)
Quarterly High: $0.0565 (+315%)
If breakout is confirmed, strong upside continuation likely.
ONTUSDT (1D)
$ONT has pumped +43% with strong volume, breaking out of the descending trendline and creating a new yearly high.
If momentum sustains, price can continue towards:
Quarterly High: $0.136 (+105%)
ONTUSDT (1D)
$ONT has broken out of the descending trendline with a strong impulsive move and volume expansion.
Yearly High: $0.078 (+25%)
Quarterly High: $0.136 (+105%)
If breakout holds and momentum sustains, further upside continuation likely.
BNBUSDT (1D)
$BNB is moving towards the descending trendline. If breakout is confirmed, strong upside continuation likely.
Weekly High: $687 (+7%)
Quarterly High: $959 (+48%)
Major High: $1,375 (+113%)
XLMUSDT (1D)
$XLM has broken out of the descending trendline and is pushing towards the order block with rising momentum.
Order Block: $0.21 (+17%)
Yearly High: $0.255 (+42%)
Quarterly High: $0.414 (+131%)
Holding above the order block keeps bullish continuation in play.
ONTUSDT (1D)
$ONT has broken out of the descending trendline with a strong impulsive move and volume expansion.
Yearly High: $0.078 (+25%)
Quarterly High: $0.136 (+105%)
If breakout holds and momentum sustains, further upside continuation likely.
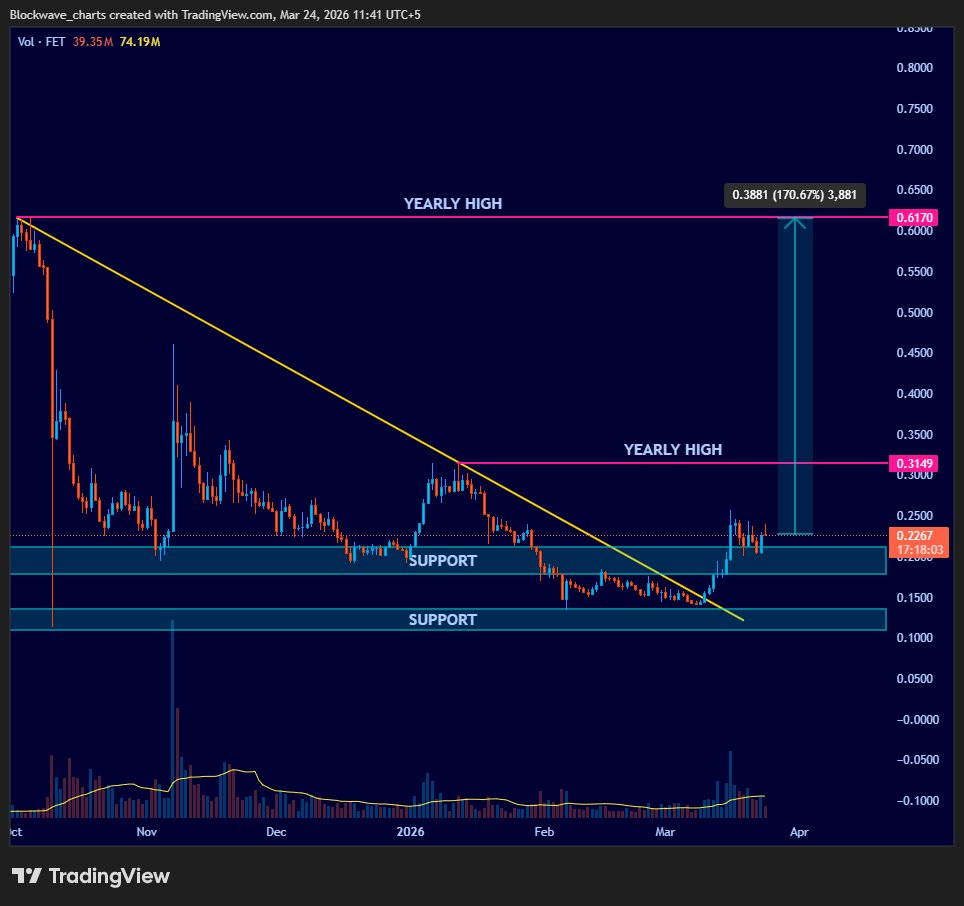
FETUSDT (1D)
$FET has bounced from the support zone and confirmed a breakout with strong closing above the descending
Yearly High: $0.314 (+40%)
Major High: $0.617 (+170%)
Bullish continuation likely if momentum sustains.
HUMAUSDT (1D)
$HUMA is moving upward towards the descending trendline and approaching the monthly high with improving momentum.
Monthly High: $0.0258 (+50%)
Yearly High: $0.0328 (+90%)
Quarterly High: $0.0394 (+125%)
If breakout is confirmed, further upside likely.
AGLDUSDT (1D)
$AGLD is trading inside a symmetrical triangle, showing consolidation with tightening price action.
Resistance: $0.40 (+55%)
Support: $0.20
A confirmed breakout above resistance could trigger upside expansion, while breakdown may lead to further downside.
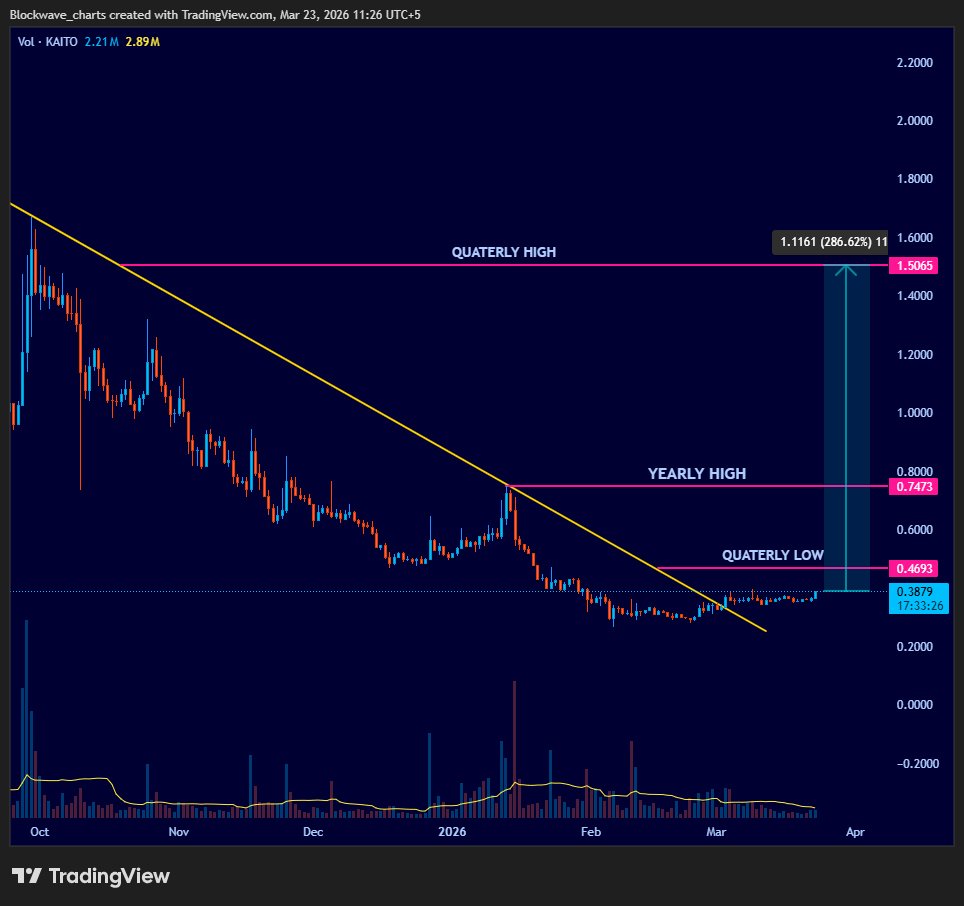
KAITOUSDT (1D)
$KAITO has broken out of the descending trendline with strong momentum and volume expansion.
Quarterly Low: $0.469 (+20%)
Yearly High: $0.747 (+90%)
Quarterly High: $1.506 (+280%)
Holding above the breakout zone keeps bullish continuation in play.
SUIUSDT (1D)
$SUI has broken out of the descending trendline with improving momentum after consolidation.
Monthly High: $1.168 (+25%)
Yearly High: $2.024 (+120%)
Quarterly High: $3.71 (+300%)
Holding above the breakout zone keeps bullish continuation in play.
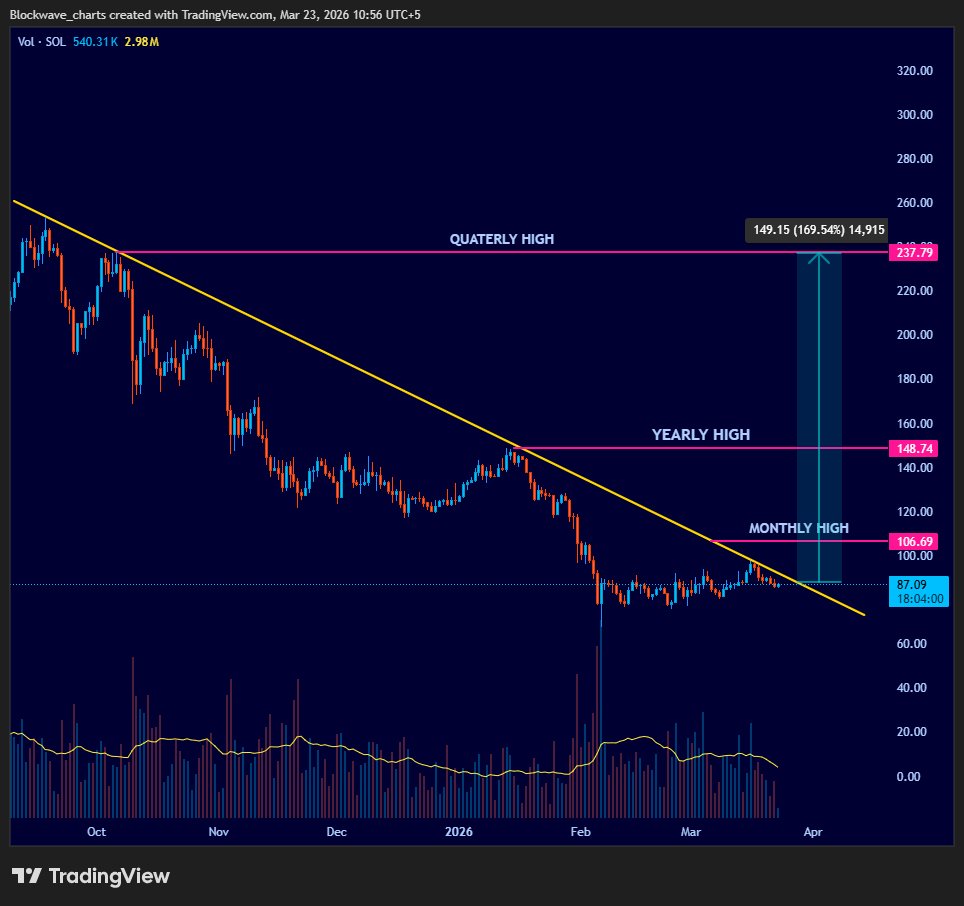
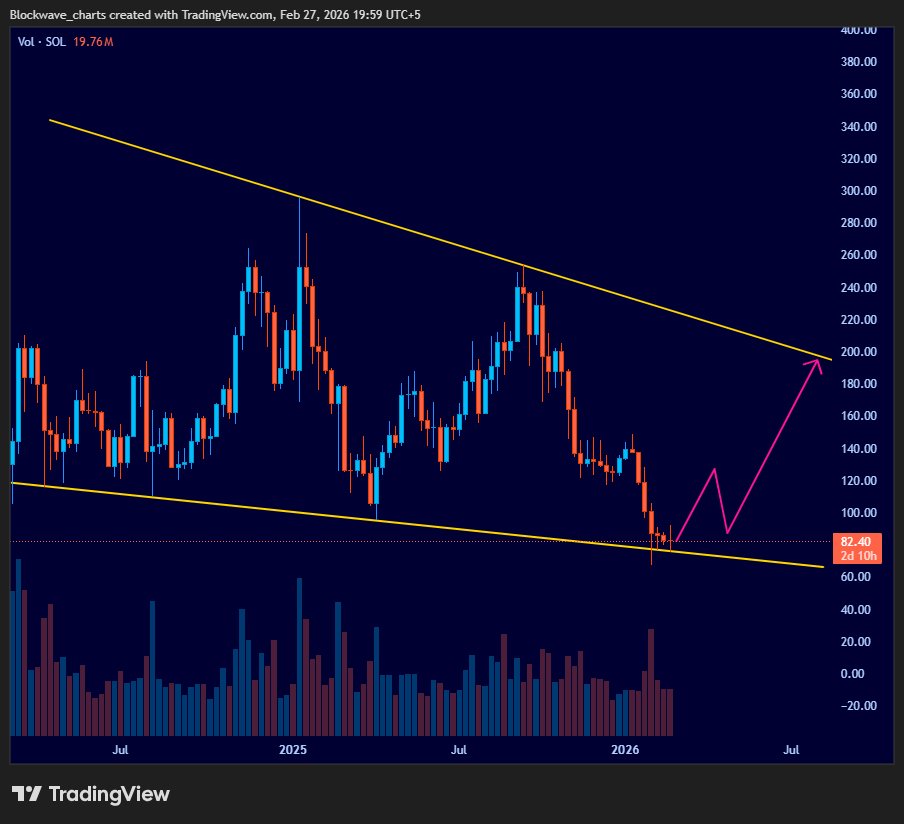
SOLUSDT (1D)
$SOL is attempting a breakout from the descending trendline with improving momentum.
Monthly High: $106.69 (+20%)
Yearly High: $148.74 (+70%)
Quarterly High: $237.79 (+170%)
If breakout is confirmed, upside likely. Failure may lead to further downside.
LINKUSDT (1D)
$LINK has broken out of the descending trendline and is holding above the key support zone after a successful retest.
Yearly High: $14.40 (+60%)
Quarterly High: $23.73 (+165%)
Holding above the breakout zone keeps bullish continuation in play.
AVAXUSDT (1D)
$AVAX has broken out of the descending trendline and completed a successful retest of the support zone, showing strength.
Yearly High: $14.95 (+55%)
Fair Value Gap: $24–$28 (+150%)
Holding above the breakout zone keeps bullish continuation in play.
SXPUSDT (1D)
$SXP is approaching a key descending trendline after a long downtrend, with volume starting to expand.
Monthly High: $0.037 (+300%)
Yearly High: $0.083 (+880%)
Quarterly High: $0.170 (+1900%)
If breakout is confirmed, strong upside expansion becomes likely.
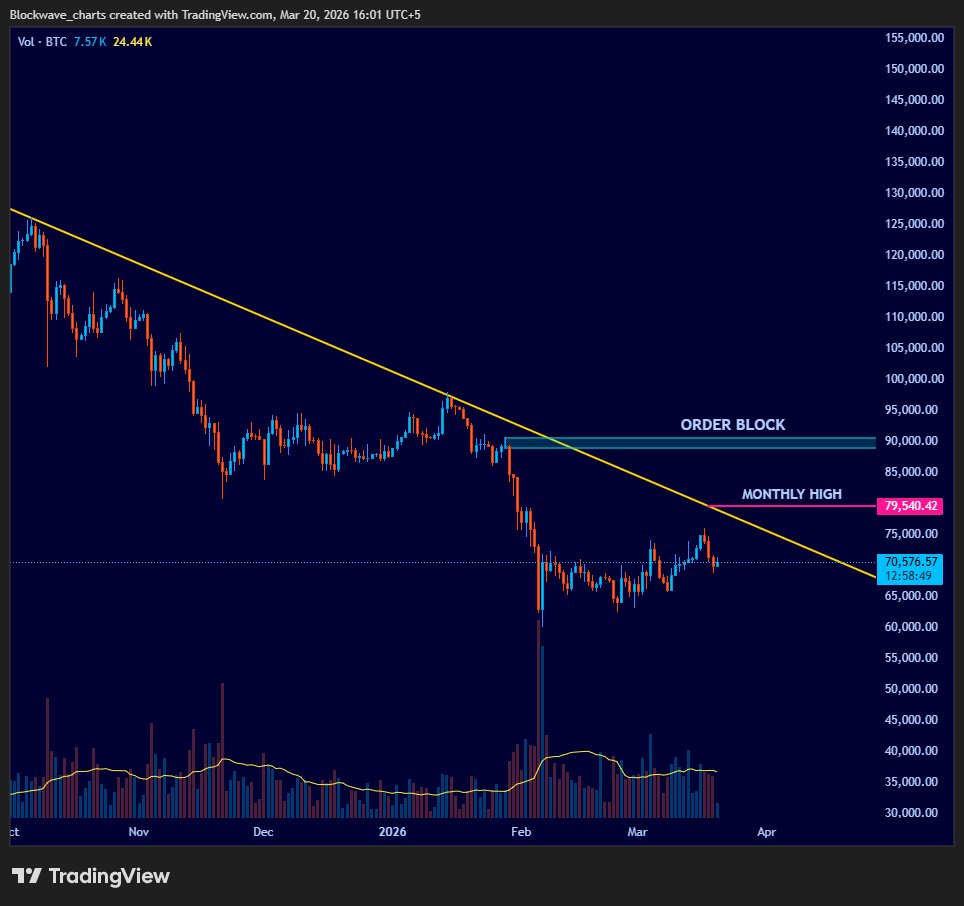
BTCUSDT (1D)
$BTC is rejecting from the descending trendline and trading below a key order block.
Monthly High: $79,540 (+12%)
Order Block: $88K-$91K (+25%)
If breakout above trendline is confirmed, upside toward higher levels becomes likely. Holding below keeps
PHAUSDT (1D)
$PHA is attempting a breakout from the descending trendline with rising momentum. If breakout is confirmed, holding above the zone keeps bullish continuation in play.
Yearly High: $0.0555 (+35%)
Fair Value Gap: $0.09 (+120%)
Quarterly High: $0.1065 (+160%)
SOLUSDT (1W)
$SOL is holding the lower boundary of a long-term descending channel. A strong reaction from this support could trigger a relief rally toward $120–$140, with major resistance near $180–$200.
Weekly close below support would invalidate the bounce setup.