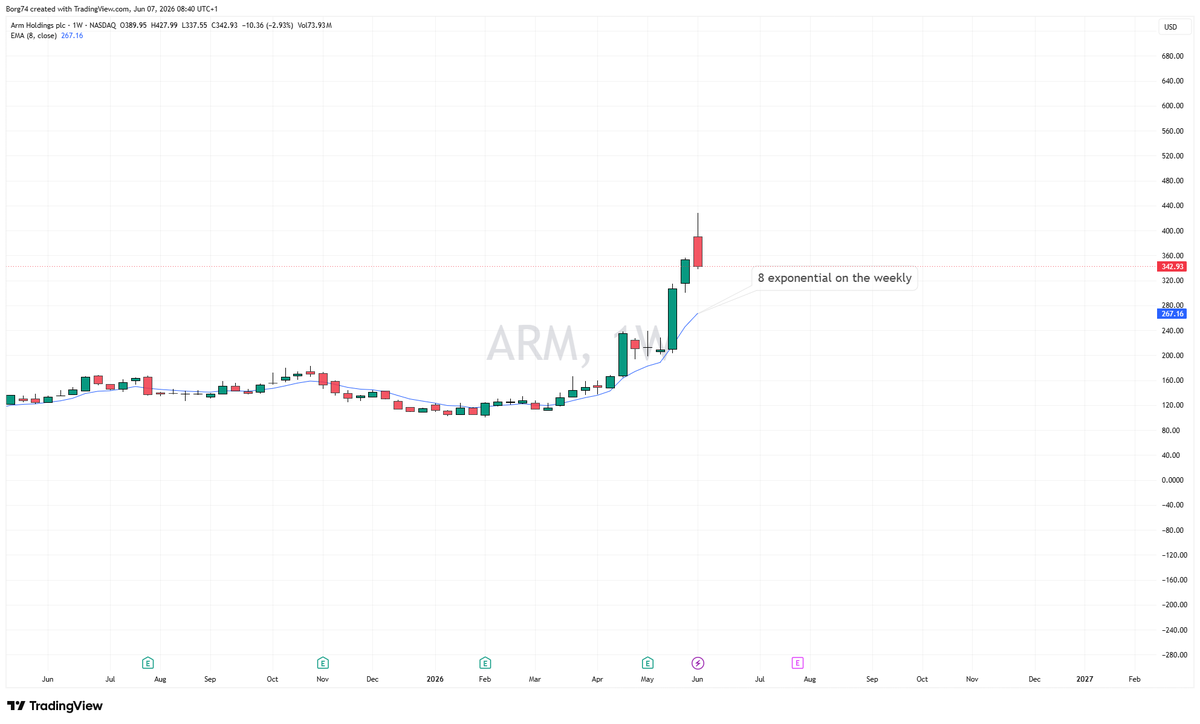
@RealJGBanks "Now both Semiconductor and Memory leaders are testing their Weekly 8 EMA after historic runs "
$SNDK
$MU
$ARM
$NVDA not by my charts they are not! ARM as an example have i missed something?
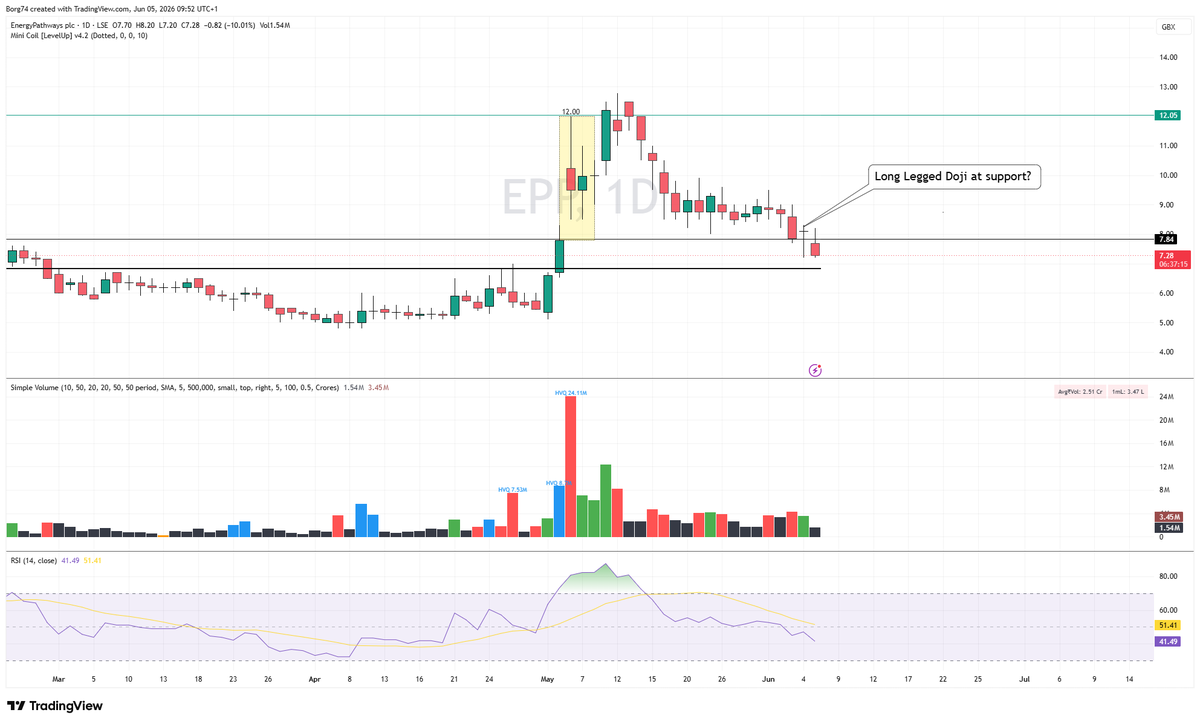
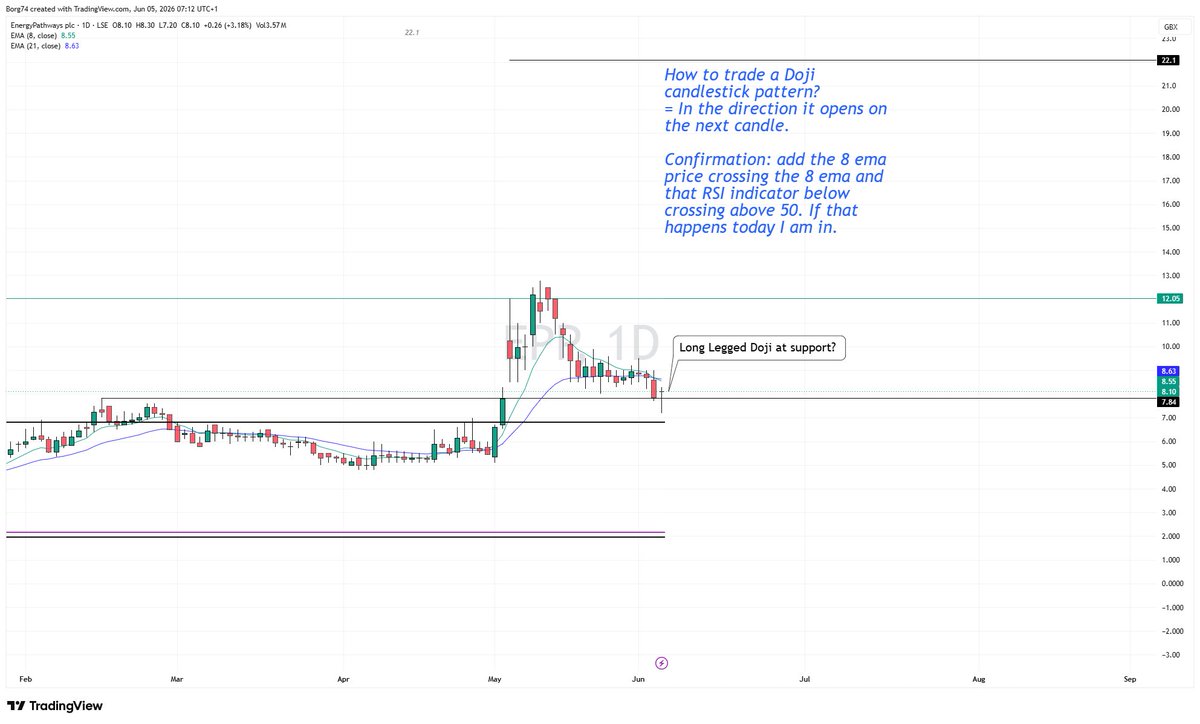
#EPP I am no AIM expert. In fact, if my track record is anything to go by, AIM stocks have probably been my least profitable trades.
That said, I do understand market psychology.
Today's intra-day drop is so far on relatively light volume. To me, that looks less like aggressive selling and more like a classic shakeout designed to test conviction and flush out weak holders.
If that's what's happening, don't be surprised to see the price recover quickly. When? Maybe Monday.
Market makers can be crafty buggers.
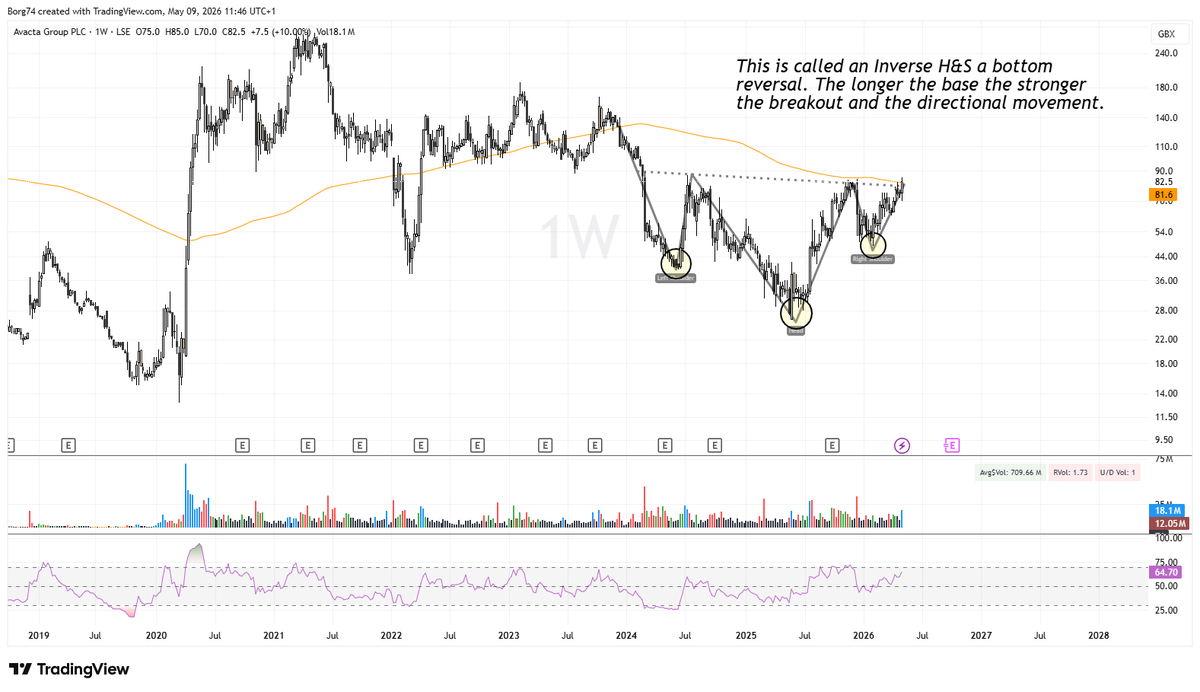
@Mark_Crisp1 Hi Mark #AVCT not pleasing to see price fall below the 50ma. The last line of defense is now the 200sma. below that, bias changes as a trader only.
#AVCT sitting right at the Weekly 200MA.
“How fast?” The market has no real concept of time. This is a weekly chart, so my initial target is around 110p over the coming weeks, not days.
Patience pays, though many of you probably know that even better than I do. If price can reclaim and hold above the 200MA, I suspect the move could accelerate quickly.
Watching #EPP having sold out on that sudden rise 1st week of May, I am waiting for a re-entry and a logical place would be the Breakout and retest level... I will look to position by tomorrow... Pullbacks on below average volume is what you want to see.
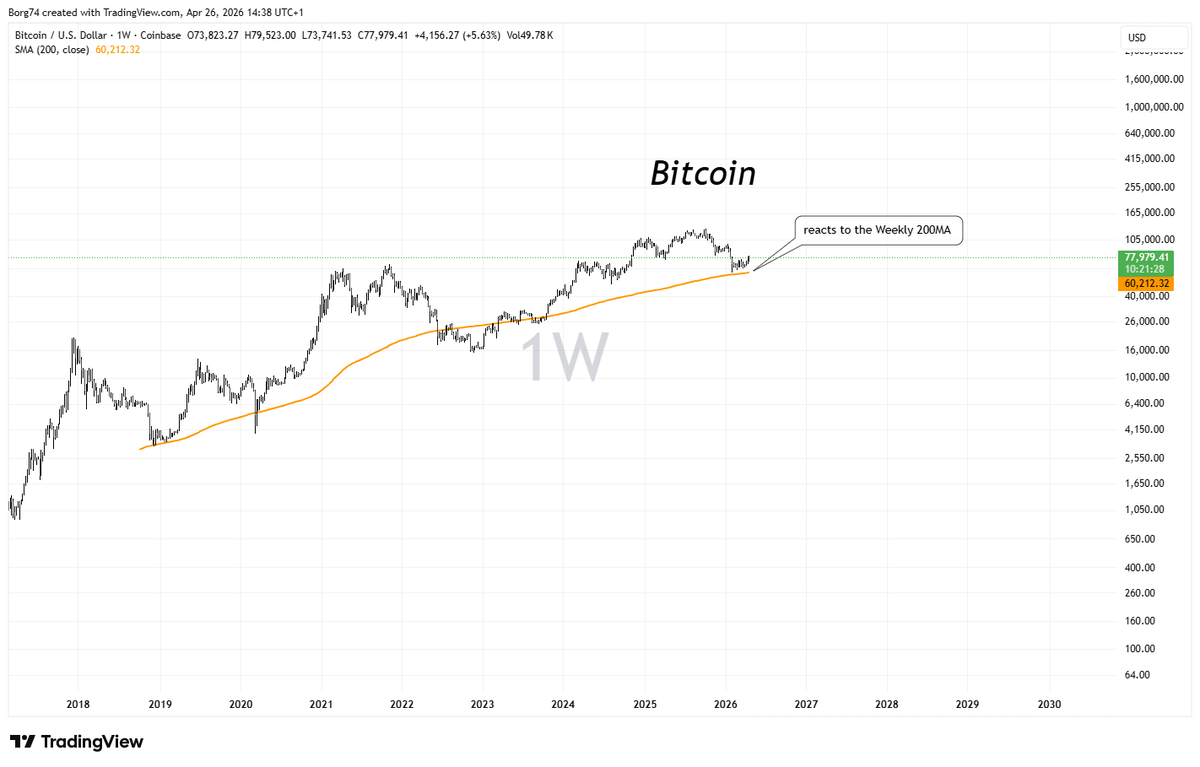
If you use the Weekly chart in addition to the 13/26ema or 10/30 simple (stan weistein) look at adding the 200MA and if you come across an asset class close to the 200MA watch closely. #Bitcoin you can cross reference with $MSFT or $PANW which have also reacted there.
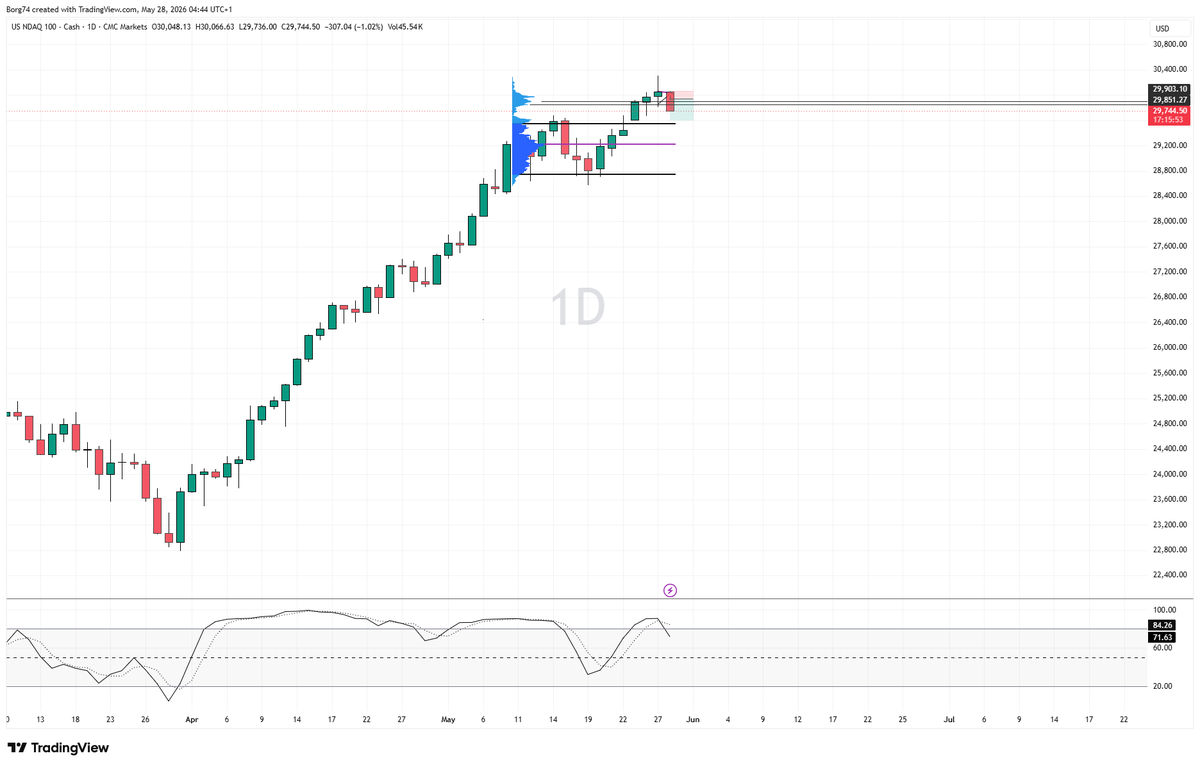
Selling Short #Nasdaq100 the concept is quite simple. Take price action as the emotional signals and combine that with a momentum filtering technique (Stochastic) to enhance the quality of signals generated from candle patterns. If you consider a common technical indicator for momentum such as the Stochastic %K and %D, you know that whenever the %K & %D rises above 80 (overbought), it is just a matter of time before it will drop back below 80 for a sell signal. I call this period when the %K and D are above 80 the Bearish Pre-Signal Zone. Thus, now if you also find a bearish reversal candle pattern (Evening Star) that occurs while %K and D are above 80, you are getting an emotionally driven sell signal prior to getting a technical based sell signal.
repeatable concept.. patience to execute. Be that Cheetah..
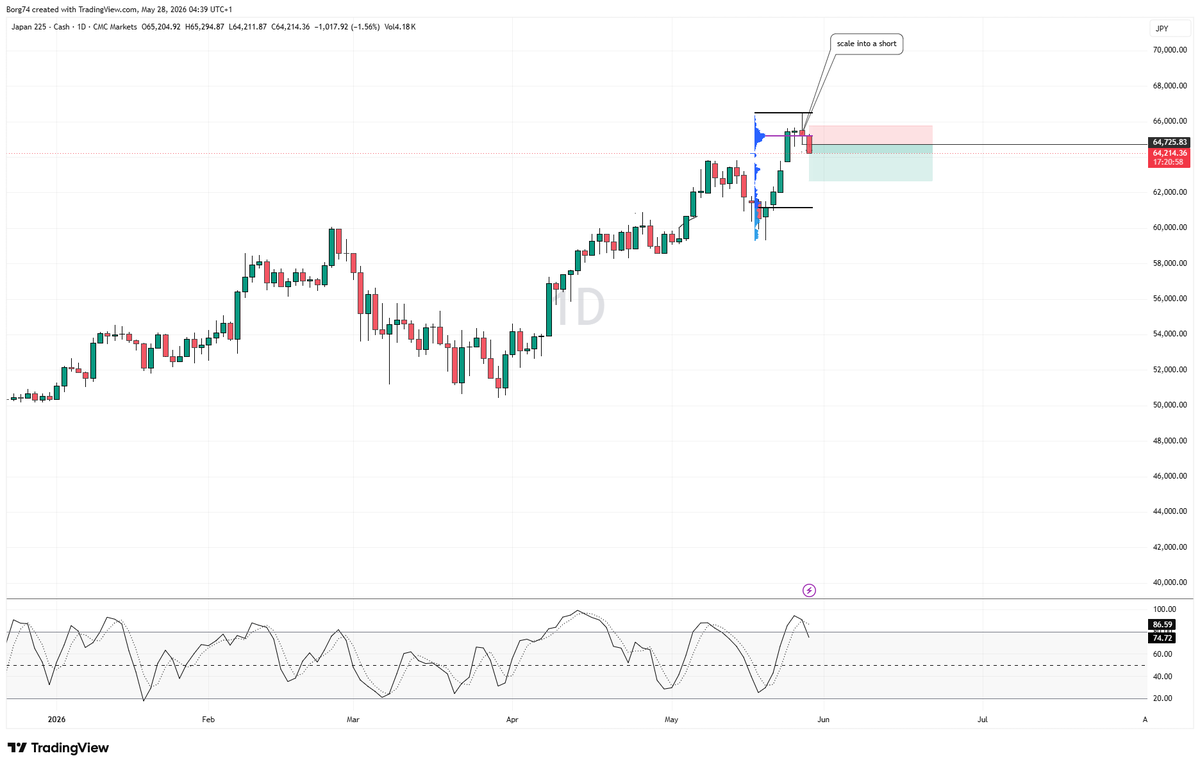
Selling Short #Nikkei The concept is quite simple. Take price action as the emotional signals and combine that with a momentum filtering technique (Stochastic) to enhance the quality of signals generated from candle patterns. If you consider a common technical indicator for momentum such as the Stochastic %K and %D, you know that whenever the %K & %D rises above 80 (overbought), it is just a matter of time before it will drop back below 80 for a sell signal. I call this period when the %K and D are above 80 the Bearish Pre-Signal Zone. Thus, now if you also find a bearish reversal candle pattern (Evening Star) that occurs while %K and D are above 80, you are getting an emotionally driven sell signal prior to getting a technical based sell signal.
@karaoke_andi English may be confusing… but having studied German it is the only language where the verb goes on holiday and returns at the end of the sentence 😄
It's been a good week. Recent change of strategy and a new system that I have been working on with Mike at Mbtrading.
It's paying dividends after a lot of work. Identifying only quality set ups, less trades, but ultimately more profitable. Roll on next week!!