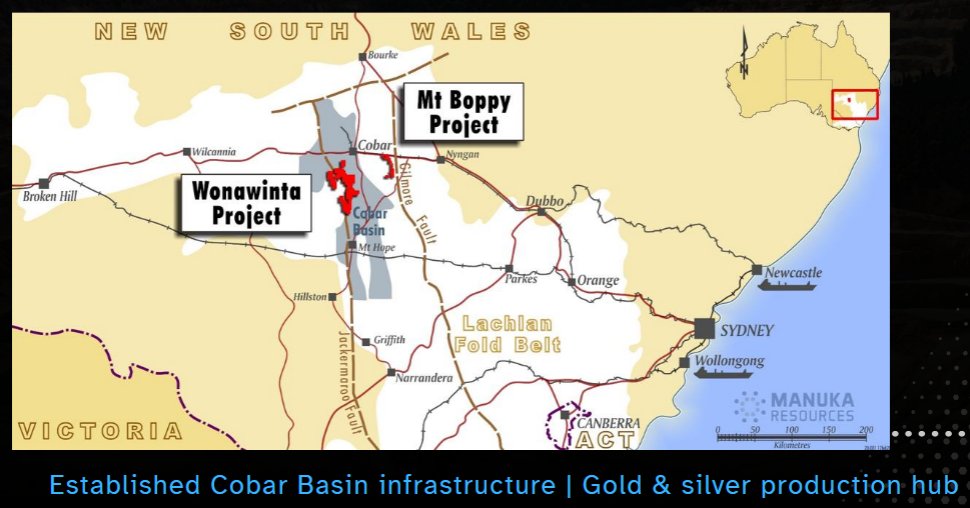
@ManukaResources (ASX: MKR) has provided a series of announcements over the past fortnight related to the restart of its Wonawinta mine in NSW – where first gold revenue was reported on 1 October, followed by a second sale on 16 October.
The plant is now reported at full gold processing capacity on feed from Mt Boppy, with sales shifting from a fortnightly to a weekly cycle.
At the ramp-up target of 1,750t/day, ~1.0g/t head grade and ~75% recovery, a fortnight of processing yields roughly 590oz, or around A$3.5M at A$6,000/oz. That sits within the A$3.0–4.0M per fortnight guided to end-2026. MKR has also commented that recoveries are still improving, which would add upside to these numbers.
The next catalyst is silver, with commissioning of the new crushing and deslime circuits scheduled to commence in December, with combined gold and silver processing now expected around February 2027.
The bottom-line though is that the market will want to see the quarterly operating report – in order to have confirmation around throughput, grade and recovery, along with any guidance on operating costs and margin.
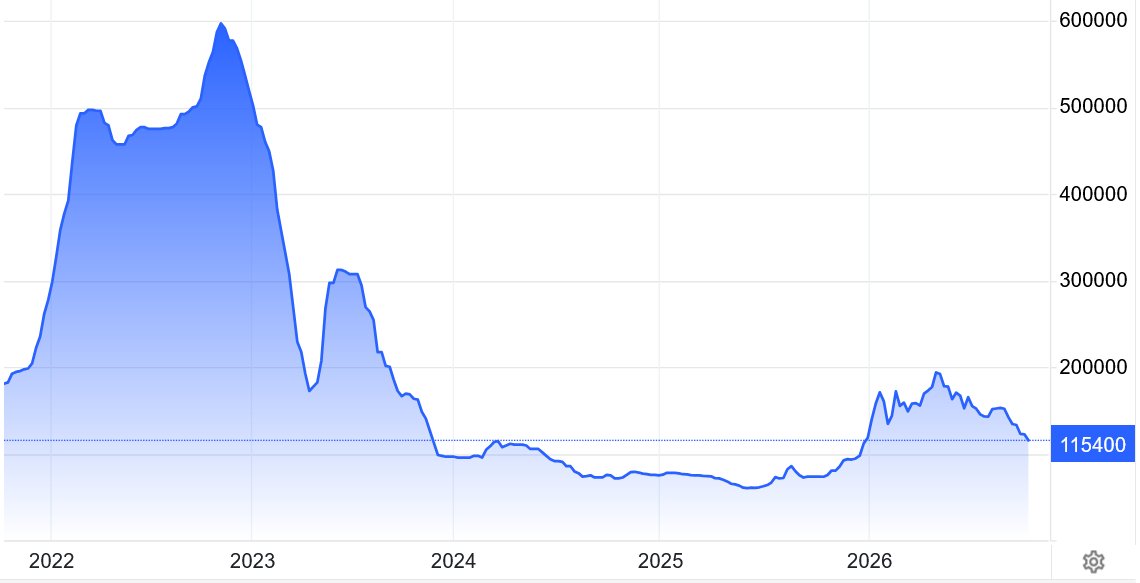
Lithium carbonate prices overshot on the upside and are now weakening significantly from their 2026 highs, because the market is sitting on the Chinese converter cost floor. Demand is still growing, but the growth rate has rolled over, cathode plants are well‑stocked, and global supply hasn’t tightened enough to lift prices.
LFP dominance and future low‑cost supply (recycling, DLE) are suppressing the recovery. Until Chinese converters regain margin or demand re‑accelerates, carbonate will remain range‑bound at marginal cost.
Meanwhile on Monday, we saw a deal between China and the European Union to cut hybrid cars exports by potentially more than half. This move has exacerbated concerns over demand prospects for the electric vehicle battery material. The EU is trying to reduce its trade deficit with China.
We've initiated coverage of @StavelyMinerals (ASX: SVY), which recently released its Thursday’s Gossan/Cayley Lode Scoping Study - outlining a potentially technically and financially feasible open-cut operation based on an updated MRE of 60 Mt @ 0.46% Cu, 0.09 g/t Au and 2.8 g/t Ag (0.58% CuEq).
The Study highlights a project that could generate strong returns based on current metals prices – with an estimated pre-tax NPV7 of A$905M, IRR of 43%, and net cashflow from operations of A$1.5B.
The project development envisages a standalone conventional process plant with a front-end crushing and grinding circuit and back-end sulphide flotation cells, with an annual throughput capacity of 4 million tonnes per annum (Mtpa).
This is merely a starting point - and there is optionality around development scenarios, including a starter pit operation that could generate cashflow that could transition into a small-footprint underground operation.
https://t.co/OsXtuqf3xz
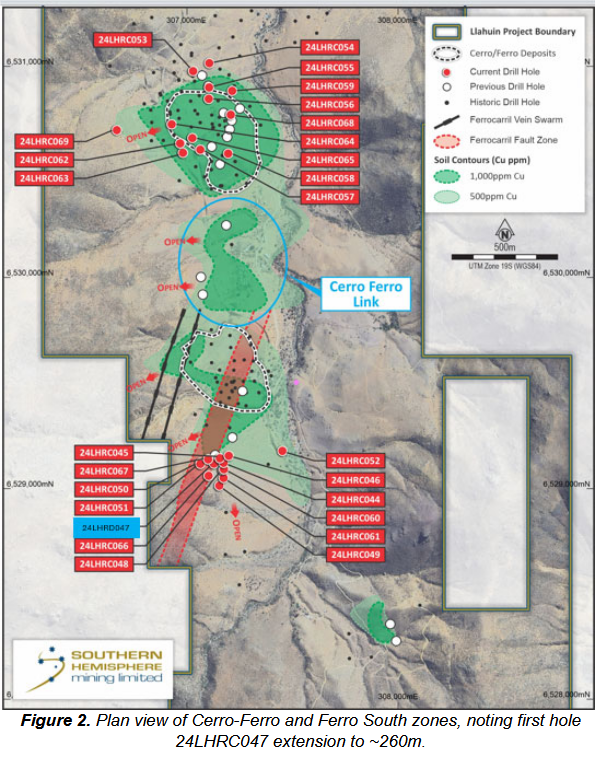
Coverage stock @SHMining (ASX: SUH) has initiated a 2,000 m diamond drilling program at Ferro South within its Llahuin Copper Project in Chile. Initial assays are expected late November.
The key potential development is the copper isotope study, which has identified a deeper isotopic vector pointing toward a potential feeder zone within the broader Cerro–Ferro system.
Isotope vectoring is an advanced exploration tool normally used in major porphyry programs, and its application here suggests the system may be vertically zoned with a more significant copper‑gold centre at depth.
Selected holes may extend to ~500 m depending on core observations – as SUH drills for system‑scale understanding rather than incremental extensions. Llahuin currently hosts 218 Mt @ 0.38% CuEq.
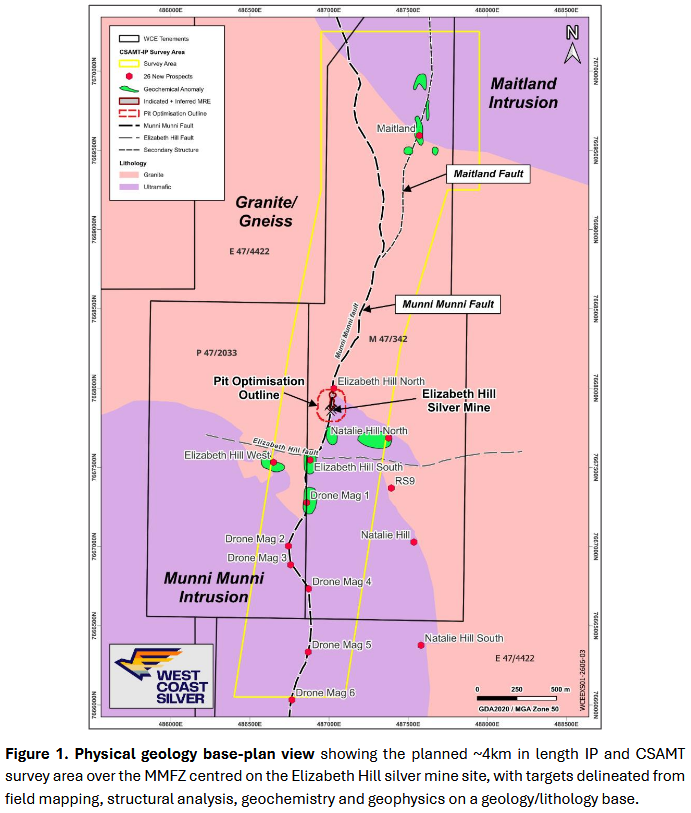
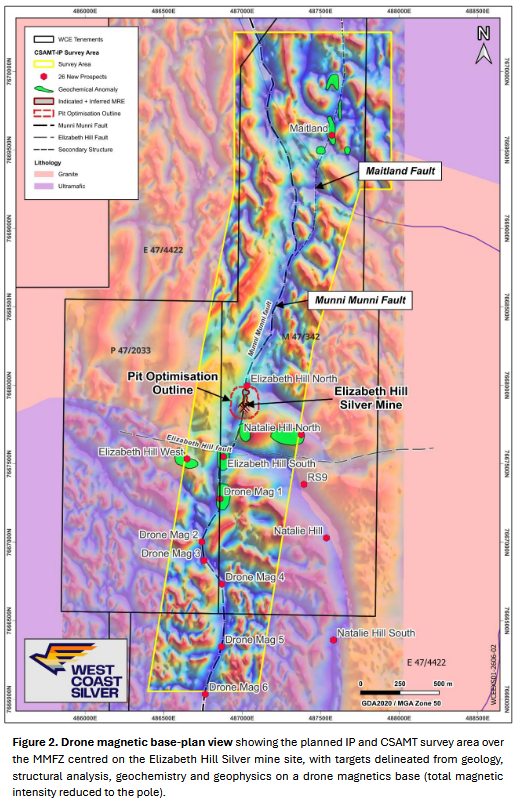
Coverage stock @wcsilver_ has initiated an IP + CSAMT program over ~4 km of the Munni Munni Fault Zone - the structure that hosts the ultra‑high‑grade Elizabeth Hill silver deposit (1.2 Moz @ 2,194 g/t Ag) in Western Australia.
IP has previously been proven to map the Elizabeth Hill mineralised envelope. The current survey is anticipated to take 4 weeks to complete, followed by processing and modelling of the data results for potential drill target generation.
You can read our coverage initiation note on @CliffMinerals (ASX: WCN) here: https://t.co/RaO0igS3s3. New website coming soon!
A key driver of crystallising value will be the initial Exploration Target (due Q1, 2027) and then the initial MRE (due Q3, 2027), both JORC 2012-compliant, with these being part of what is expected to be ongoing positive news flow.
We note that pre-development companies with resources with copper grades similar to what we see in the Danvers drilling are trading at EV multiples of A$150 to A$300 per tonne of contained copper.
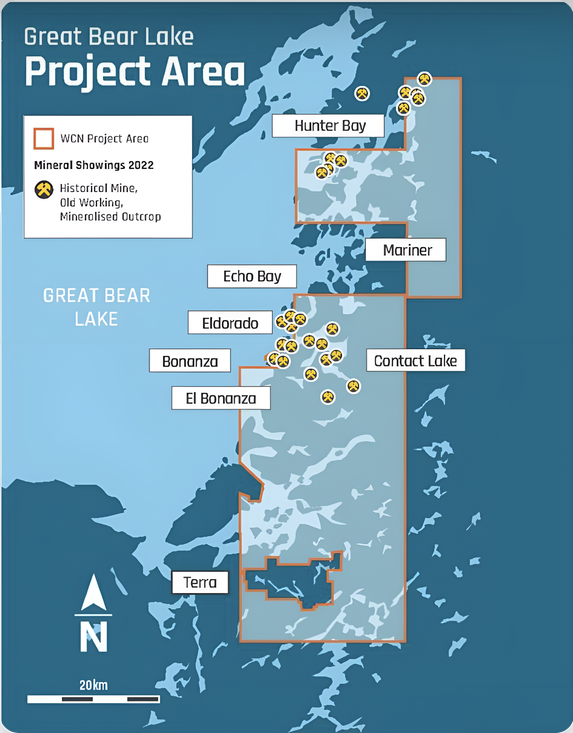
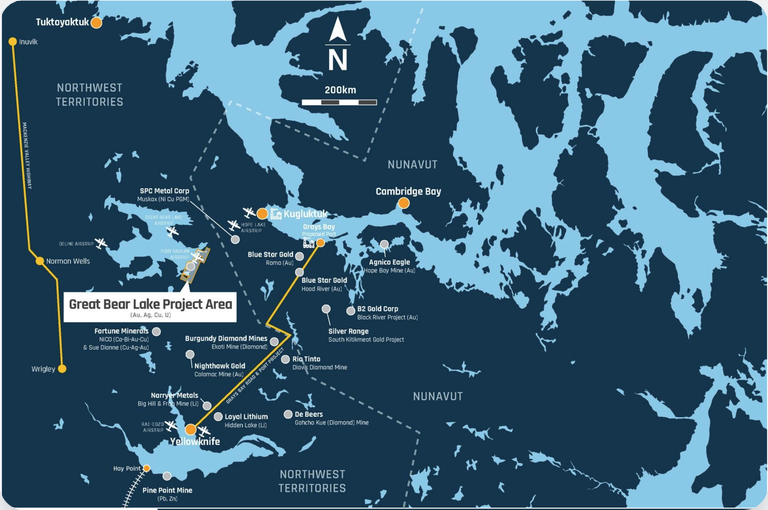
Coverage stock @GreatBearGBL’s (ASX: $GBL) focus is its namesake project, located within Canada’s Northwest Territories. It covers key parts of the Echo Bay stratovolcano complex inside the Great Bear Magmatic Zone, which is Canada’s premier IOCG province.
The project includes ground around the historic Eldorado, Echo Bay and Contact Lake mines. Those three centres produced ~34.2 million ounces of silver, 13.7 million pounds of U3O8 and 11.4 million pounds of copper.
GBL’s 2026 program has materially advanced the geological understanding of the Great Bear Magmatic Zone. It has confirmed multiple sulphide-rich gossan systems with scale, mapped consistent syn-volcanic mineralised trends, and validated the structural corridors linking historic high-grade silver mines with modern copper targets.
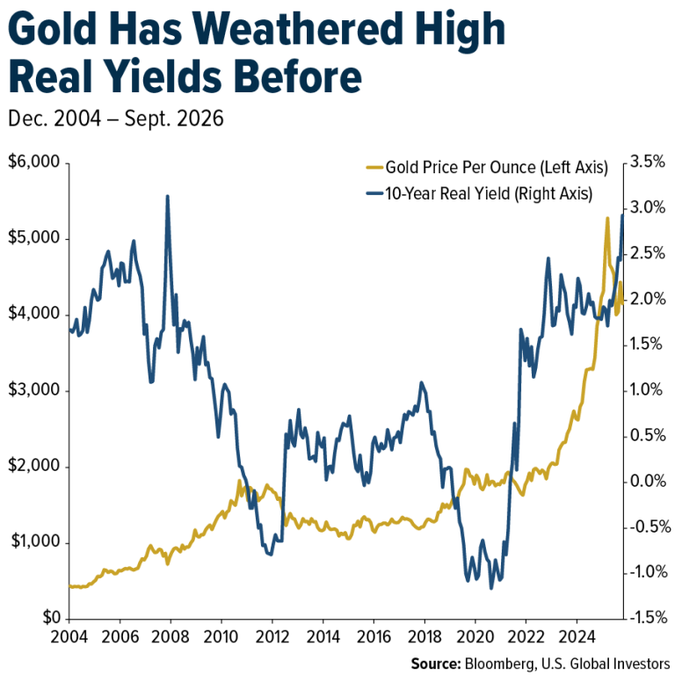
Gold’s resilience above US$4,000/oz - even as U.S. Treasury yields have hit 20‑year highs - signals a major structural shift in the market that’s been building since 2022.
Traditionally, gold moved inversely to real yields, but that relationship broke after sanctions froze half of Russia’s reserves. Since then, central banks have accelerated reserve diversification away from the US$, creating a persistent “de‑dollarisation premium” that now adds ~US$840/oz to gold’s fair value.
Despite huge rate‑driven headwinds, gold continues to hold firm thanks to:
· Geopolitical hedging & reserve diversification
· Safe‑haven demand linked to long‑term debt concerns
· Record Chinese imports (1,077t in 8 months)
· Ongoing central‑bank buying (e.g., Poland)
· Stabilising ETF flows and strong bar demand
Gold can best be described as a compressed spring - temporarily held back by high yields, but primed for upside once the Fed’s tightening cycle ends. With structural demand proving far more durable than expected, the next leg higher may only need a modest shift in macro conditions.
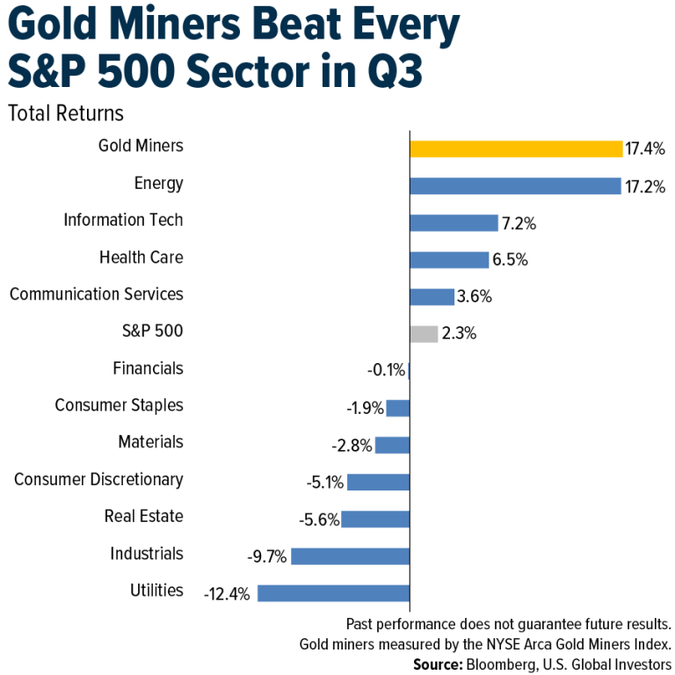
Courtesy of Frank Holmes at U.S. Global Investors, gold mining stocks as measured by the NYSE Arca Gold Miners Index delivered a total return of 17.4% for Q3 2026
This beat every single sector in the S&P 500, including energy, which rose by 17.2%. The S&P 500 itself rose by just 2.3% during Q3.
The Wall Street textbook says gold falls when real yields rise, however this is a generalisation - because from the period 2005 through 2007, real yields hovered between 2% and nearly 3% - right around where they are today - and gold nearly doubled.
In 2022, real yields swung from deeply negative to positive, a move of more than 2.5 percentage points, and gold finished the year essentially flat. Then it went on one of the greatest runs in its history while yields stayed high.
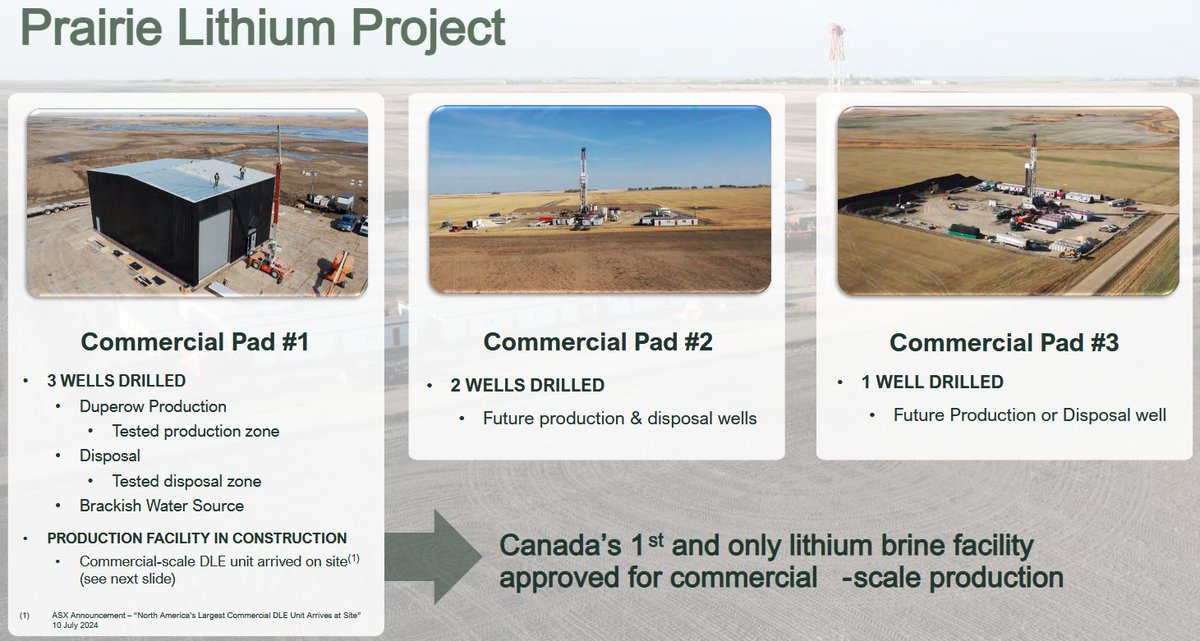
@PrairieLithium $PL9 has secured A$6.3M of interest‑free Canadian Government funding to accelerate Phase 1 development of its namesake #lithium project in #Saskatchewan, #Canada - as it moves toward first commercial lithium brine production during Q4 2026.
Phase 1 construction is already well advanced - with well infrastructure drilled, power installed, and North America’s largest commercial DLE unit delivered - positioning PL9 to become Canada’s first commercial‑scale lithium brine producer – and the first globally from an operating oil field.
PL9 is entering a pivotal period as it scales toward 150 tpa LCE for sale under the company’s binding offtake agreement with Hydro Lithium of South Korea. The modular nature of the process will means the operation should be able to be rapidly expanded, with initial larger scale plans including 6,000 tpa LCE production over three pads.
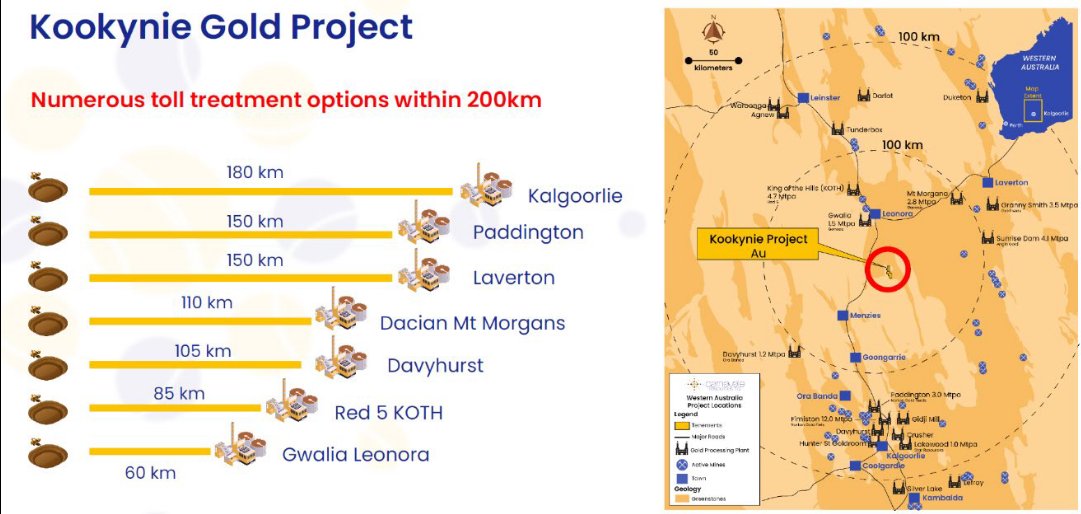
Since acquiring the Kookynie Project in 2020, coverage stock @Carnavale_Res has transformed a largely unexplored exploration property into a high-grade development asset via systematic drilling, resource growth, metallurgical test-work, economic studies and permitting.
The Kookynie Project hosts the Swiftsure and Tiptoe gold deposits, which contain a JORC 2012-compliant Mineral Resource of 120,000 oz Au at an average grade of 4.4g/t Au, including a coherent high-grade component of 55 koz Au @ 30.2 g/t Au.
A Bankable Feasibility Study is in its final stages and release expected in October. CAV's strategy is to contract mine and sell RoM material at the mine gate through an ore sales agreement (with multiple mills within trucking distance), with an initial open-pit, and then underground operation. $CAV
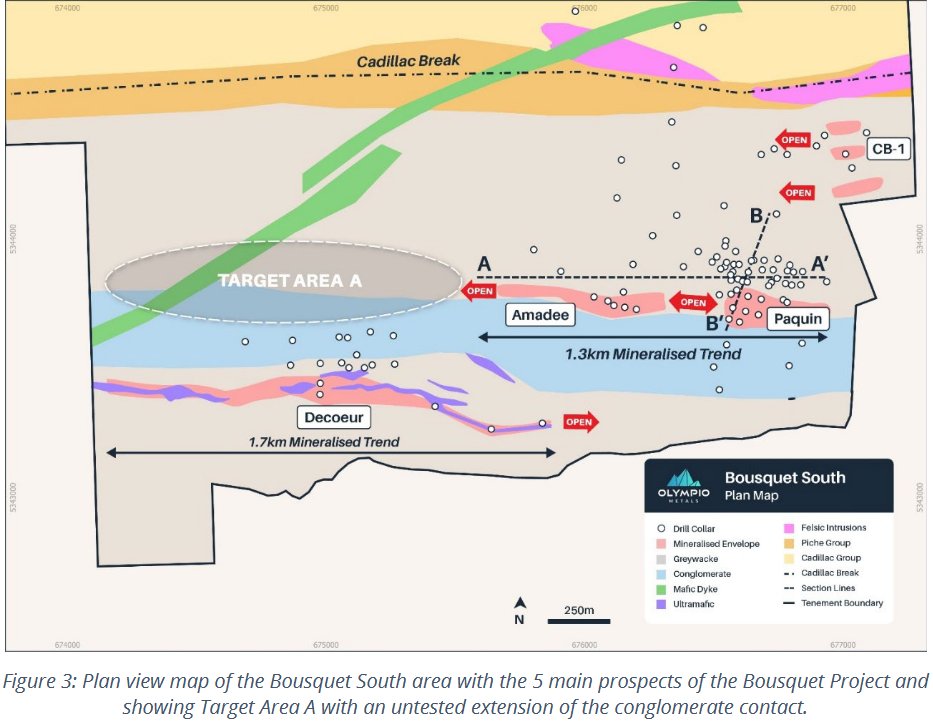
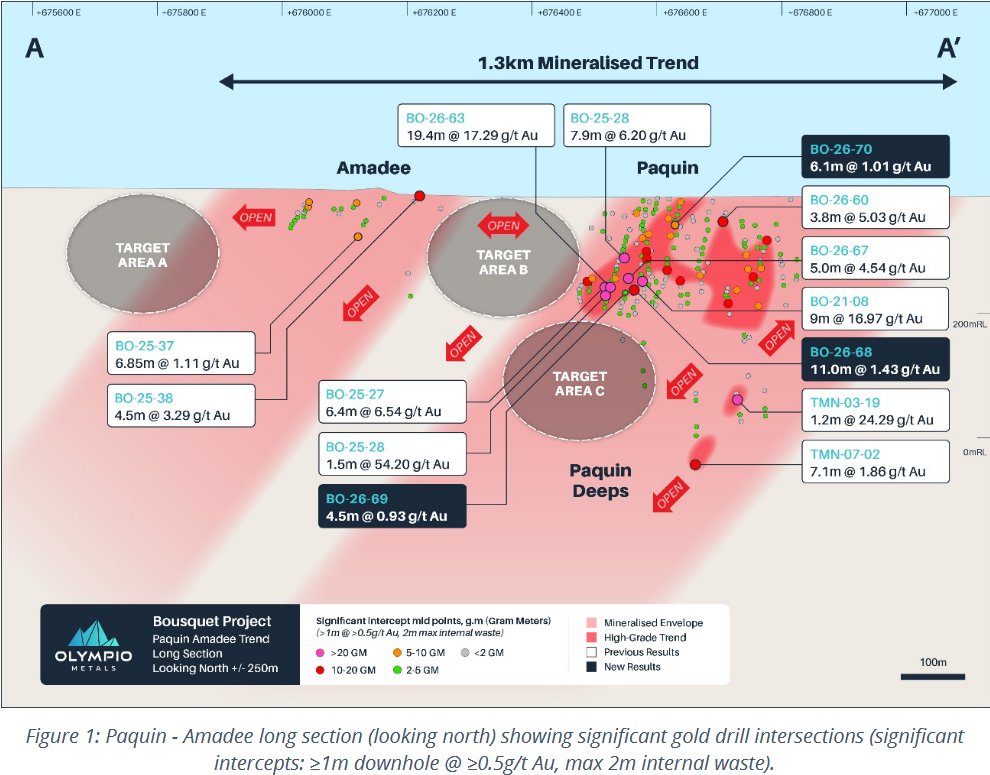
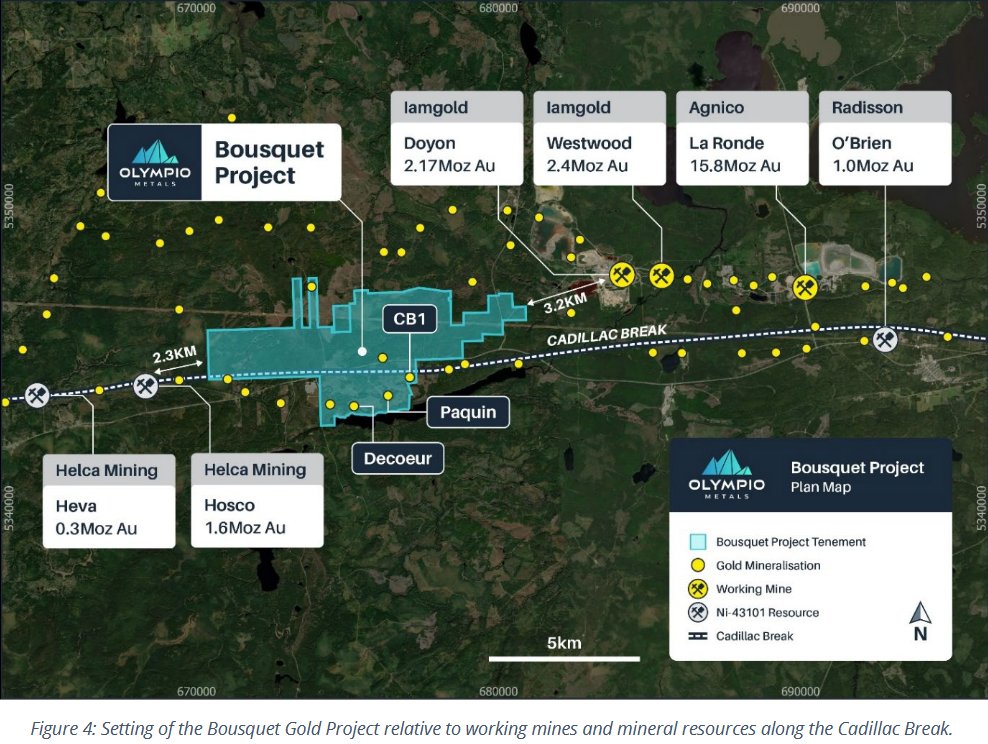
Interesting to see @OlympioMetals latest round of gold drilling results from its Bousquet Project in Quebec, which have reinforced the scale and continuity of the Paquin–Amadee mineralised trend.
· Phase 3 has returned broad zones of gold – with intercepts incl. 11m @ 1.43 g/t Au, 6.1m @ 1.01 g/t Au, and 3.5m @ 1.15 g/t Au - along with previously reported hits such as 5m @ 4.54 g/t Au and 19.4m @ 17.29 g/t Au. A pretty good strike rate - with 39 of 43 holes drilled since acquisition having intersected gold.
· The Paquin/Amadee system now demonstrates 1.3km of confirmed mineralised strike - with a further 1.5km of untested conglomerate contact open to the west. This appears to be classic Abitibi - narrow but locally very high grade, with strong down‑plunge continuity. The depth is still relatively modest (<200 m vertical).
· Next steps like a maiden resource at Paquin – plus step-out as when combined with the separate 1.7km Decoeur trend, only ~20% of the project has so far been explored. $OLY
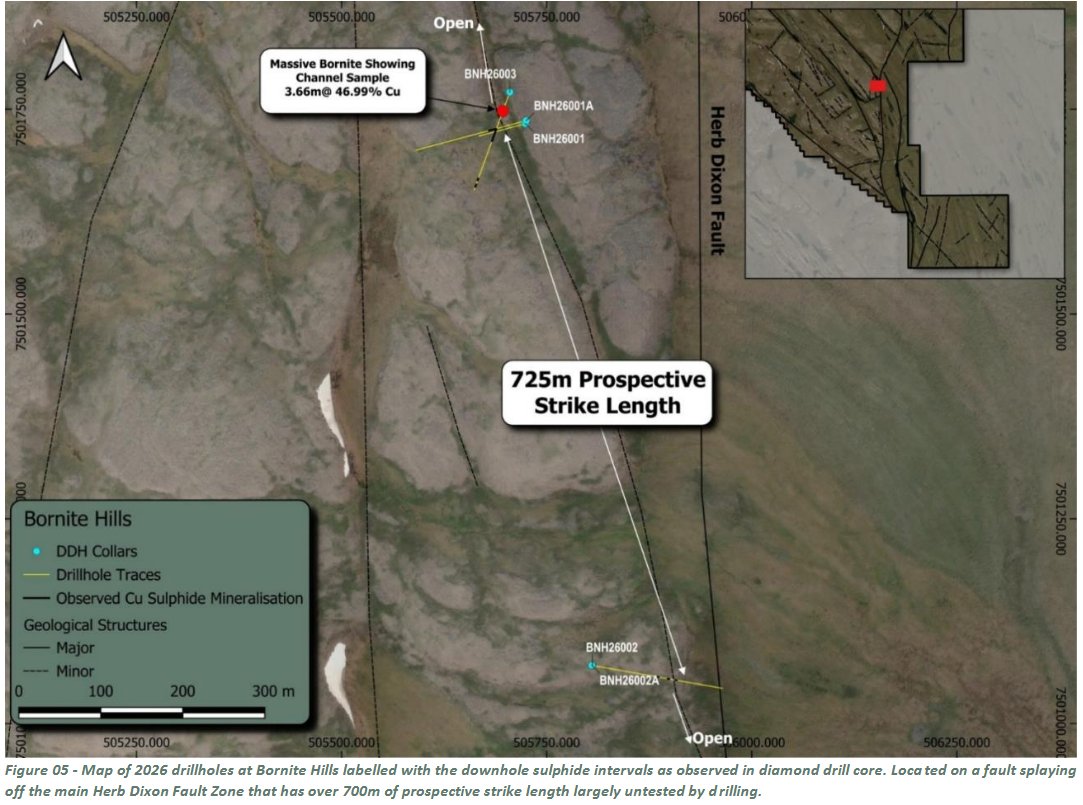
We’ve been following @CliffMinerals exploration progress at its Rae Copper Project in Nunavut, Canada since 2025 - and this week’s announcement of a new copper discovery from maiden diamond drilling at the Bornite Hills target at Rae could be the most significant to this point.
· WCN’s latest drill program has identified 32m of broad bornite-dominant mineralisation (including intervals of semi-massive bornite) in hole BNH26003, to an initial depth of more than 60m below a historic high-grade surface occurrence (a trenching result of 3.66m @ 46.99% Cu). The mineralised structure so far extends for ~725m of prospective strike - and remains largely untested.
· It’s important to note that it’s still very much early days - only three holes have meaningfully tested the structure, there are no assay results available as yet, with initial feedback provided only by way of visual analysis.
· However, the >32m bornite interval is meaningful - because bornite is typically associated with higher-grade copper and higher-value metallurgy. And in terms of scale, Bornite Hills lies 32km from Danvers (where the majority of WCN’s exploration drilling has so far been conducted) - so there are positive indicators in terms of a potentially broader emerging copper district. $WCN
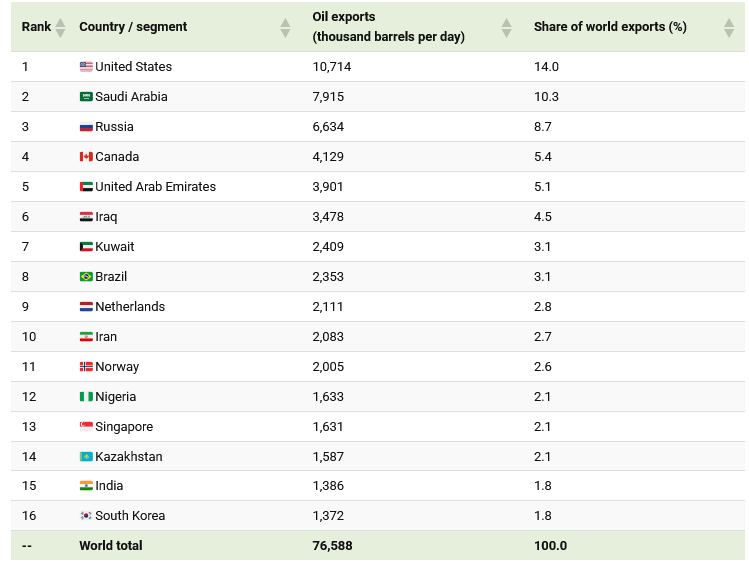
Oil is one of the world’s most heavily traded commodities, and the countries that ship it abroad can influence fuel costs far beyond their borders. This graphic ranks the world’s largest oil exporters in 2025 using data from the OPEC Annual Statistical Bulletin 2026.
The United States ranks first at 10.7 million barrels per day, ahead of Saudi Arabia at 7.9 million. Together, the two countries account for nearly a quarter of global oil exports. The U.S. position at the top owes much to the shale boom. Horizontal drilling and hydraulic fracturing unlocked more oil from tight rock formations, while the lifting of most crude oil export restrictions in 2015 opened up overseas markets.
Russia ranks third at 6.6 million barrels per day, bringing the top three countries’ combined share to 33.0%. Canada follows at 4.1 million, ahead of the United Arab Emirates at 3.9 million. Because these figures include petroleum products as well as crude oil, major refining and trading hubs can also rank highly. This helps explain the presence of countries such as the Netherlands and Singapore among the world’s larger exporters.
Gold is trading around $4,290–$4,295 per ounce, recovering slightly after falling by 1.5% in the previous session. A combination of strong growth and persistent price pressures has reinforced expectations that the Federal Reserve will continue tightening monetary policy - pushing Treasury yields and the U.S. dollar higher, and placing additional pressure on gold.
The near-term outlook for gold remains cautious. As long as the 10-year Treasury yield remains above 5%, the U.S. dollar stays strong, and markets continue to assign a high probability to an October Fed rate increase, gold’s recovery attempts may remain relatively limited.
Over the past 12 months - silver is up 46%, crude oil is up 41% and gold is up 15%.
Gold is entering a genuine period of testing following the powerful rally that has previously pushed it to record-high. The current pressure does not necessarily signal the end of the longer-term bullish trend - but it does show that the path toward new highs is unlikely to be a straight line.
In our view, the US dollar, US Treasury yields, Federal Reserve policy, and geopolitical developments will remain the key drivers for understanding the next major move.
Therefore, monitoring gold prices is not enough. A more accurate assessment begins with understanding the relationship between gold, the dollar, interest rates, oil, and bond yields.
In this environment, a sustained breakout above $4,400 would represent an important signal of renewed buying strength, while continued trading below that level would keep gold in a phase of reassessment and demand testing.
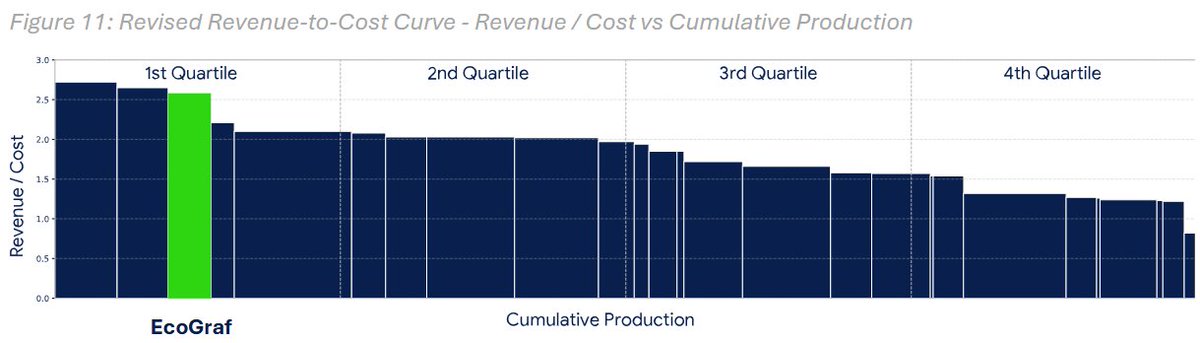
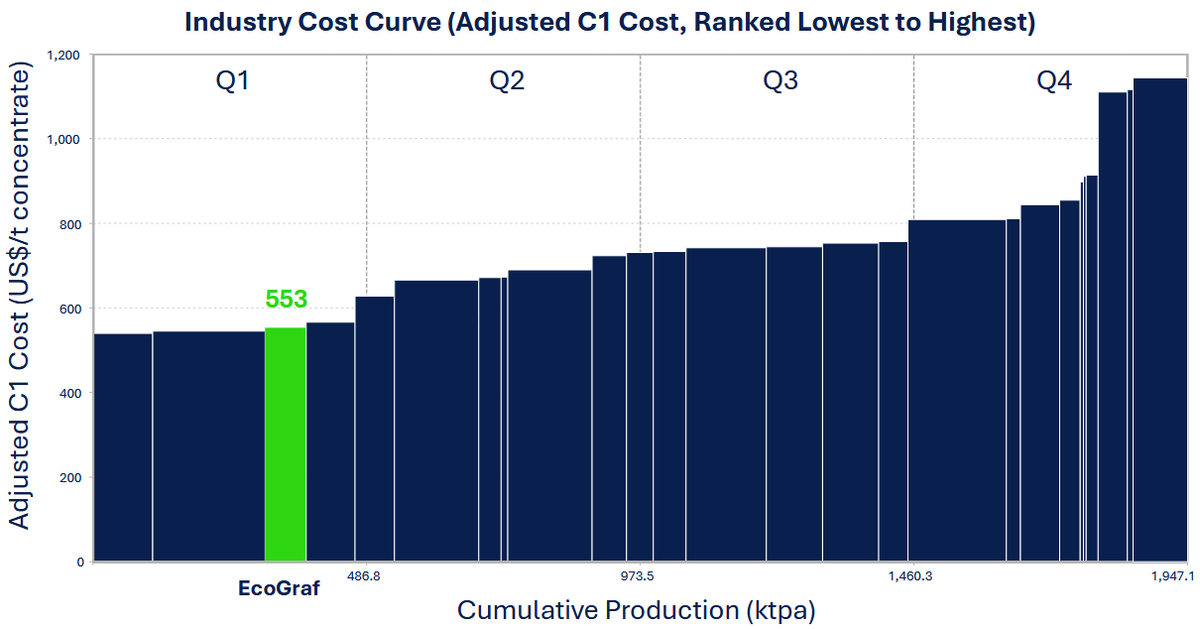
“Epanko Beyond the Cost Curve” - a study that benchmarks @EcoGraf's graphite project in Tanzania in terms of the broader global graphite industry.
The study reinforces the fact that natural graphite isn’t a uniform commodity - therefore traditional C1 cost curves don’t capture what actually drives competitiveness. Benchmarking graphite projects requires a deeper technical lens that goes well beyond operating cost.
After normalising peer costs to a 2026 FOB basis and incorporating product value, Epanko moves from a mid‑curve cost position into the first quartile on a revenue‑to‑cost basis - reflecting a combination of competitive costs, high‑value product characteristics and bank‑level technical validation. $EGR