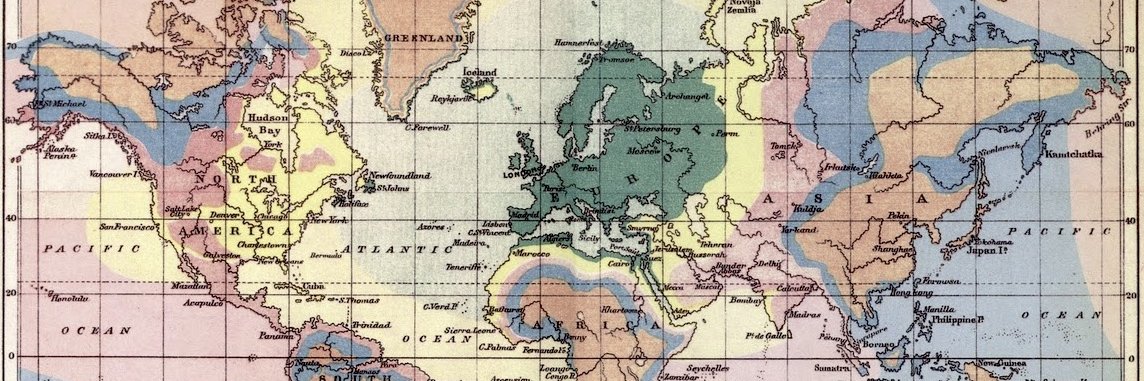
Monarchies, republics and ecclesiastical lands in Europe in 1714.
🔴 – Monarchies
🔵 – Republics
🟢 – Ecclesiastical lands
🟣 – Polish-Lithuanian Commonwealth
Full explanation and maps from other years: https://t.co/jOBHpJ75ON
Estimated Share of White Europeans (Including Those With European Ancestry) By African Country In 1960 vs 2017
More about the debate around the numbers: https://t.co/yaNeA2Fi16
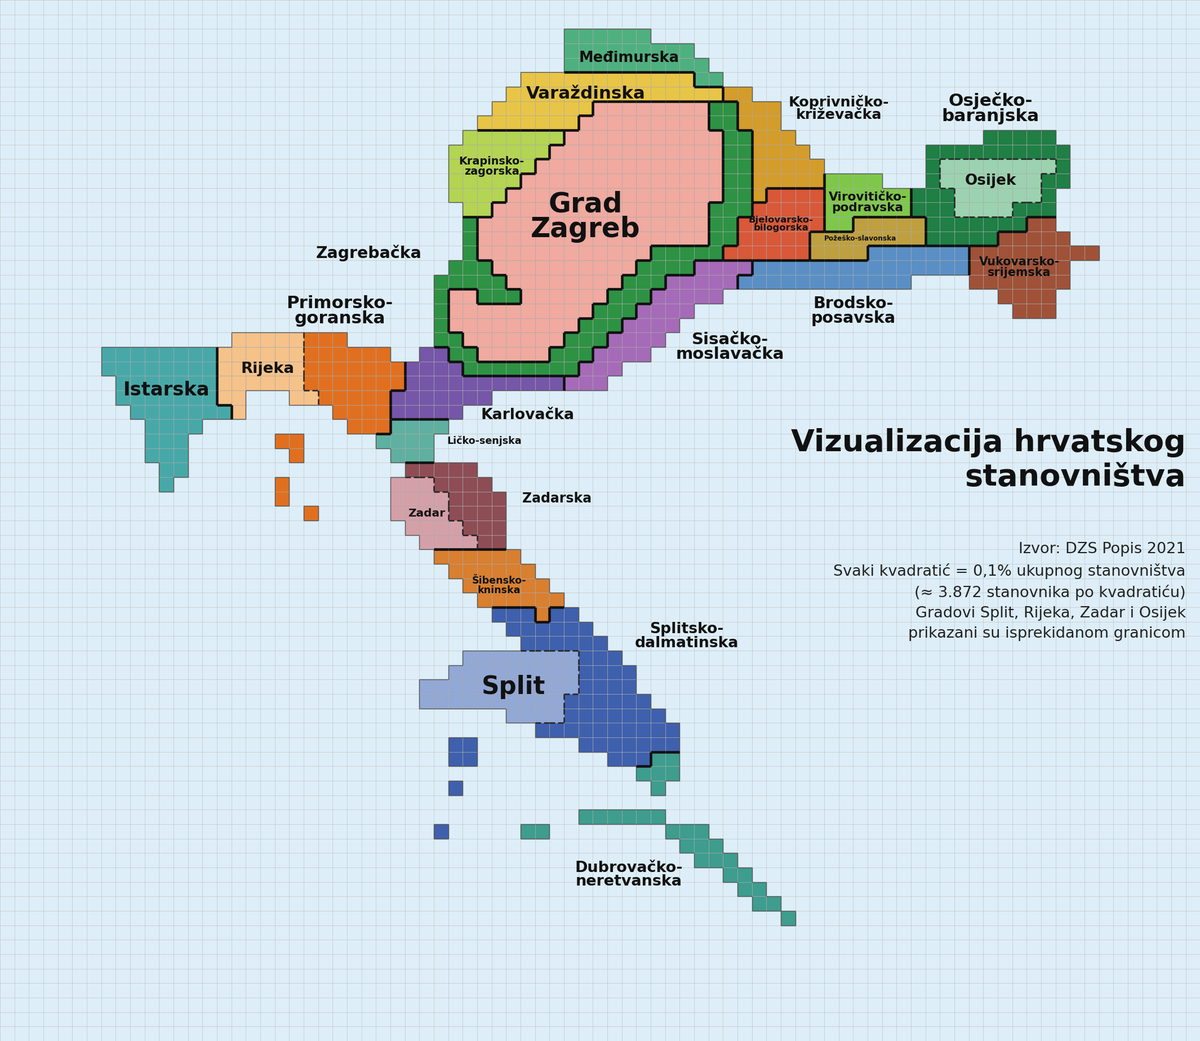
Population of Croatia Visualized
Each square represents 0.1% of the county's population.
Credit: u/loyk1053
Maps for other countries: https://t.co/tfRCcXxGWu
Map of Canada’s “Defense Scheme No. 1” from the 1920s in the event of a war with the U.S.
It assumed that Canada would be unable to defend against the U.S. for long, so it involved launching a pre-emptive invasion of key U.S. cities.
More about it: https://t.co/f9h6YhqgFy
Declassified 1999 Afghanistan Map By The CIA
This 1999 map of Afghanistan is striking because it visually explains why the country has historically been so difficult to conquer, govern, or unify.
Unlike many political maps, this one emphasizes terrain, mountain systems, passes, deserts, and transportation corridors, the features that have shaped Afghan history for centuries.
The most dominant feature is the Hindu Kush, which cuts across central and north-eastern Afghanistan.
These mountains divide the country into isolated valleys and regions, making communication and centralized control extremely difficult. Historically, armies could capture cities like Kabul or Kandahar while still lacking control over surrounding rural and mountain areas.
The map also highlights Afghanistan’s strategic position between major regional powers: Iran to the west, Pakistan to the south and east, Central Asia to the north, and China through the narrow Wakhan Corridor in the northeast.
This geography made Afghanistan a historic crossroads for trade, migration, and empire from Alexander the Great to the British, Soviets, and Americans.
You can also see how few major roads existed in 1999.
Most routes funnel through narrow valleys and mountain passes like the Khyber Pass. Control of these chokepoints has always been militarily crucial. During the Soviet–Afghan War and later conflicts, guerrilla fighters used the terrain for ambushes, concealment, and cross-border movement into Pakistan’s tribal areas.
The southern deserts including the Registan and Dasht-e Margo are comparatively empty and harsh, limiting settlement and logistics. Meanwhile, the northern plains near Mazar-i-Sharif are more accessible and historically easier to hold militarily.
The timing of this map is notable as well: 1999 was during Taliban rule, before the September 11 attacks and the U.S.-led invasion in 2001.
In hindsight, the map foreshadows many of the geographic challenges NATO forces would later encounter, rugged terrain, fragmented infrastructure, isolated populations, and a country where geography strongly favors local resistance over centralized power.
More Declassified 1990s CIA Maps: https://t.co/XgUBDSeiS5
GDP Per Hour Worked By Country
Unexpectedly, Denmark, Sweden & France are higher than the US on this metric.
The full list by country: https://t.co/6dEbbETR50
Throwback Map: The Cheapest & Most Expensive Pints In The UK: Prices By Region in 2018
Even £4.40 for a pint seems like a huge bargain. Routinely pay over £7 in SE London.
How about you?
Source: https://t.co/BW5jJ1yBdS
Declassified 2006 Peru Coca Cultivation Map Created By The CIA
This 2007 CIA map of Peru focuses on coca cultivation patterns and the geography of Peru’s cocaine-producing regions during the mid-2000s.
Like similar CIA and DEA narcotics maps from the era, it combines agricultural data, terrain realities, and counterdrug priorities into a single strategic overview.
The map identifies the major coca-growing valleys especially the Apurímac-Ene Valley (often called the VRAE today), the Upper Huallaga Valley, and the Monzón Valley, which had long histories of coca production and insurgent activity.
Darker green shading indicates denser coca cultivation, while outlined regions distinguish “principal illicit cultivation areas” from newer or secondary growing zones.
One of the most striking features is how concentrated coca cultivation is along Peru’s eastern Andean slopes and jungle transition zones rather than deep within the Amazon Basin itself.
These rugged valleys provided ideal conditions for illicit production: isolation, weak state control, river transport routes, and terrain difficult for government forces to monitor. Many of these same regions had also been centers of activity for the Maoist insurgency group Shining Path during the 1980s and 1990s.
The map reflects a broader shift in the Andean drug trade after aggressive eradication campaigns in Colombia pushed some coca production back into Peru and neighboring Bolivia.
By the mid-2000s, Peru was again emerging as one of the world’s largest coca producers.
Stylistically, the map is very characteristic of post-Cold War CIA thematic cartography: clean borders, sparse colors, and functional intelligence-oriented labeling designed less for public education and more for quickly communicating operational geography, trafficking hotspots, and state-control limitations.
More Declassified 2000s CIA Maps: https://t.co/crnztsV79g
Did you know the largest Lego set ever sold was the LEGO Art World Map with 11,695 pieces!
When finished it measures 21.73 x 15.12 x 5.98 inches and actually gave you the option to build 3 different map designs.
Plus it even included a World Tour Soundtrack you could listen to while building the set.
Unfortunately, it has now been discontinued, although you can still sometimes find sets for sale on Amazon (see below).
See current availability: https://t.co/woHYwhkMJs
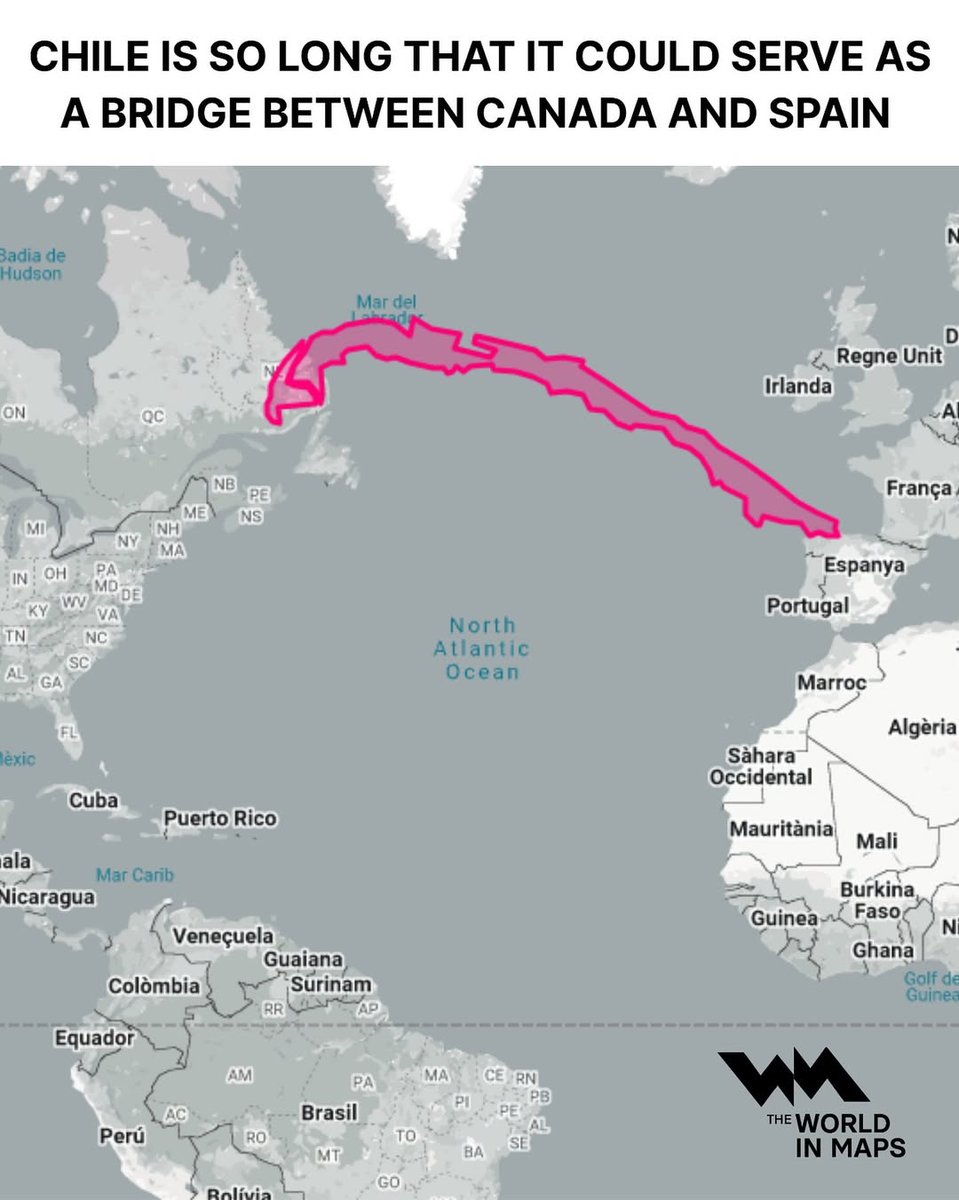
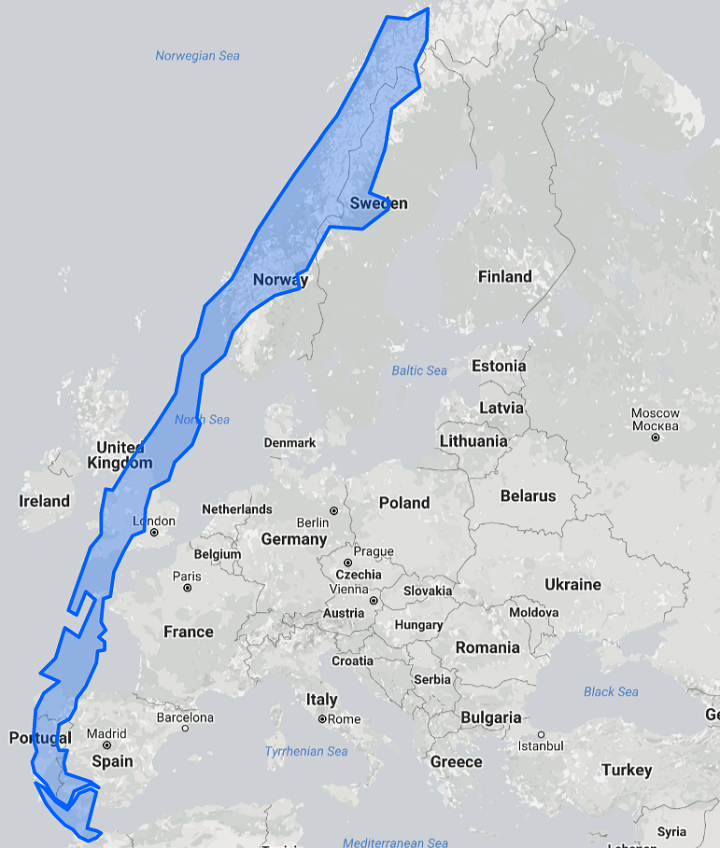
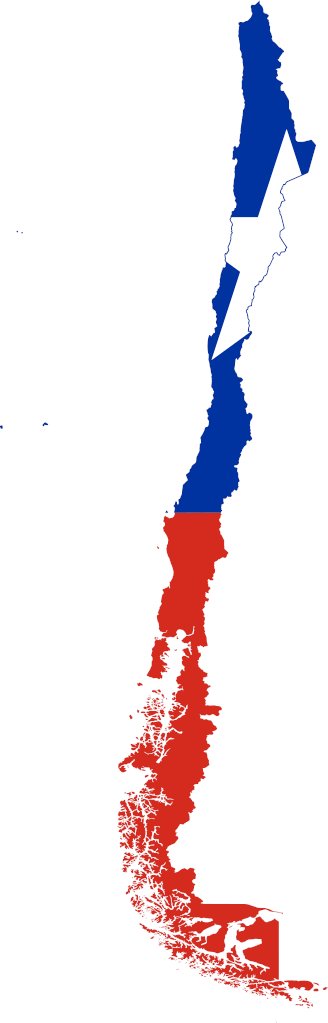
Chile is another classic odd shaped country.
Stretching over 4,300 km (2,670 miles) north-to-south, yet averaging just 177 km (110 miles) in width.
What's your favourite strangely shaped country?
Some more of my favourites here: https://t.co/AvNszPeMNE
Ancestral Background of US Presidents
The map below supposedly shows how many presidents had ancestry from various European countries (Plus Kenya).
Northern Ireland and Wales really punching above their weight.
And Interesting that so far there have been no Presidents with Native, Mexican and/or Italian ancestry.
However, it should be noted this map may not be 100% accurate and there is another version going back 10 generations you can find here:
https://t.co/4jFYFJqOeM