自从7月在Tradingview上分享我的 $MU 交易设置以来,已取得6次波段利润,首次看空!
欢迎同志们去TV点赞关注,感恩!
$MU: Trendline Liquidity Builds — 6th Swing Update
MU remains capped by the Daily Gap and VAH, with price consolidating between $1,000 and $1,120 for nearly a week.
🔘Chart Analysis
On both the H4 and Daily timeframes, MU continues to find support along a rising trendline. Liquidity has been building around this trendline for nearly two months.
Overhead resistance: $1,100 — Daily Gap
Key support: $1,000 — Flipped Resistance Zone
Potential Buy Zones: Around $910 and $850
As mentioned in my previous Idea, bearish divergence across multiple indicators has been confirmed, and the divergence has now extended to the H4 timeframe. This is not an encouraging signal.
Since early July, our long swing trades on MU have delivered five substantial swing profits. However, given the recent strength in the U.S. dollar and Treasuries, combined with MU’s inability to break higher, I’m taking a more conservative approach to the next trade.
🔘6th Swing Trading Plan
(Originally published on Oct. 6 — Updated Oct. 9)
The overall plan remains largely unchanged from my previous Idea, with a few adjustments.
📈 Buy Zone 1: $1,010 — CLOSED
Confluence: Trendline Support + Flipped Resistance Zone
This zone already delivered a 7% gain. I’ve taken profit here, and this entry zone is no longer active.
📈 Buy Zone 2: $960–$900 — STILL VALID
Confluence: POC + Value Area + Bullish OB
I’ll continue to monitor this zone for a potential pullback entry.
📈 Buy Zone 3: Breakout Setup — STILL VALID
I’ll wait for a strong, confirmed breakout above the $1,100 selling-pressure zone before considering a right-side entry.
📈 Buy Zone 4: $866–$840 — NEW
Confluence: Fib Golden Pocket + VAL
This is a newly added entry zone.
In my trading system, when liquidity builds along a trendline, I often look for price to pull back into the Fib Golden Pocket, which aligns with my bullish OTE.
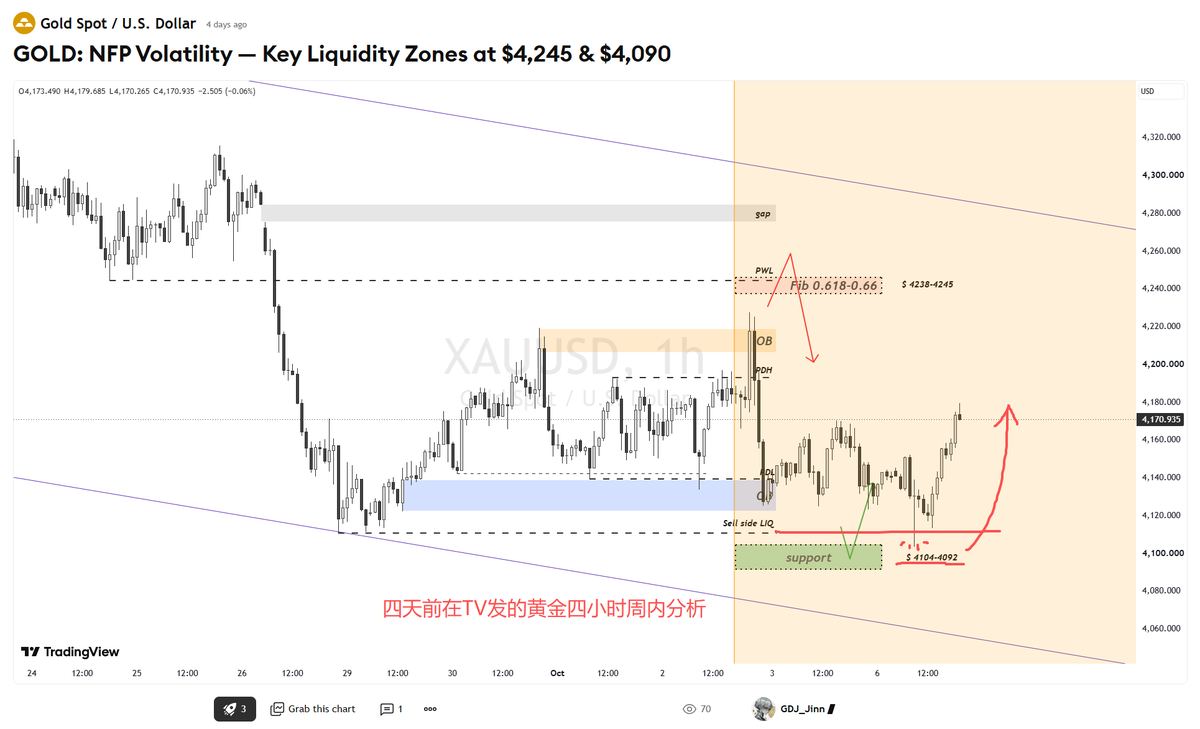
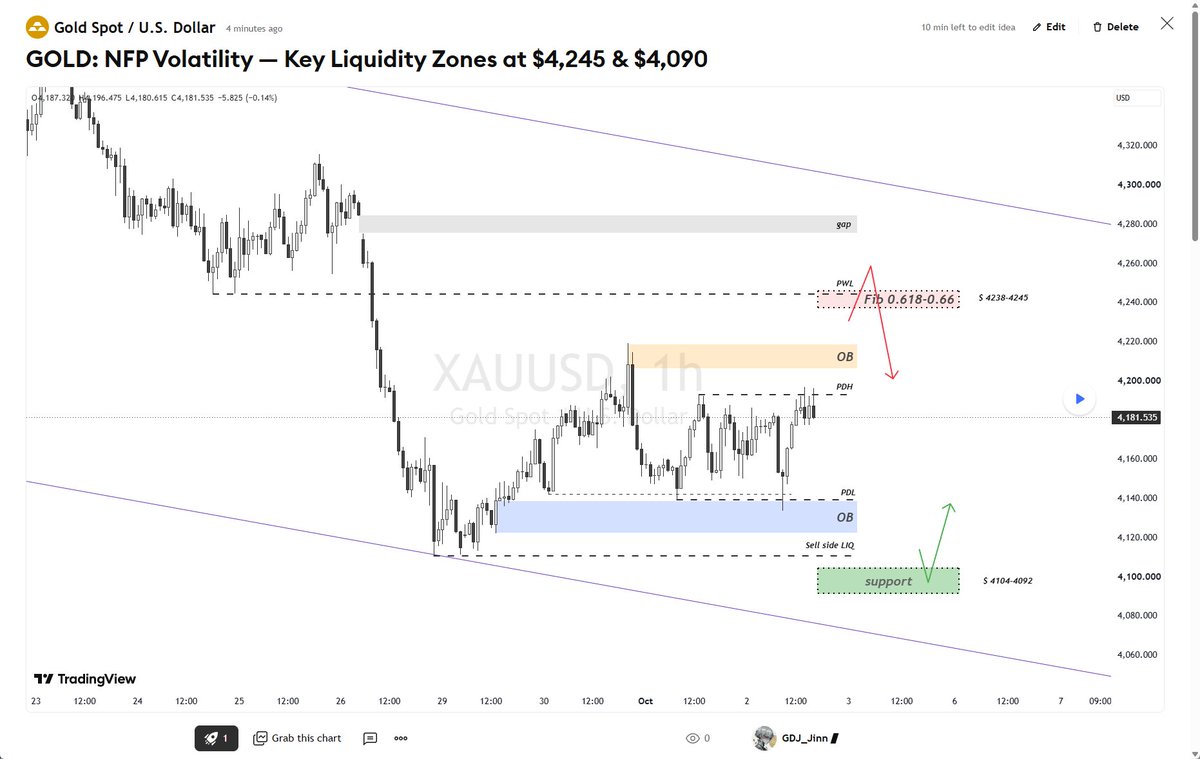
今晚非农的黄金交易计划,欢迎各位同志去Tradingview点点关注点点赞!
Today’s U.S. Nonfarm Payrolls release is expected to bring a sharp increase in volatility.
🔘Key Levels
🔴Resistance: $4,245–$4,250
🟢Support: $4,104–$4,090
🔴Short-Term Bullish POI: $4,140–$4,120
🟢Short-Term Bearish POI: $4,220–$4,206
🔘Market Structure
Intraday
XAU has been ranging between the Previous Day Low (PDL) and Previous Day High (PDH).
Both sides of liquidity have already been swept, but price has not shown a clear directional move yet.
H4 Structure
Using the early-September swing high and swing low as the reference points, gold has continued to trade inside a descending channel.
🔘Short-Term Outlook
The main area I’m watching is the sell-side zone above $4,200.
If price breaks and holds above this area, gold could continue higher. However, for now, it remains a strong resistance zone.
On the downside, the $4,140–$4,120 area has repeatedly prevented further selling and continues to act as a key demand zone.
These two areas form the main liquidity clusters for this week:
$4,220–$4,206 → bearish POI
$4,140–$4,120 → bullish POI
Since NFP can significantly expand volatility, my trading plan is built around these liquidity zones.
📈Trading Plan
🔴 XAU Short
Entry Zone: $4,238–$4,245
(Confluence: Fib Golden Pocket + Previous Week Low)
TP1: $4,190
TP2: $4,140
SL: $4,280
R = 1:2.5
I’ll wait for price to test this area and form an SFP before considering a short.
🟢 XAU Long
Entry Zone: $4,104–$4,092
TP1: $4,140
TP2: $4,220
SL: $4,070
R = 1:3
I’ll wait for price to test the support zone and reclaim $4,110 before entering.
⚠️Execution
NFP can create aggressive two-way price action.
I won’t chase the first news candle.
Instead, I’ll wait for:
Liquidity Sweep → Reaction → Confirmation → Entry
Structure first. Reaction second. Execution last.
今晚非农的黄金交易计划,欢迎各位同志去Tradingview点点关注点点赞!
Today’s U.S. Nonfarm Payrolls release is expected to bring a sharp increase in volatility.
🔘Key Levels
🔴Resistance: $4,245–$4,250
🟢Support: $4,104–$4,090
🔴Short-Term Bullish POI: $4,140–$4,120
🟢Short-Term Bearish POI: $4,220–$4,206
🔘Market Structure
Intraday
XAU has been ranging between the Previous Day Low (PDL) and Previous Day High (PDH).
Both sides of liquidity have already been swept, but price has not shown a clear directional move yet.
H4 Structure
Using the early-September swing high and swing low as the reference points, gold has continued to trade inside a descending channel.
🔘Short-Term Outlook
The main area I’m watching is the sell-side zone above $4,200.
If price breaks and holds above this area, gold could continue higher. However, for now, it remains a strong resistance zone.
On the downside, the $4,140–$4,120 area has repeatedly prevented further selling and continues to act as a key demand zone.
These two areas form the main liquidity clusters for this week:
$4,220–$4,206 → bearish POI
$4,140–$4,120 → bullish POI
Since NFP can significantly expand volatility, my trading plan is built around these liquidity zones.
📈Trading Plan
🔴 XAU Short
Entry Zone: $4,238–$4,245
(Confluence: Fib Golden Pocket + Previous Week Low)
TP1: $4,190
TP2: $4,140
SL: $4,280
R = 1:2.5
I’ll wait for price to test this area and form an SFP before considering a short.
🟢 XAU Long
Entry Zone: $4,104–$4,092
TP1: $4,140
TP2: $4,220
SL: $4,070
R = 1:3
I’ll wait for price to test the support zone and reclaim $4,110 before entering.
⚠️Execution
NFP can create aggressive two-way price action.
I won’t chase the first news candle.
Instead, I’ll wait for:
Liquidity Sweep → Reaction → Confirmation → Entry
Structure first. Reaction second. Execution last.
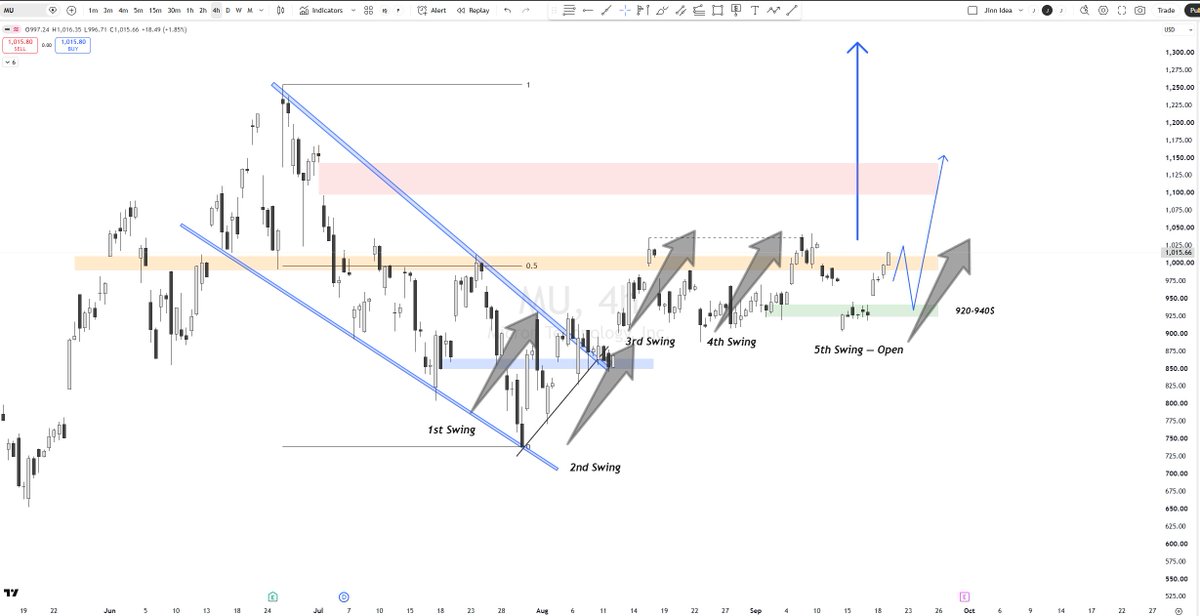
自从7月中旬在Tradingview上分享我的 $MU 交易设置以来,已取得五次波段利润,这是最新的周末更新。
欢迎同志们去TV点赞关注,感恩!
Recently, MU has been consolidating within a range. Consolidation takes time to stabilize, but the broader trend remains clear and directional.
📈Trading Plan
🔘My 5th swing trade is still open.
MU is once again approaching the $1,000 resistance, a key level that has rejected price three times. I’ve decided to take 50% profit here.
🔘From here, my trading plan has two parts:
1. Breakout setup
If MU breaks and holds above the $1,030 key resistance next week, I’ll look to add to the position on the confirmed breakout.
2. Pullback setup
If price pulls back into the $960–$940 zone and shows clear buying pressure, I’ll look to re-enter the portion of the position I closed over the weekend.
🔘As I’ve mentioned throughout my previous analyses, the logic remains simple:
Earnings release approaching + industry recovery
HBM supply remains tight, and the structural demand for high-end memory has not changed.
I’m still bullish on $MU.
顺手更新一下我刚在TV发上的
$BTC 分析,欢迎同志们去TV关注点赞,感恩!
BTC: CLARITY Act Stalls — FOMC Is the Next Catalyst
In my Idea last week, I warned about the downside risk for BTC during the New Moon cycle, when Bitcoin was trading around $79K.
That risk quickly materialized after the CLARITY Act failed to advance in the U.S. Senate, with the procedural vote falling short of the 60 votes required. BTC then entered a sharp decline.
So, what’s next?
The FOMC is now the next major catalyst.
🔘 Back to the chart:
BTC has broken below the $75.5K Trading Range low and is currently hovering around the previous weekly low near $76K.
For now, the structure remains unclear.
📈 Key Levels I'm Watching
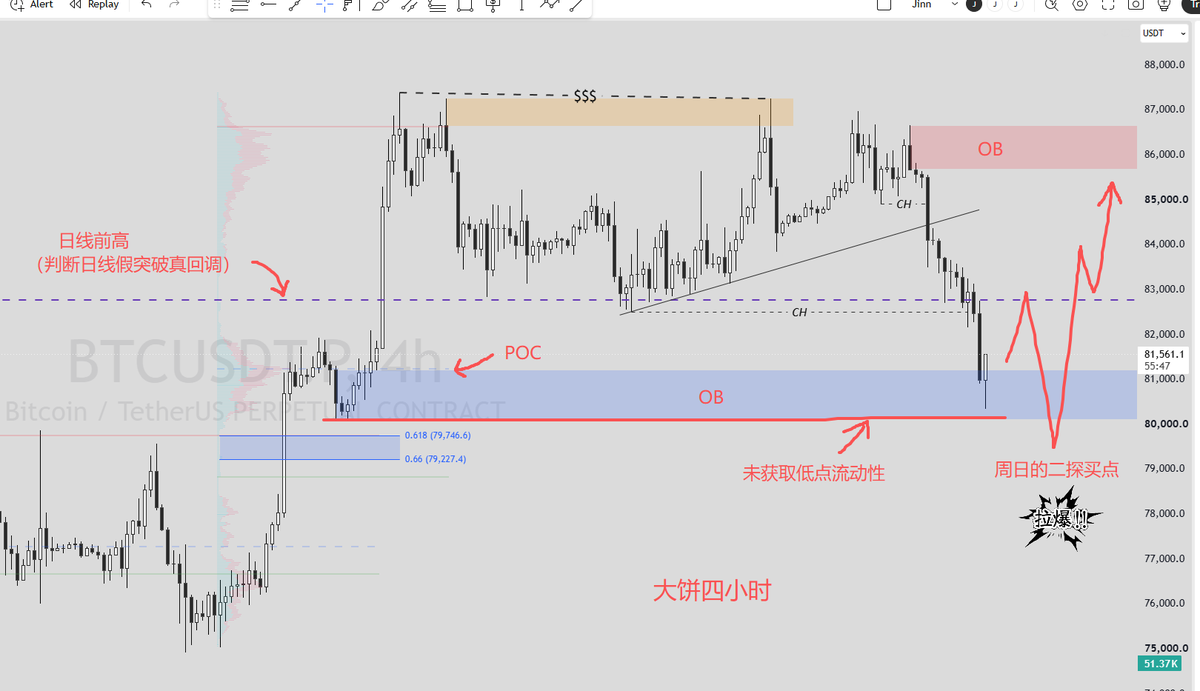
$81K–82.8K — Daily Bearish OB
$79.5K — Fib Golden Pocket + H4 Bearish OB + VAH
$77K — Trading Range POC
(A daily reclaim above this level would make me bullish again.)
$76K — Previous Week Low
$72K–71K — Buy Zone
All of these key levels and liquidity areas are marked on the chart.
🔴 Short Setups
Since BTC has not confirmed a daily breakdown from the Trading Range, I remain cautious about chasing shorts.
1. Liquidity Sweep + SFP
If price sweeps one of the key levels mentioned above and forms an SFP, I’ll consider a short entry.
2. Confirmed Daily Breakdown
If BTC breaks below the $75K area on the daily timeframe with expanding volume, I’ll consider short exposure.
Without that confirmation, I’m not interested in chasing the downside.
🟢 Long Setups
I’ll look for longs after BTC reclaims the $76K Previous Week Low.
If price can reclaim and hold above $77K, we could see another test of the $80K area.
For me, $77 is the key short-term pivot.
🔘 FOMC Trading Plan
I’m also currently participating in the KCGI Trading Competition.
FOMC can produce violent two-way price action, so I’ll avoid chasing the first news candle.
Instead, I’ll wait for price to react around these key levels and look for confirmation from the subsequent price action.
Let’s see whether this FOMC gives us another clean opportunity.
Structure first. Reaction second. Execution last.