Which interest rate matter for US share prices? The answer: US corporate bond yields
Historically, the correlation between US stocks and both US Treasury yields and the Fed funds rate varied between positive and negative.
Yet, the correlation between US equity prices and US
The S&P 500 has had a great bull market over the past 17 years. However, this bull market is very overextended (Chart).
The chart shows the S&P 500 Index in real (inflation-adjusted) terms over the past 100 years. Typically, bull markets peak and bear markets bottom out two
Last month, SoftBank surpassed Toyota as Japan's largest market-cap stock (Chart, top panel).
The only time it happened in history was early in 2000 when the Nasdaq bubble peaked (Chart, bottom panel). History rhythms.
The odds are that global tech stocks have formed a major
The implied correlation among the S&P500 stocks is at a record low. This means there has been significant divergence among individual share prices. I can think of two main reasons for this phenomenon:
(1) Investors are reluctant to get out of the market – they rotate from one
Historically, when industry leaders went public, it often signaled a major top and subsequent bear market.
(1) The largest investment bank, Goldman Sachs, went public in May 1999, 10 months prior to the S&P500’s peak in March 2000 (Chart, top panel).
(2) Blackstone
The Bitcoin is in a classic bear market.
Early this year, it failed to recover above its 200-day moving average (see the chart below, top panel). On the bottom panel, our composite momentum indicator failed to move above the zero line. Overall, the previous technical support
Often, high real interest rates are used as a bullish signal on high-yielding EM currencies like the Brazilian real, Mexican peso, or South African rand.
Yet, this argument is incorrect.
In high-yielding EM, it is the exchange rate that drives real and often nominal rates,
In the US, shareholders continue winning versus employees.
In the whole economy (not just listed companies), the share of profits (operating surplus) in company revenues remains very high by historical standards, while the share of employee compensation is at an all-time low
EM sovereign and corporate spreads are at the narrowest since 2007 (Chart).
Global risk-off will lead to wider EM credit spreads despite high commodity prices.
In the past two years, EM credit spreads have been trading with US corporate spreads and decoupled from commodity
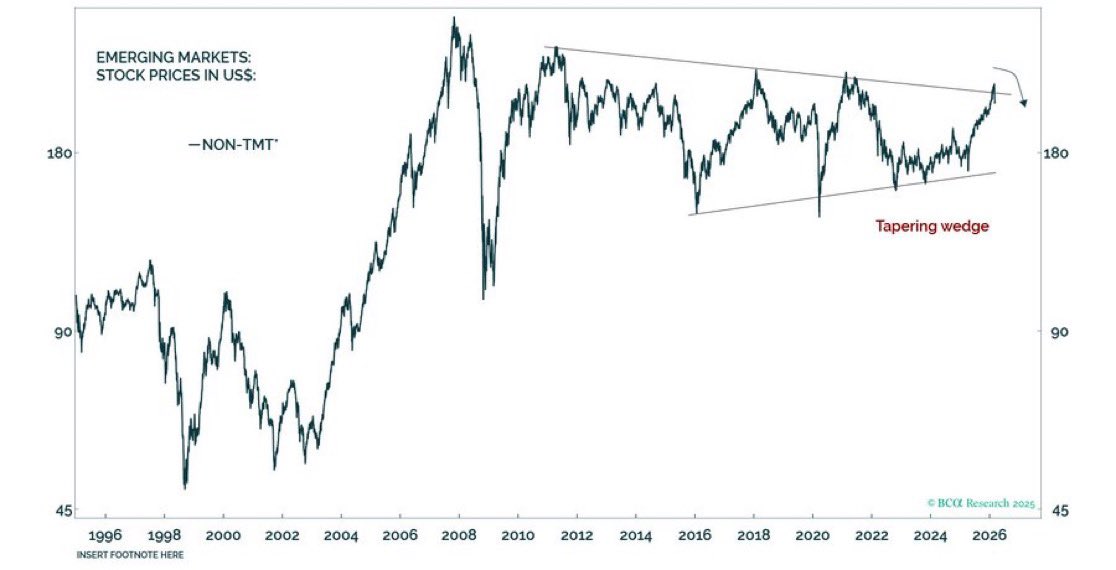
The global risk-off regime has arrived just in time to halt the rally in EM non-TMT stocks at a major technical resistance (Chart).
There is a substantial downside in EM stocks before the technical support line comes into play. Fasten seat belts.
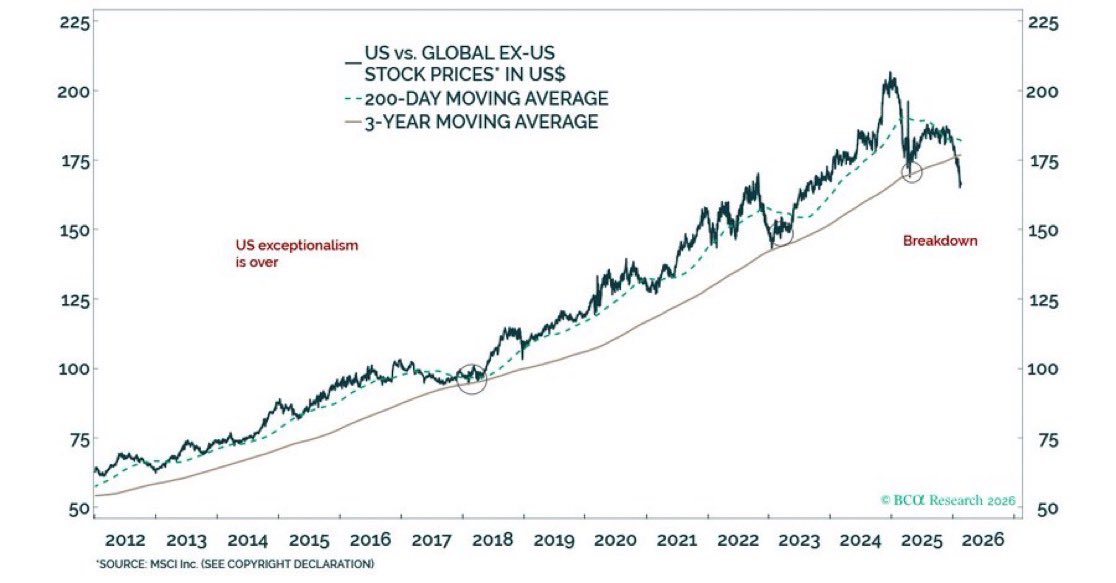
I have been promoting the Get Out of the Dollar (G.O.D.) thesis since last year.
The 15-year uptrend in US relative equity prices versus global ex-US has broken down (Chart below).
The US's relative share prices vs. the rest of the world have broken below the technical lines
Copper prices are heading down. The speculative frenzy in metals might be ending. This frenzy has greatly benefited copper too.
Yet, China's demand for copper remains extremely weak. Its imports of refined copper are contracting at a rate of 20% from a year ago
Do not catch a falling Bitcoin!
In the previous corrections of Bitcoin, our composite momentum indicator bottomed at the zero line (Chart, bottom panel). In contrast, in the current selloff, this indicator has broken below the zero line, but it is not extremely oversold. This
Silver prices in real (inflation-adjusted) terms have surged to the highest, excluding the final spike during the silver short squeeze in 1981 (chart).
Such an interrupted vertical ascent is often driven by FOMO rather than fundamentals. https://t.co/VZYaQLRfhA…
The rise might
Silver prices in real (inflation-adjusted) terms have surged to the highest, excluding the final spike during the silver short squeeze in 1981 (chart).
Such an interrupted vertical ascent is often driven by FOMO rather than fundamentals. https://t.co/uMN6h9redB
The rise might persist in the very near term (days or weeks), but a major relapse is very likely in the coming months.
According to the BoA Global Fund Manager Survey, cash levels among global investors last week reached their lowest level in the survey's history (since 1999).
This is consistent with our proprietary measure of the cash on sidelines in the US and suggests there is little cash on.
In the last 24-hours, one of my dearest friends - @ DanIvesprivate - the 🐐 - the legend - announced the next phase of his storied career. I am so fortunate to have seen him in NY just fresh off the news - - and even more blessed to know him as my friend. Congrats Dan!!!!