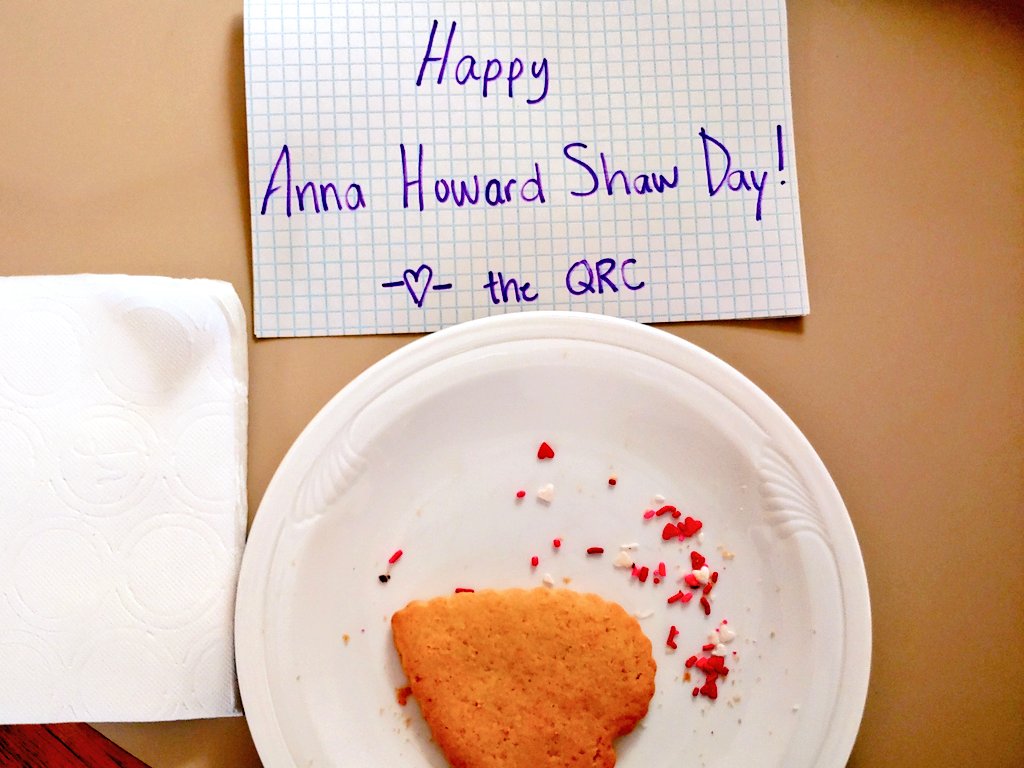
Got those Week 9 lab reports to finish? Putting the finishing touches on your graph and want a fresh pair of eyes? QRC Office Hours with Lin start now! https://t.co/QyGEW8v06T
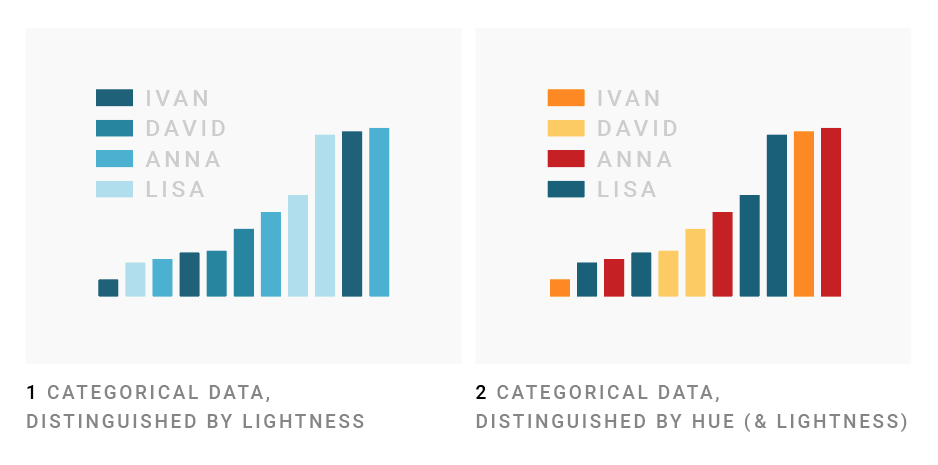
Dear #dataviz peeps, let's discuss: Is it ok to differentiate between categories with lightness, or should we use hues?
Different data viz book authors seem to have different opinions. 1/6
#DataVisualization can help us make sense of and teach about the coronavirus, but the stakes are high. @abmakulec has 10 considerations to help you #VizResponsibly:
https://t.co/OJLTs1tIvn
How does the novel coronavirus measure up? Check out one version of the story in this week's What’s Going On in This Graph? and don't forget to ask yourself, "I wonder how they calculate these numbers?" ... https://t.co/eGAbjNKBkZ #dataviz#coronavirus
Interested in species conservation, messy data, or creative quant problem-solving? Check out the talk today at 3:30, "Addressing Conservation's Data Problem" with @umontana post-doc Hannah Specht, Anderson 329
https://t.co/zJ02iXW4JG
I've taught @Tableau as my primary job for nearly 5 years. This thread lists my favorite online resources for those who know the basics.
(I'll also be launching my own online beginner class soon)
Always Be Googling. The answers to Tableau questions are often readily available.
After a Decade of Hiring, Plenty of Jobs but Raises Are Tiny https://t.co/C1XeePxWw2 so many stats and graphs to dig into here! Until then, I have more questions than answers....