Nifty 50 (Weekly Time Frame): Technical support levels are identified at 21,947 -21,900. The price may consolidate within this range for a period before potentially moving lower towards the support zone. We will monitor market behavior closely and adjust our approach accordingly
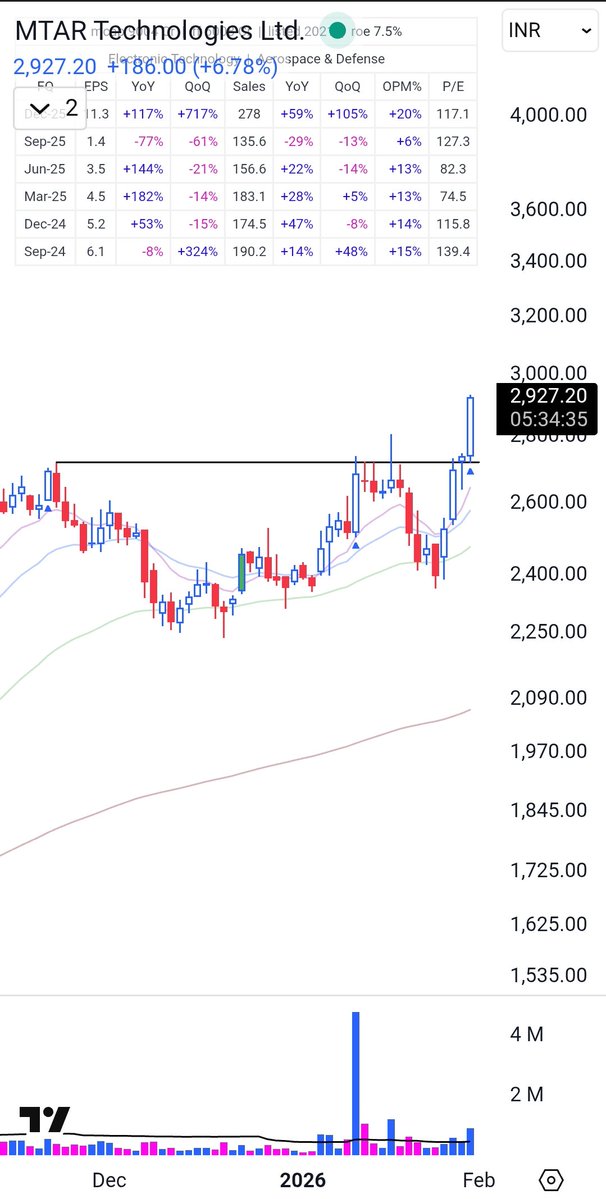
Nifty mid and small-cap 400 versus the stock price! 📈 It's really showing some outstanding relative strength. Take a look at this chart. 👀 Very interesting to see the price action here. 📊 ✨
Don't fix your stop loss in your brain - instead, fix it in your system. The brain can be manipulated by emotions.
You may not sell the stock even though it breaches your fixed stop loss in the brain.
Be calm in any situation and always try to control your emotions.
"Uncontrolled basic emotions are the true and deadly enemy of the speculator." — Jesse Livermore
The chart is nothing but human emotions printed as candles,bars.........
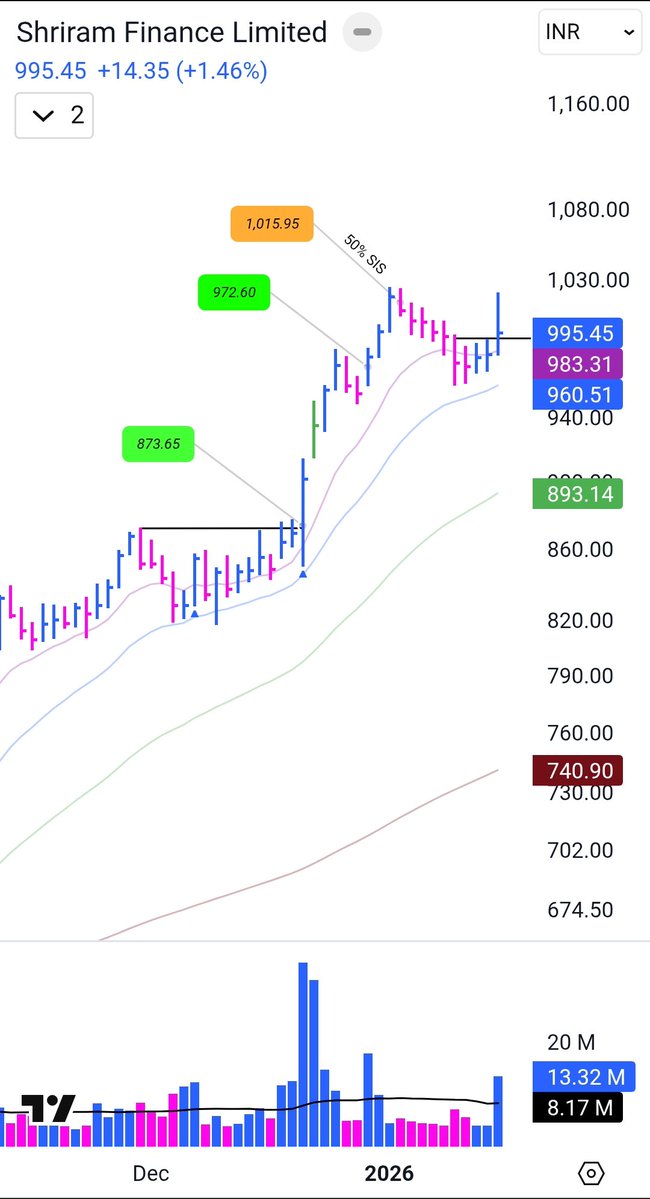
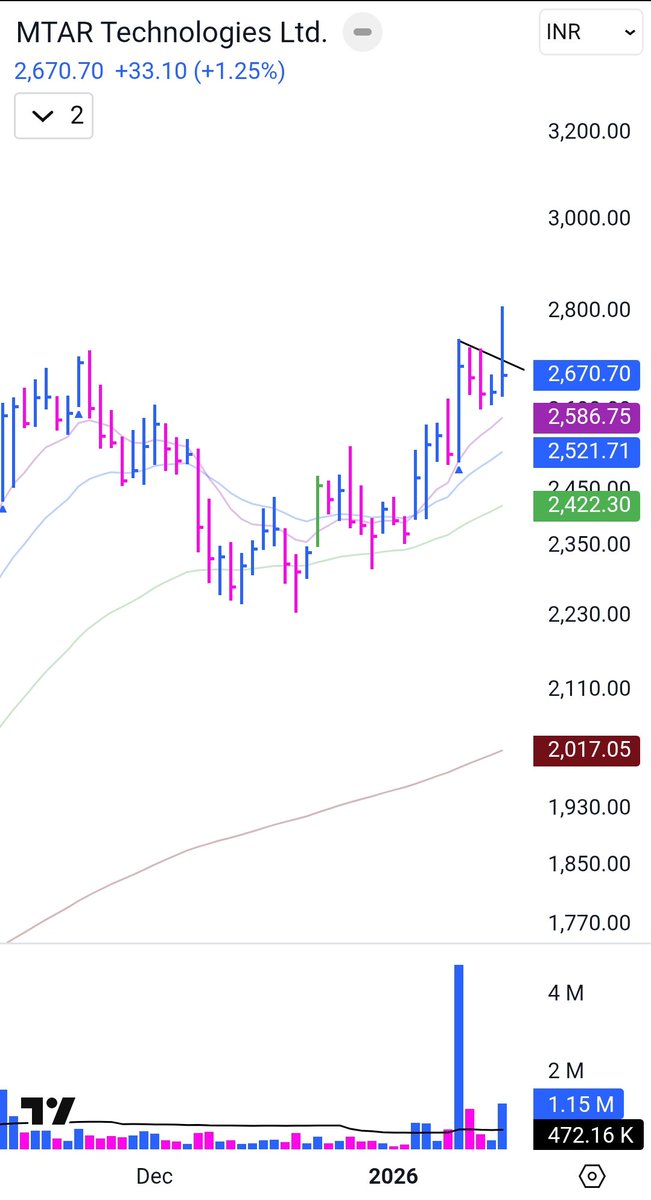
The price rejection from the top. I'll watch for price action here to see how the price behaves. here Both the scenarios are different and the setups are also different
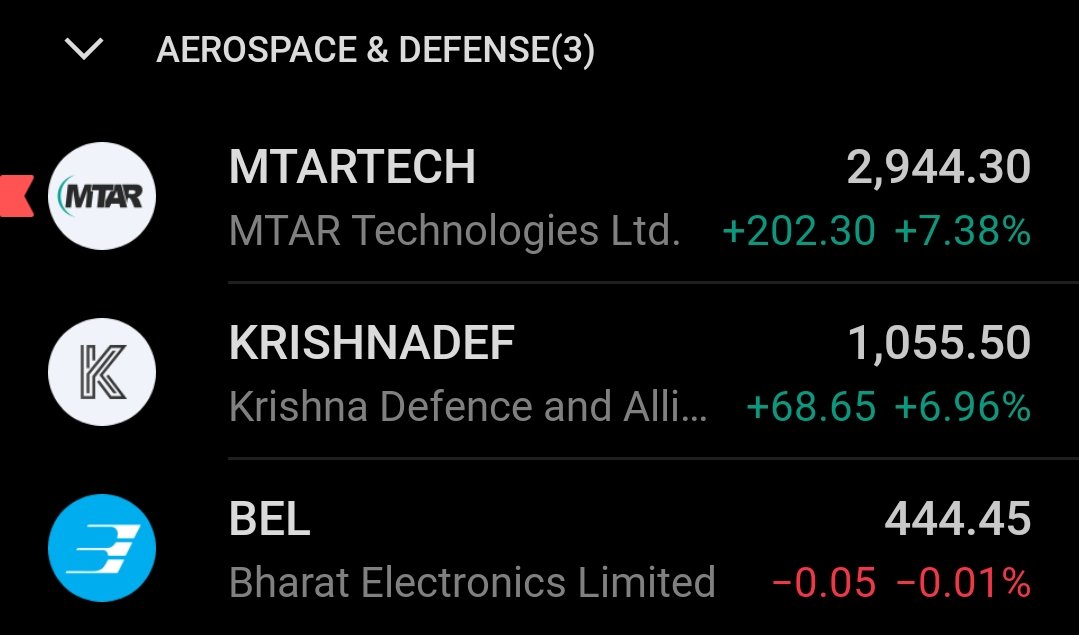
The number of strong Rs stocks plus 52-week highs passed my screener by market capitalisation:
60 stocks - Large cap
24 stocks - Mid cap
28 stocks - Small cap
3 stocks - Micro cap
The money parked in large caps in recent times many large caps showed the strength.