Chartink provides India's Most Advanced Technical Scanner/Screener along with the finest Technical Charts with more than 100 technical indicators & combinations
@codeandtrade Hello,
Thank you for your patience, and apologies for the inconvenience. The issue has been resolved. Please try refreshing the page, and let us know if you encounter any further problems.
@mehraj_fehmi Hello,
Thank you for your patience, and apologies for the inconvenience. The issue has been resolved. Please try refreshing the page, and let us know if you encounter any further problems.
@thesysauditor Hello,
Thank you for your patience, and apologies for the inconvenience. The issue has been resolved. Please try refreshing the page, and let us know if you encounter any further problems.
@karanshah137@ArunKum99882137 Hello,
Thank you for your patience, and apologies for the inconvenience. The issue has been resolved. Please try refreshing the page, and let us know if you encounter any further problems.
@ArunKum99882137@TheVwapLeopard Hello,
Thank you for your patience, and apologies for the inconvenience. The issue has been resolved. Please try refreshing the page, and let us know if you encounter any further problems.
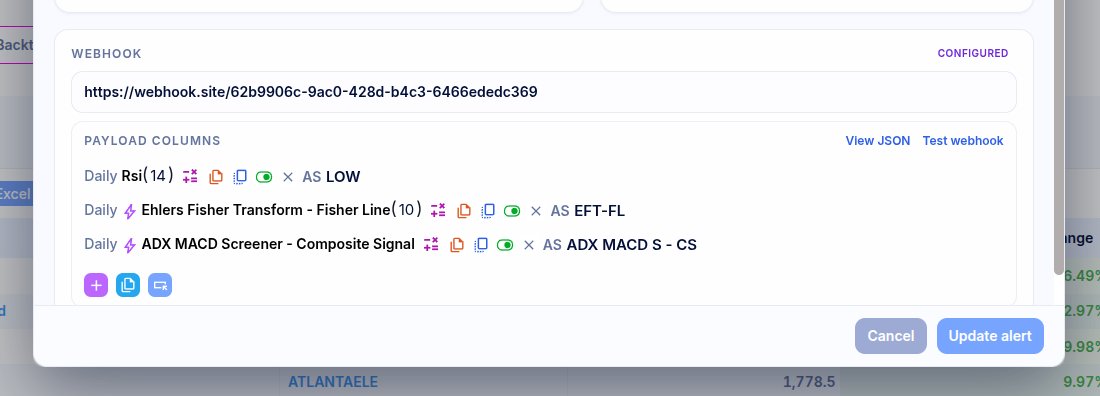
Custom columns now supported for alert webhooks. No limits.
You can now shape webhook payloads per alert, preview the exact JSON, and test the webhook before saving, without changing the scan itself.
@AnkurMishraMH We ignore/skip pre-market data for Intraday candles, our daily candles include the pre-market values as well. This is done to avoid noise in the Intraday candles at the opening that can skew technicals
New in backtesting: Stock Timeline.
See every stock’s scan history across time, spot recent triggers faster, and understand recurring setups without endless scrolling.
Watch the quick tutorial 👇
https://t.co/QNltnfBC8l
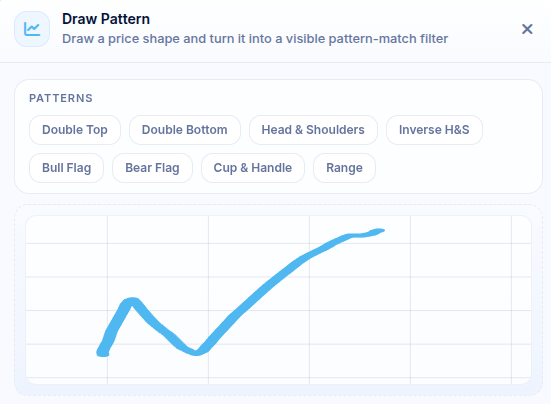
@Saillesh4 We've added a upload image/screenshot in the draw area that allows you draw patterns automatically, also, right clicking on the chart should show a find similar stocks that auto plots the current pattern for scans
Draw it. Scan it. Reuse it. ✍️
You can now draw a pattern on the scan page and save it as a visible, editable filter — not hidden logic. It works on price, RSI, custom indicators, and more.
Your chart pattern, now instantly scannable.
https://t.co/zsEib8RrmY
@jaganimeet89 Parameters:
Source - any indicator
Min bars - defaults to 22
Max bars - defaults to 85
Accuracy - defaults to 85%, identifies how close we are to the drawn pattern
Resample bars - defaults to 15, the number of candles checked at a time to see if they match your drawn pattern
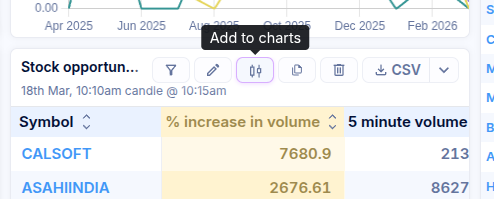
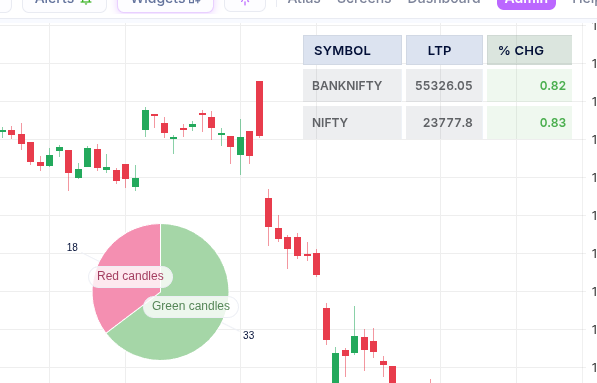
Bring your favourite widgets straight onto your charts with the new “Add to Charts” button on every widget.
Analyse, compare, and act faster by keeping all your key insights in one view.
https://t.co/KJMWR9n6mB
Your scan results, your way.
Customise the Columns section and its colors to highlight exactly what matters. Reorder metrics and build a results view tailored to your analysis style.
https://t.co/wmKEbbHkB2
Your scan results, your way.
Customise the Columns section and its colors to highlight exactly what matters. Reorder metrics and build a results view tailored to your analysis style.
https://t.co/wmKEbbHkB2
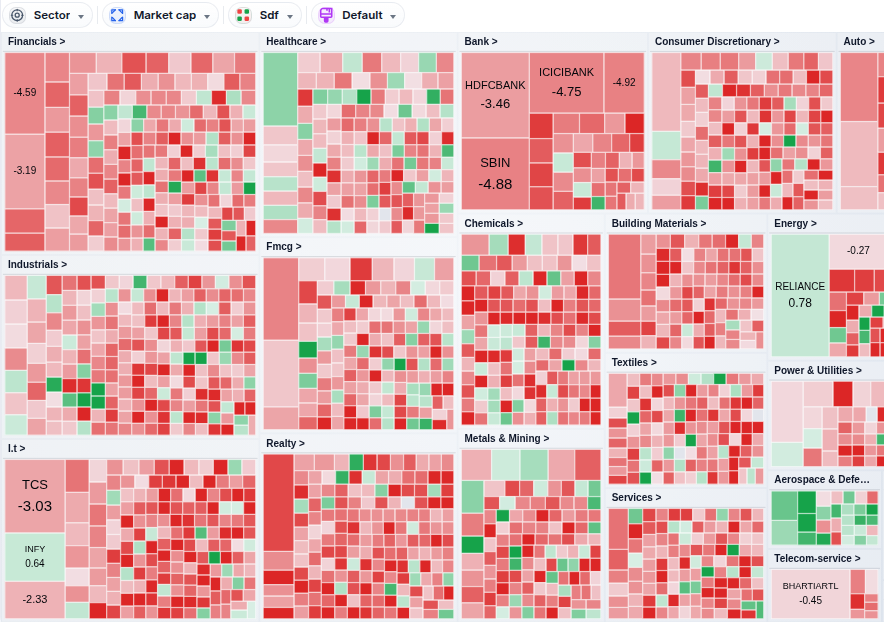
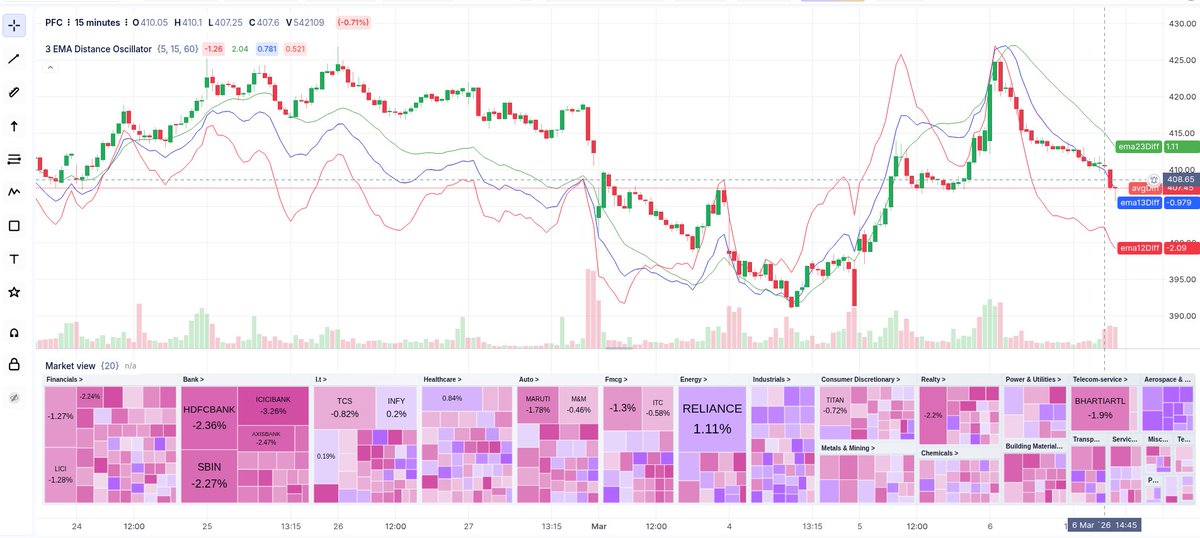
Introducing Heatmaps in atlas widgets, a powerful visual tool that displays real-time market data using color-coded tiles to represent performance. Customise tile size, color, group using metrics like market cap, % change, or any indicator!
https://t.co/Y2g1lnli2T