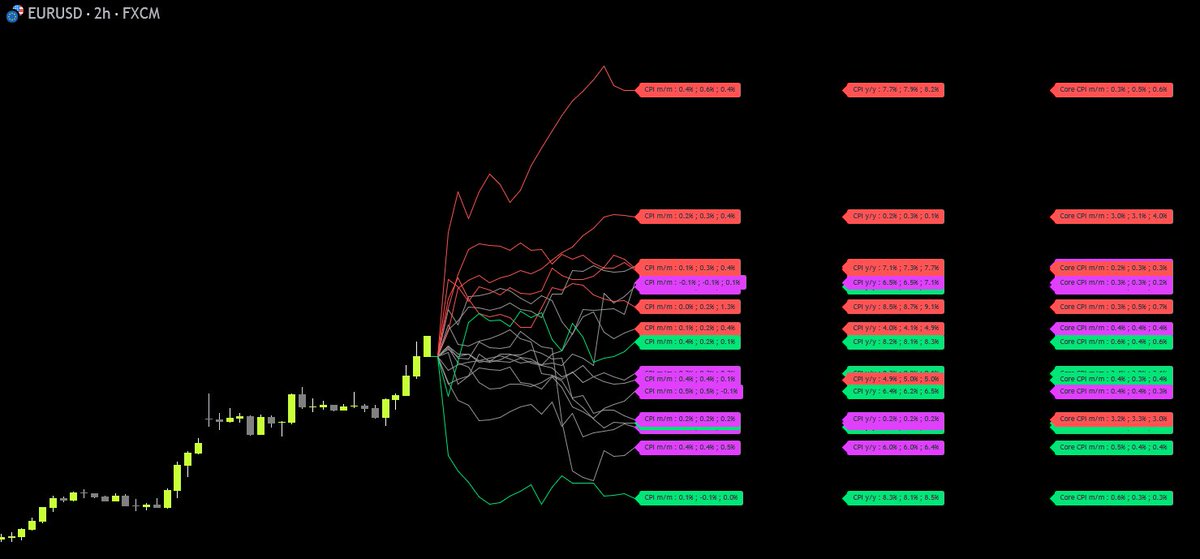
I just launched my premium indicator suite.
Includes the News Reaction Indicator — the strategy that made me 144% in a year, use news don't fear it!
See how price moved every time CPI/NFP beat or missed expectations. It's like a cheat code
Link in bio.
@ZenomTrader Being an organising powerhouse is like the new superpower. Coding itself is the trivial thing. Organising all the stuff you build, all the backtests, all the ideas etc is the hard part. The amount of output you can reach is so overwhelming at this point you need to manage it.
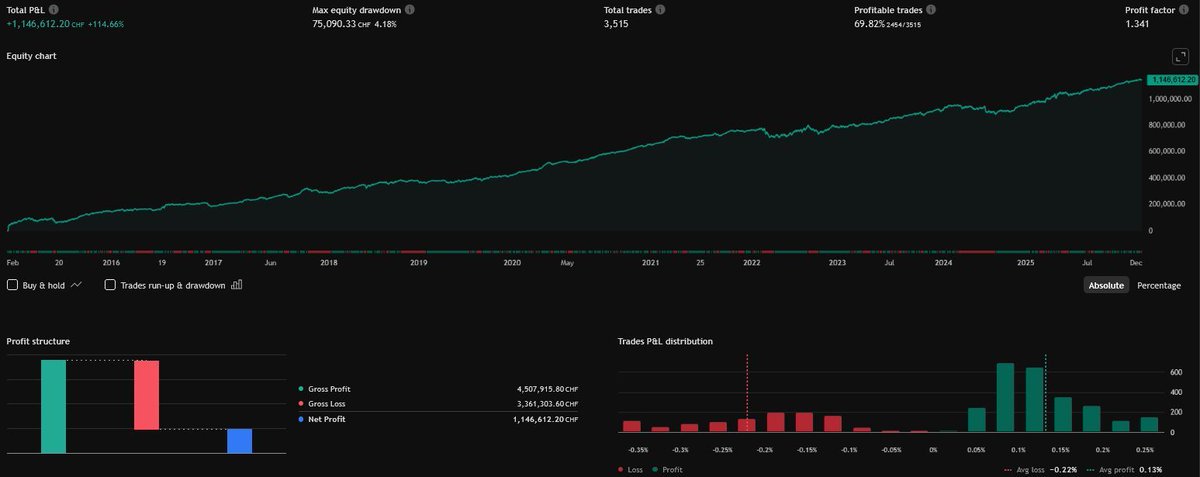
Mean reversion EURCHF scalping.
If there ever comes a broker or prop firm without trading costs you can literally go to 100K in payouts in a couple weeks. They be out of business asap
Guesse will just have to keep dreaming as for now this thing does not work.
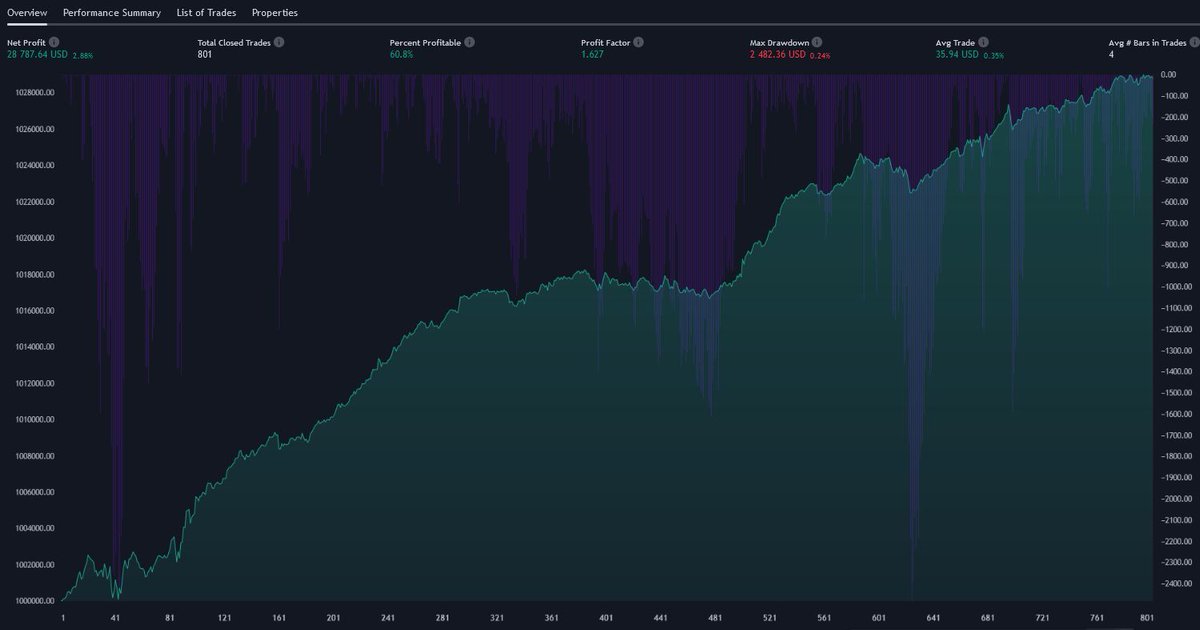
Handling huge drawdowns is not to be underestimated. Hypothetitcal u deploy at red line.
Are you able to keep believing in the system and wait out this almost 4 year long drawdown or would you hop to a new system?
Systematic trading can be brutal at times
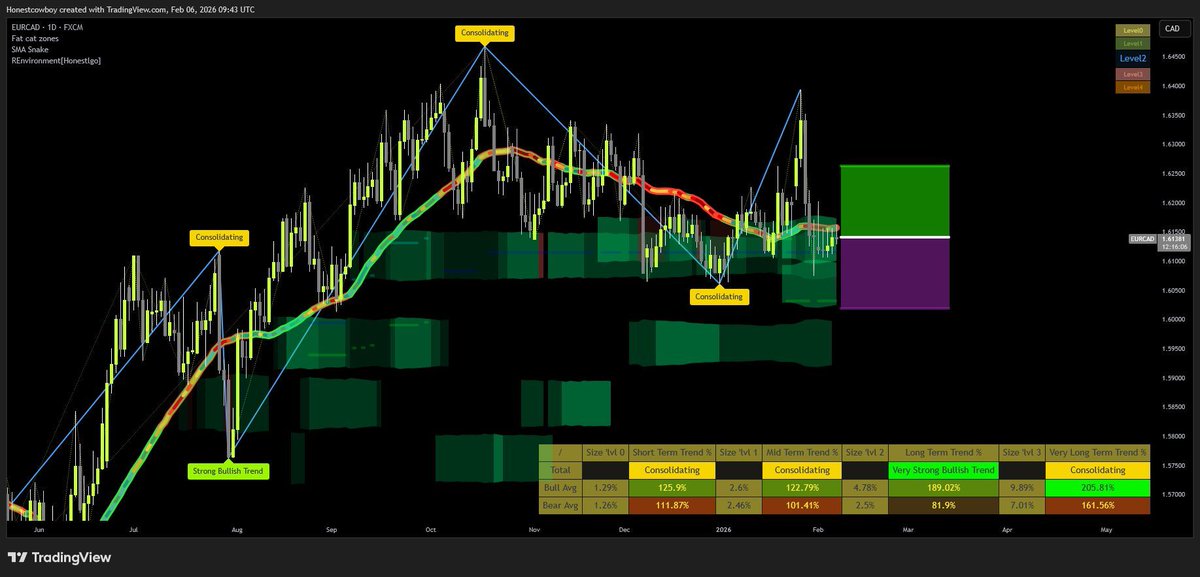
Would you personally wait for a bigger reaction from a support zone?
Or is given the context and the amount of support here, it's better to just get in now you can enter cheap.
EURCAD daily chart FAT CAT bounce setup
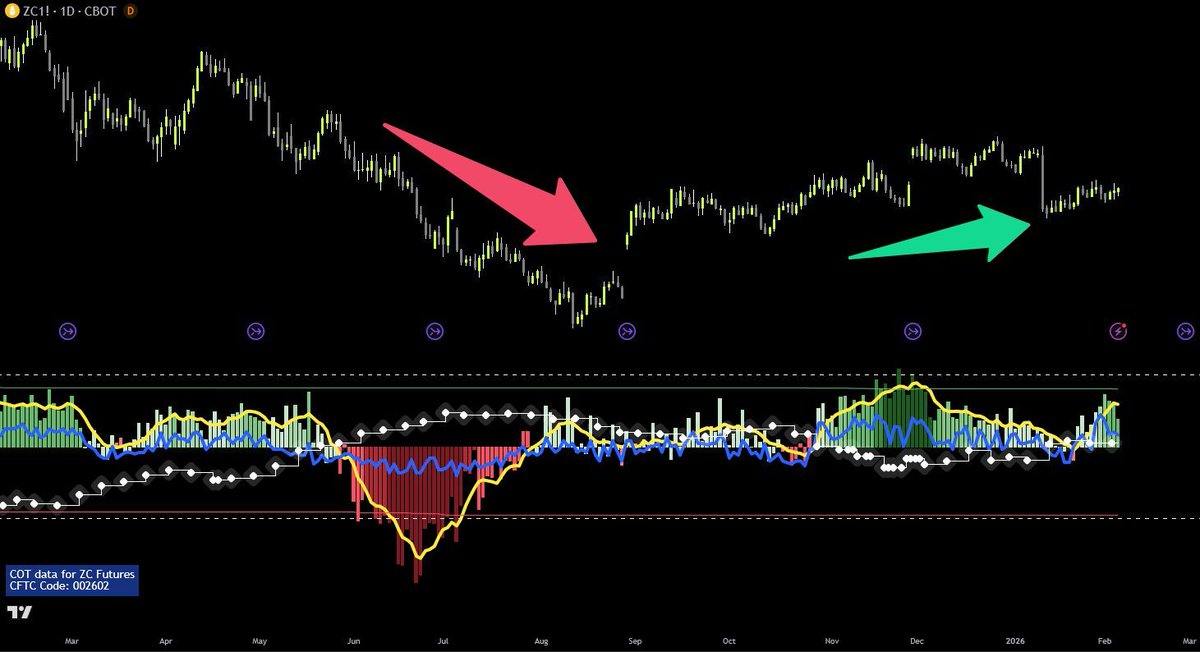
Last years price action on CORN was very easy to predict using seasonality.
Agricultural and meat futures are the easiest markets to trade.Just follow the seasonal trends.
Highly liquid and somehow nobody talks about them.
It literally only takes 2 minutes to go through about 30 pairs to look for setups.
Routine is simple, morning check the daily and H4
4h later right before going to work check the H4 again
After work do a quick H4. That's just 6-10 minutes a day trading.
It's inevitable that some of the strats you're using will stop working. When u finally find a trading strat that works for you, don't stop!
To really feel secure in the market need atleast 3 but 10+ is better.
Every 6 months check which ones still working re-evaluate the portfolio.
Fibonacci levels are incredibly powerful in trading if you draw them right.
On the chart marked 4 reactions from the 0.382 fib and clearly price touches it and then gets insanely quick reactions.
Used to believe it's just like this astro bs moon celestial patterns but this one just feels like cheating.
When a trend is as strong as this one and your trade is in big profit.
Would you cut size and start taking profits. Or is increasing risk dynamically a better approach?
In hindsight going balls deep increase risk a ton here seems the good play but is it?
Tired of losing so many trades in a row? Being in drawdowns all the time.
The easy fix is just use bigger stop losses and smaller take profits.
Without changing the signal, your equity curve will look much smoother, with some big spikes down but that's it.
Most of the time it will feel solid and like your winning all the time.
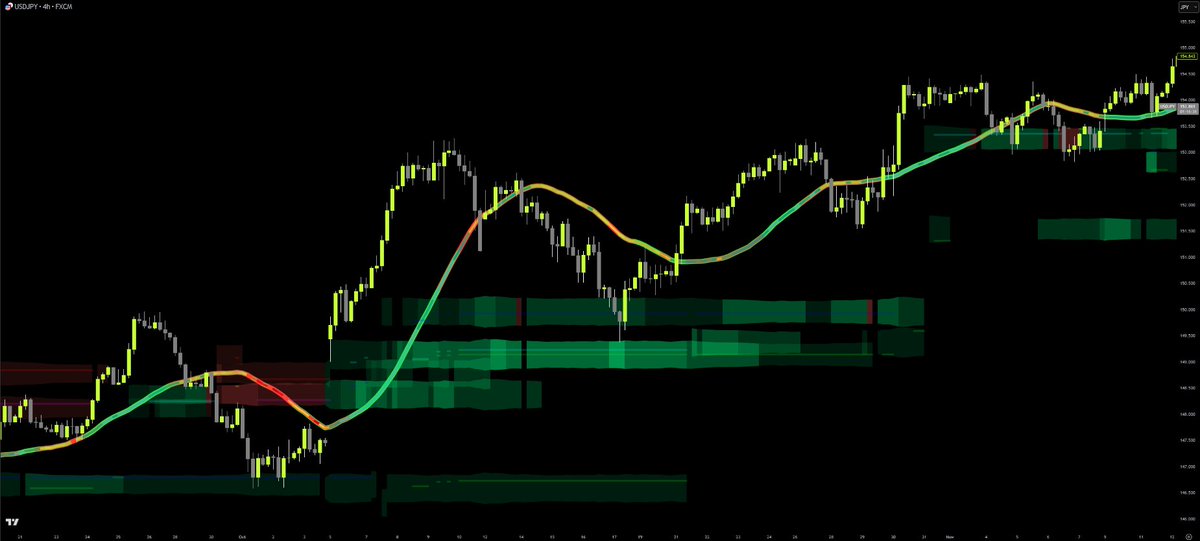
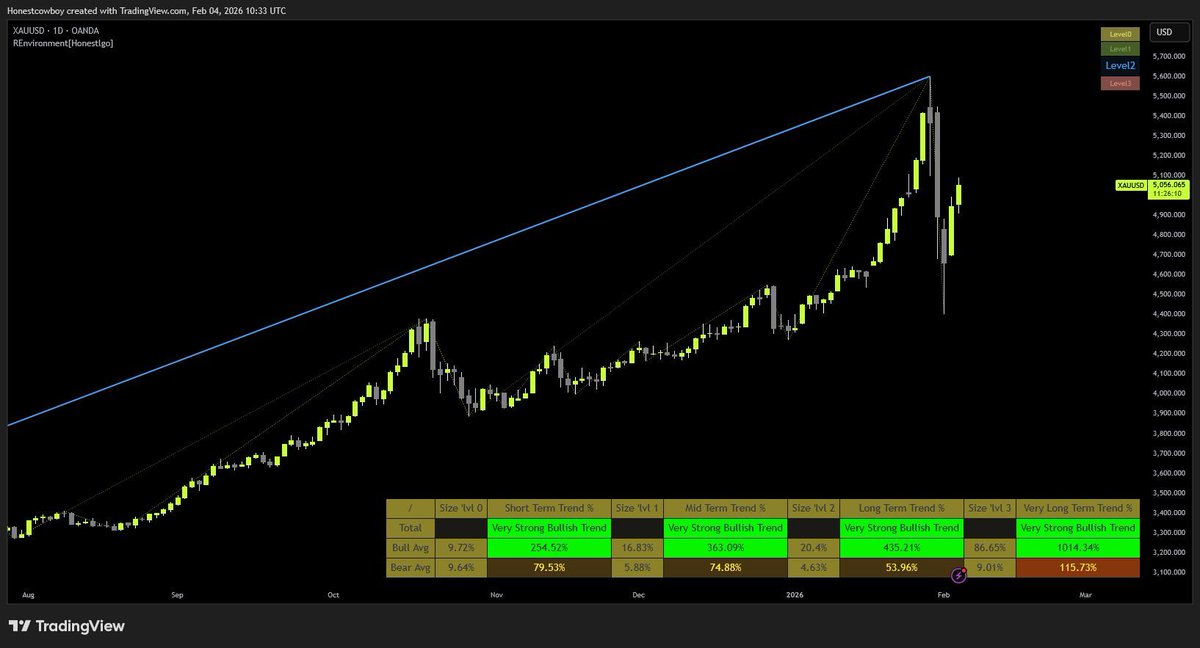
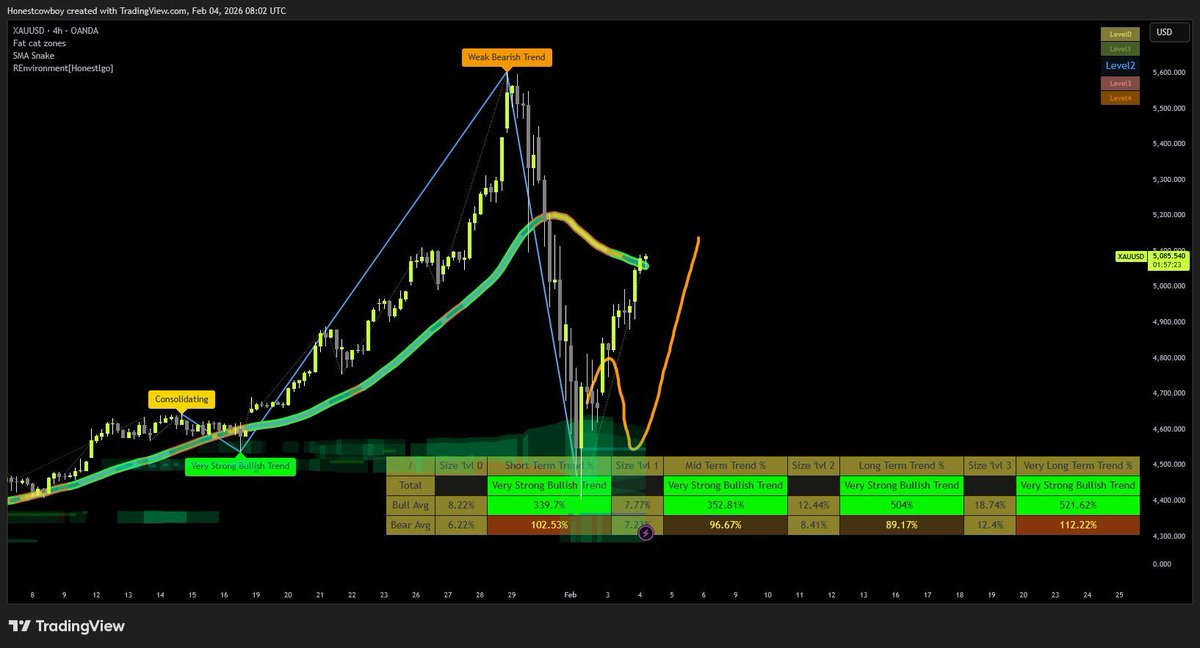
Quick tip for trending markets like XAUUSD and NQ:
Don't fight alignment. When short, medium, and long-term trends all agree, that's when you size up and hold longer.
Mixed signals = small size. Aligned signals = conviction.
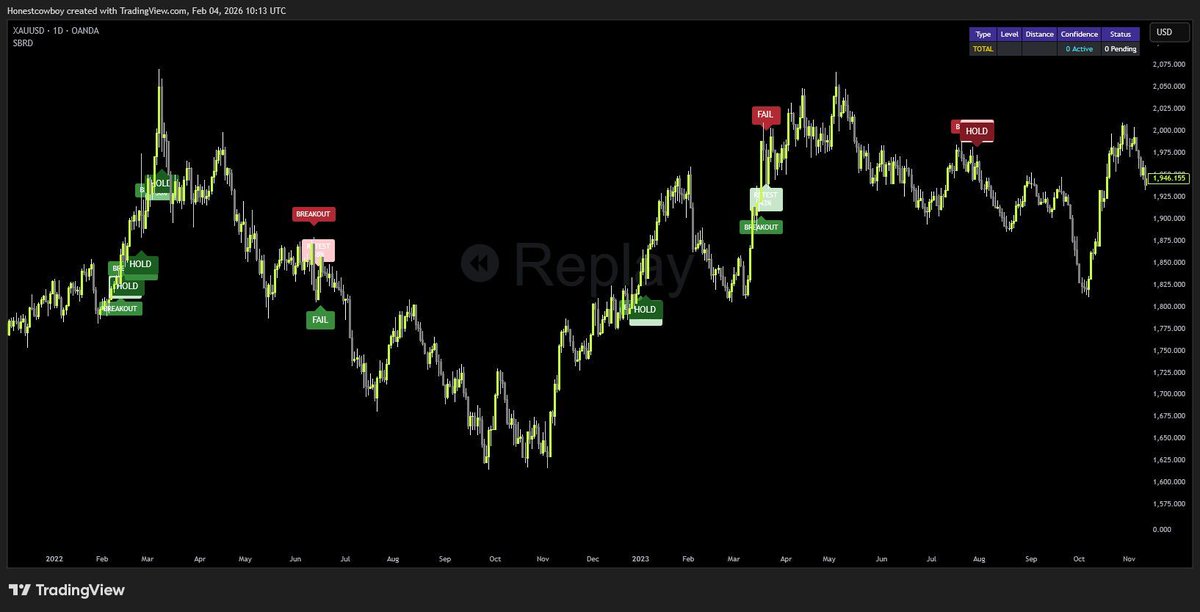
Working on some break and retest indicator, so far it is a bit good.
It will look for high volume, high momentum breakouts of highs/lows and look for a quality retest.
Any break and retest trader that knows some ways to differentiate between low and high quality setup?
Gold made an insane drop last days destroying a lot of retail.
I tweeted about a nice setup on this but was waiting for a double bottom to catch the reversal.
Gold reversed very strong from this zone, next time shoukld enter using small risk high target on such setups.
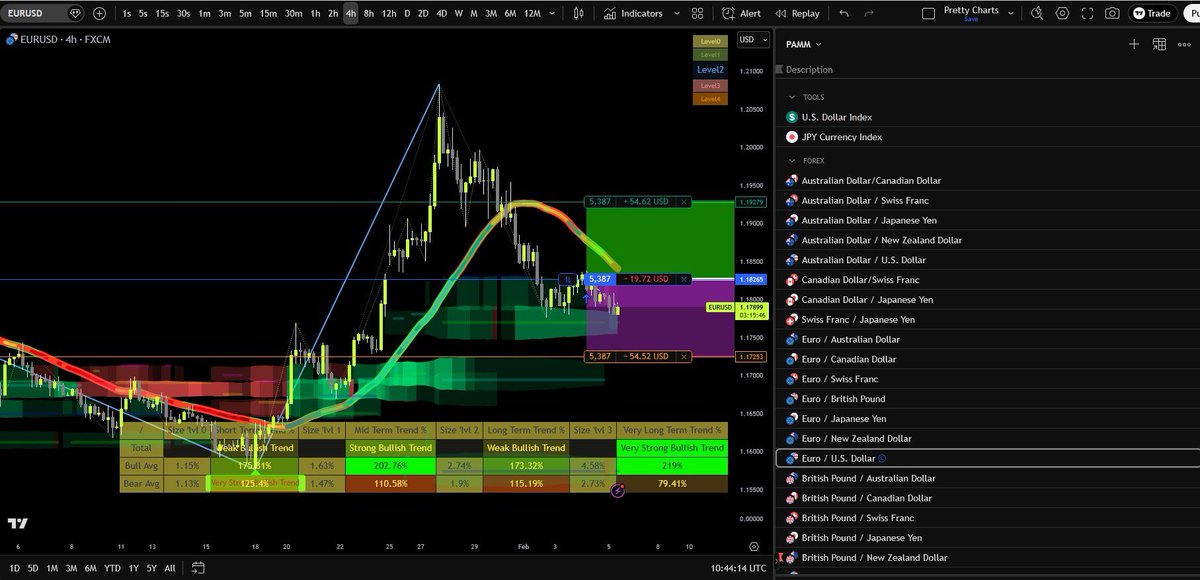
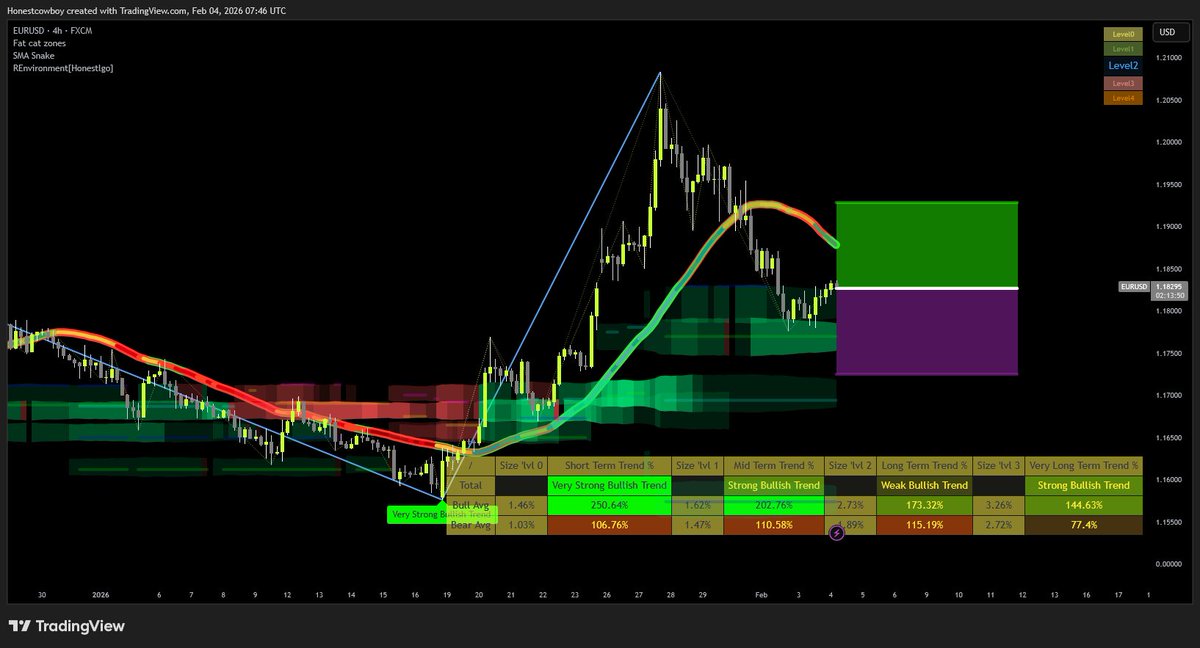
There's 2 strategies I use in forex. Bounces from support/resistance like this trade just took.
News trading based on expectation being broken.
It's a very difficult market so if anyone has a different approach that works concistently let me know.
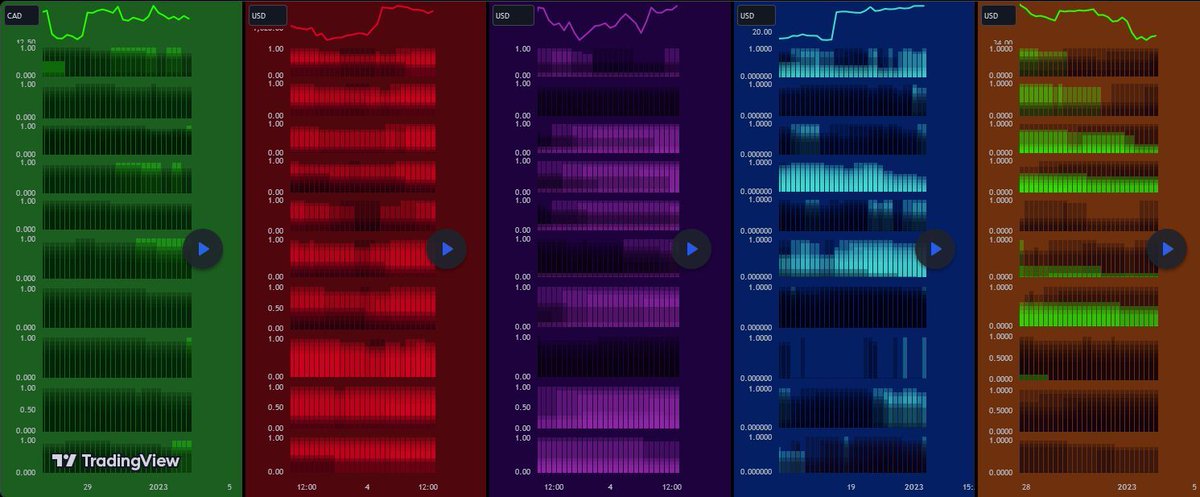
Profitable trading is boring just like a regular job.
Just visualising your system in the most premium looking eye candy way can help with that.
The process will still be boring, but atleast you open your screen and think wow! Nice chart, I can do this.
Even something simple as Seasonality can be turned intoa very high winrate system.
Instead of just looking at a seasonality equity line I personally love the oscillator approach.
Fit all the data into something more actionable, backtest the signal no repaint just raw
If it works for the pair it works, if it does not work well just leave it at that move on.
Simple to the point, profitable
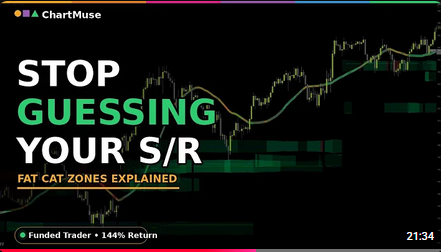
Just dropped a video explaining Fat Cat Zones.
How I automated support & resistance so I never draw levels again.
Raw, no edits, just me and my charts.
chartmuseYT
An extremely simple idea or strategy can still be turned into something that feels premium and complex.
There is a balancing act in having something you love while also being simple to use, gives enough dopamine yet you still know what you are doing.