@matthew_sigel Cleanspark
$17.27 = $4.43bn now
$7 = $1.787bn bear
$18 = $4.609bn base
$25 = $6.469bn bull
Absolute values feel low (for CLSK) but I like the framework fundamentals. Thanks for sharing.
@coinbase You need to get 401k’s, ISAs and SIPP’s on the platform to get real scale here.
Also greater flexibility on digital credit would be great e.g select input (BTC, SOL, USDC etc) show the % return and then select what you want your return in (e.g BTC, USDC, SOL, STRC etc)
Looking forward to the World Cup, my best upside potential investment is $ENT.L
In value territory,
World Cup upside and
Bet MGM buyout potential following the MGM buyout offer.
UK house builders look in value territory. May take a while to play out but a good starting entry point now. $TW.L $BTRW.L $VTY.L $PSN.L
And even $OPEN in the US.
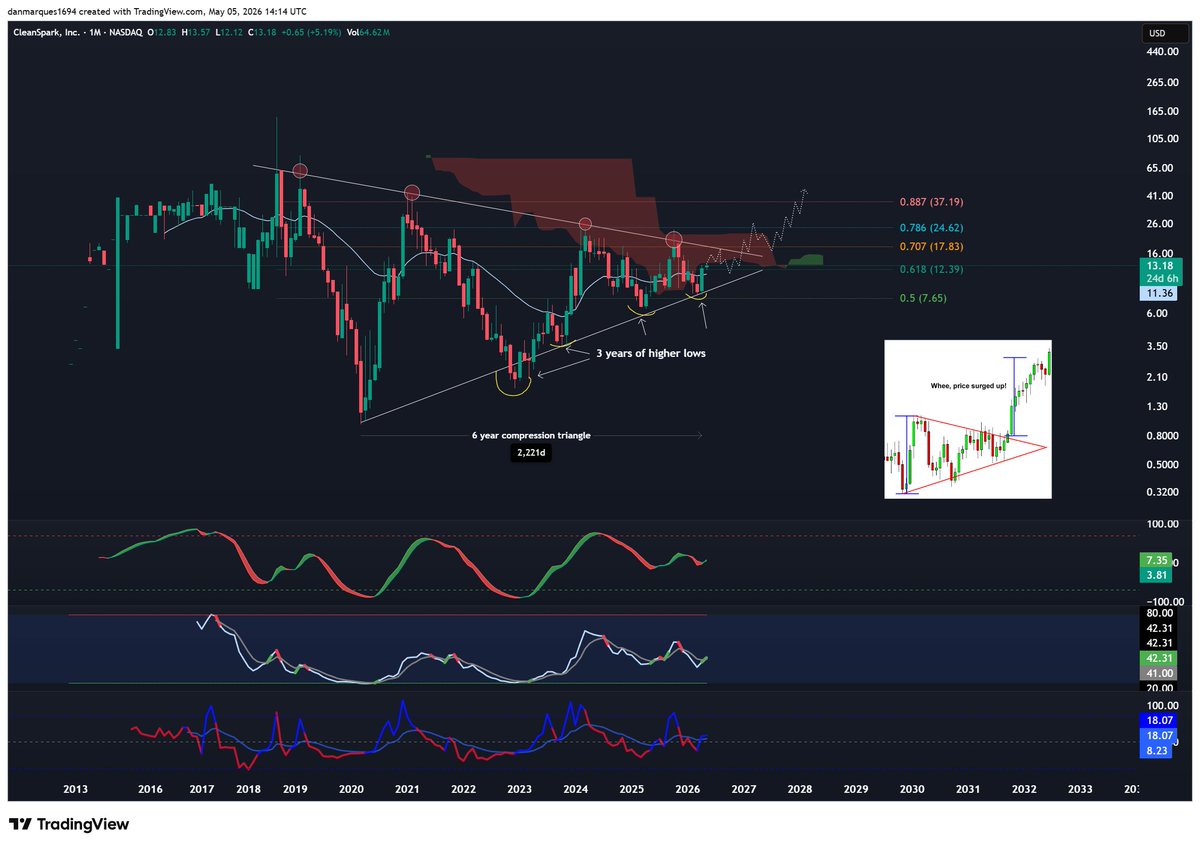
Love how no one is talking about Cleanspark $CLSK...quietly +50% in the last month
It's one of the more interesting long-term compression structures in the Bitcoin mining / power infrastructure group. CleanSpark has spent years trapped in a wide range, and every time it looked like the stock was ready to escape, it failed.
That has been the defining feature of the chart:. Repeated fake-outs, sharp rallies, sharp givebacks, and no sustained trend. But underneath that noise, the structure has actually improved.
The most important change is the series of higher lows over the last 3-4 years. That matters because it shows the market is no longer pricing the company the same way it did during the 2022 bear market. Buyers have continued to step in at progressively higher levels, even though the stock has not yet broken out. That is usually what long-term accumulation looks like before the chart becomes obvious to everyone else.
At the same time, the stock is still being capped by a multi-year descending resistance line. That is why I would be careful calling this a breakout yet. It is not. It is compression. Price is pushing into a major decision zone, but until it can clear and hold above the mid-to-high teens, the stock remains range-bound on the monthly chart.
The $17–$20 area is the first major battleground. That zone lines up with prior supply, the upper part of the current range, and the area where previous rallies have started to fail. So another rejection there would not be surprising at all. In fact, given how many false starts this name has had, you almost have to expect the market to make this messy before it makes it easy.
The 21m EMA is also important here. Price is now back above it, with the moving average around $11.37, but CleanSpark has reclaimed this level before and then lost it shortly after. So the key is not whether it trades above the 21m EMA for a few weeks. The key is whether it can hold above it over multiple monthly closes and turn it into support. That would be a real change in character.
The Ichimoku cloud reinforces the same message. The stock has spent a long time buried in, under, or around the cloud, which is basically the chart’s way of saying: “there is no clean trend yet.” It’s equilibrium. It’s digestion. It’s the market still deciding what this company is worth. A clean move through the cloud and above the descending trendline would be much more meaningful than another quick candle into resistance.
What makes the setup compelling is that the technical compression is happening at the same time the fundamental story is potentially changing. CleanSpark has historically traded as a Bitcoin miner, but the market is increasingly looking at power ownership, site quality, grid access, and AI/HPC optionality across the entire sector. If investors begin to underwrite CleanSpark not just as a miner, but as a power-backed digital infrastructure platform, then the current range may prove to have been a long re-rating base.
That is the actual thesis. The company has spent years coiling while the business backdrop has arguably improved. At some point, compression like this resolves. The timing is unknowable, and there may still be months of chop left, but once a structure like this finally clears multi-year resistance, the move can look absurd in hindsight because everyone forgets how much energy was stored during the base.
I've been invested here since 2023 and still think there's a long-term asymmetric setup where the upside can be significant if the chart resolves higher and the company’s power/AI infrastructure narrative becomes credible to the broader market.
For now, it's still range-bound, but the range is tightening. The higher lows are constructive. The reclaim of the 21m EMA is encouraging, but not confirmed. The $17–$20 area is still the key resistance zone. A rejection there would be normal. A sustained monthly move above it would be the first real sign that the multi-year compression is finally beginning to release.
Stock is getting closer to the point where it has to make a decision. And if that decision lines up with Bitcoin strength, improved liquidity, and a market re-rating of power infrastructure assets, this is the kind of setup that can move much further than people expect.
@AlemzadehC@chad_ventures@cantonmeow@matthughes13@MarketMaestro1
@tradingview sometimes when scrolling on watchlists I accidentally delete a ticker, very frustrating. Can you add a lock toggle to watchlists so this does not happen?