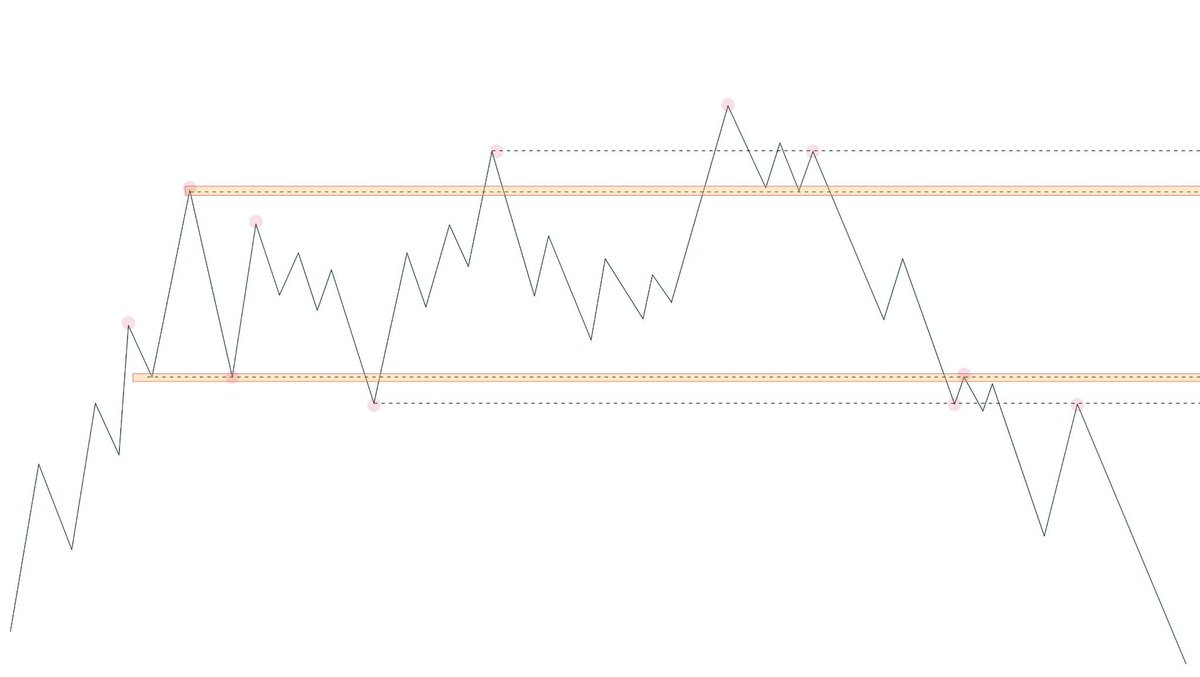
Support and resistance levels are among the simplest yet most misunderstood concepts in technical analysis. The longer a price zone holds over time, the greater its practical significance tends to be. The difference between an inexperienced trader and an experienced one lies in their approach: the former seeks the perfect level, whilst the latter observes how the market reacts within a zone of interest.
Liquidity sweeps, deviations, reclaims and structural confirmations are often the elements that allow us to distinguish a simple reaction from a high-probability opportunity.
Ultimately, support and resistance levels are not used to predict the future, but to identify areas where it is worth paying closer attention and waiting for the market to reveal its intentions.
Study these slides and they will be useful to you
A retweet would be helpful
Retweet this post 👌🏻
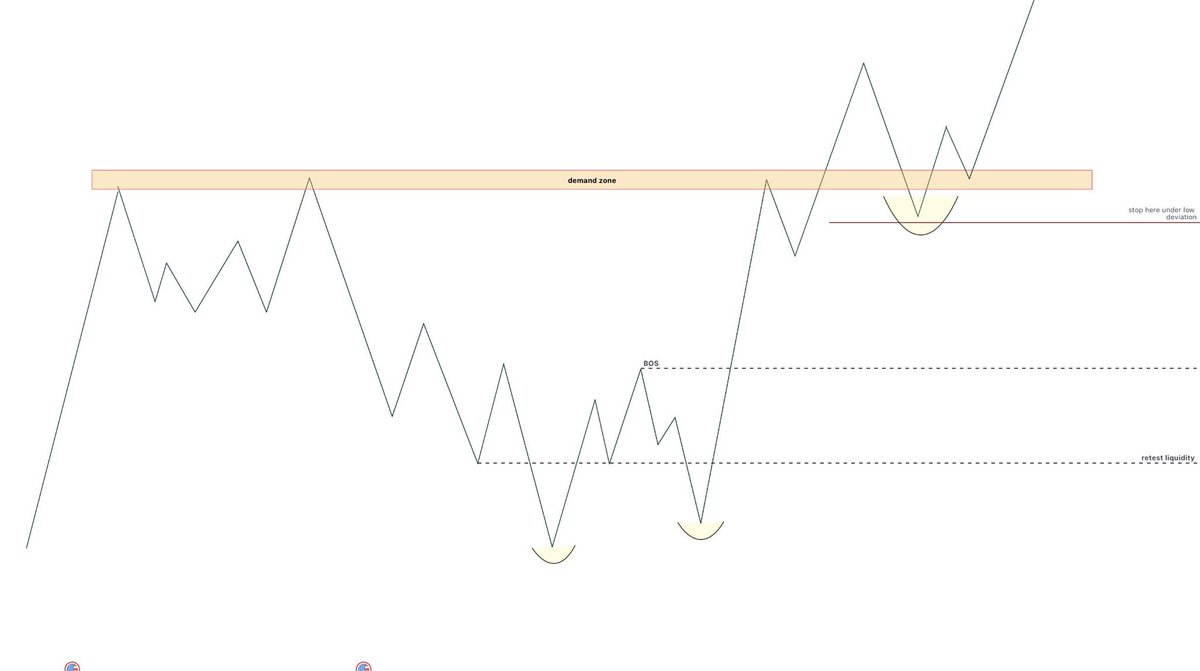
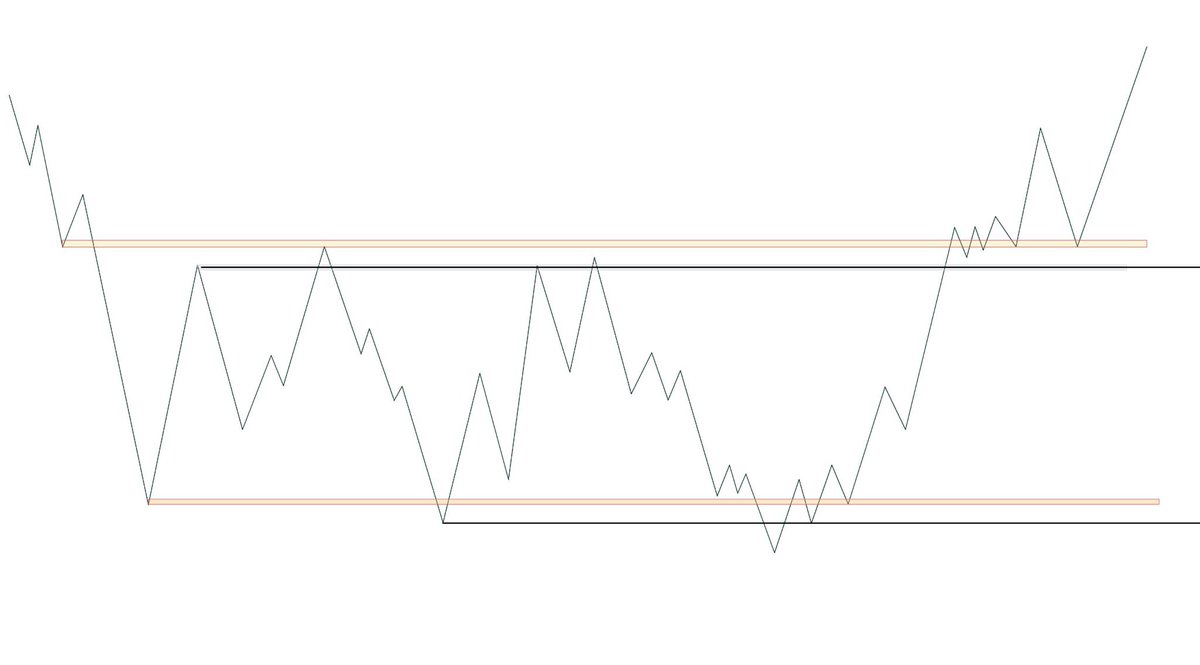
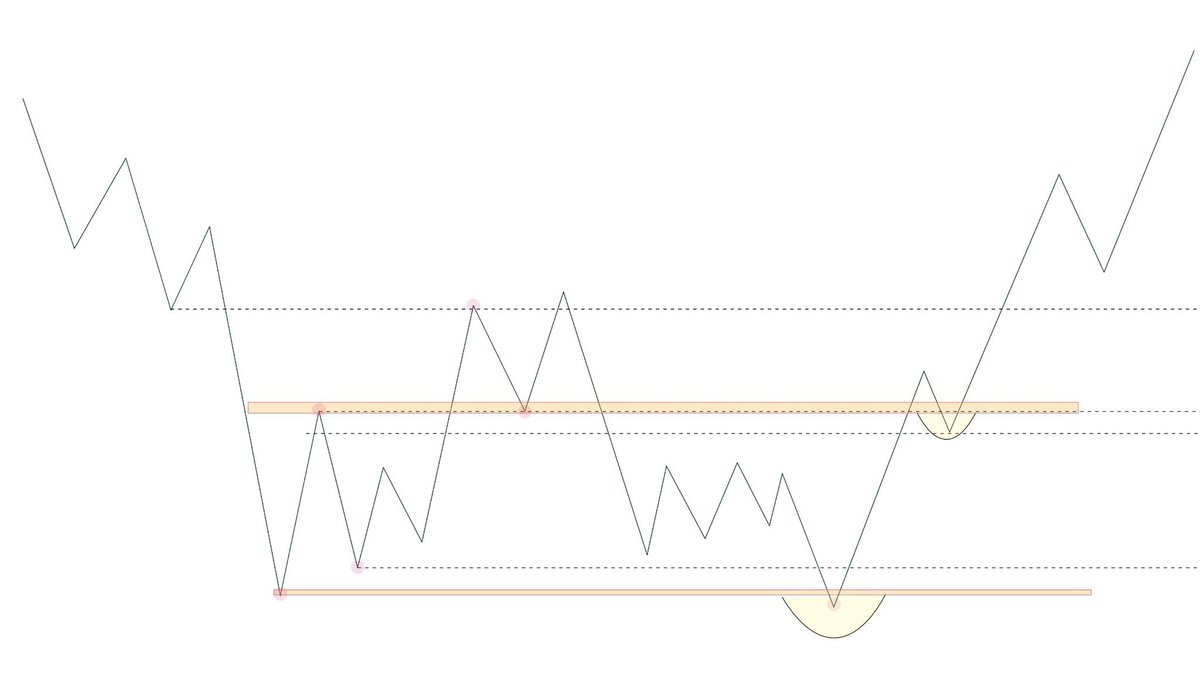
You need to start looking at the market in a more ‘streamlined’ way, without overcomplicating things: the point isn’t to try and catch every single move, but to understand when the price breaks out of the range and how it reacts.
When you see a deviation – that is, the price temporarily breaking above or below the range – it isn’t immediately a signal to chase. It’s a piece of information. It’s telling you that there’s a demand for liquidity out there.
If that deviation is then repeated (double deviation), everything changes: it means that level has been tested several times and the market is clearly showing where it wants to react. That is the real confirmation.
At that point, you shouldn’t enter at random, but wait for the price to return and start forming a clearer structure. That’s when it makes sense to switch to a shorter timeframe and look for a more precise entry, without forcing it. (Rarely test it first if you want to do so with a small position size)
This way of reading the market always applies, whether you’re looking for a long or a short. The concept doesn’t change, only the direction: above, you work from a bearish perspective; below, from a bullish perspective.
In practice, stop chasing the price and start working on these extremes: that’s where the market becomes much clearer and gives you simple invalidations.
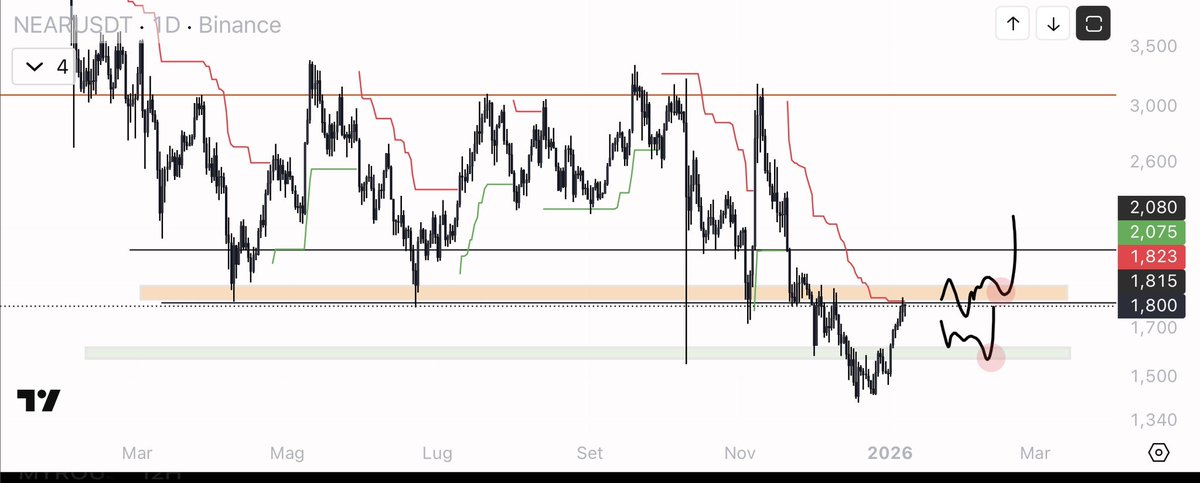
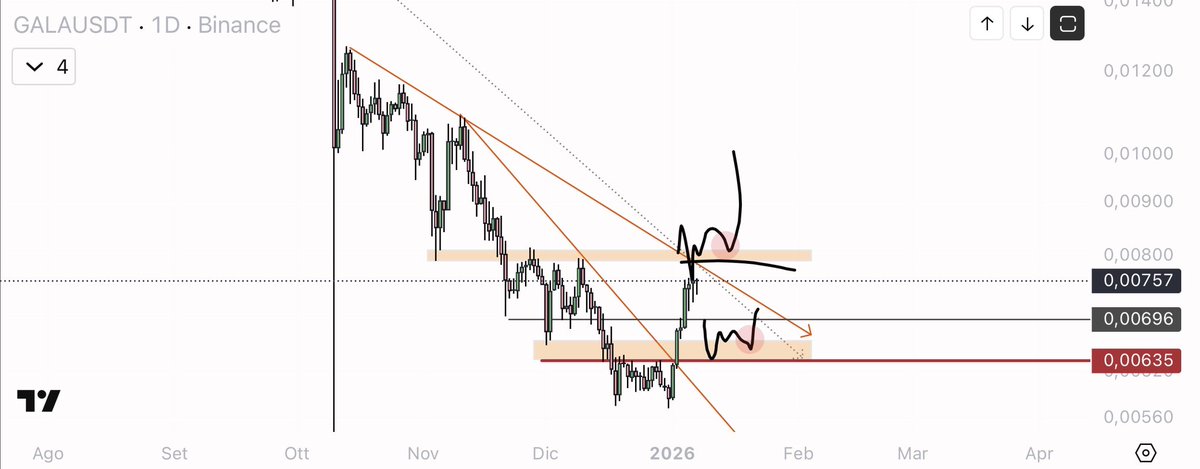
$GALA $NEAR Once you really start to understand where the important levels are, the market stops looking like a casino.
You no longer have to guess the minimum or maximum; you just have to wait for the price to return to a level where it makes sense to do something.
There is nothing complicated about GALA and NEAR... you just have to wait and understand when to press the button... and that's when it makes sense to try either the flip or the restest. When you enter at points like this, you are not gambling, you are just managing probabilities:
if it goes wrong, you lose a little; if it goes right, you let it run.
That's what I mean by low risk.
It's not a safe trade.
It's a trade where the risk is small and controllable, and the market decides the rest.
First, you find the levels.
Then you wait.
Then you execute
What the fuck are everyone celebrating?
The purchase of $40 billion in Treasury Bills is NOT QE.
It's a technical measure for managing short-term liquidity, used to keep the T-Bills market stable and manage bank reserves.
It doesn't have the same expansionary and direct impact that true Quantitative Easing has.
For the shitty altcoins out there, you only need a fucking QE to pump them!
The $40 billion in T-Bills is a signal, a mini-injection.
QE, on the other hand, is a real macro accelerator that pushes the entire crypto ecosystem violently.
What we have now is a "softening", not a total regime change.
@eliz883 “Patient and discipline” that a thing u always talk, not everyone can easily do that but it is the most proficient thing to “survive” in this market. Dont dream too much and make a profit that suits you and if not, it will be forever hallucinations that i’ve learn from u 🙏 tks u
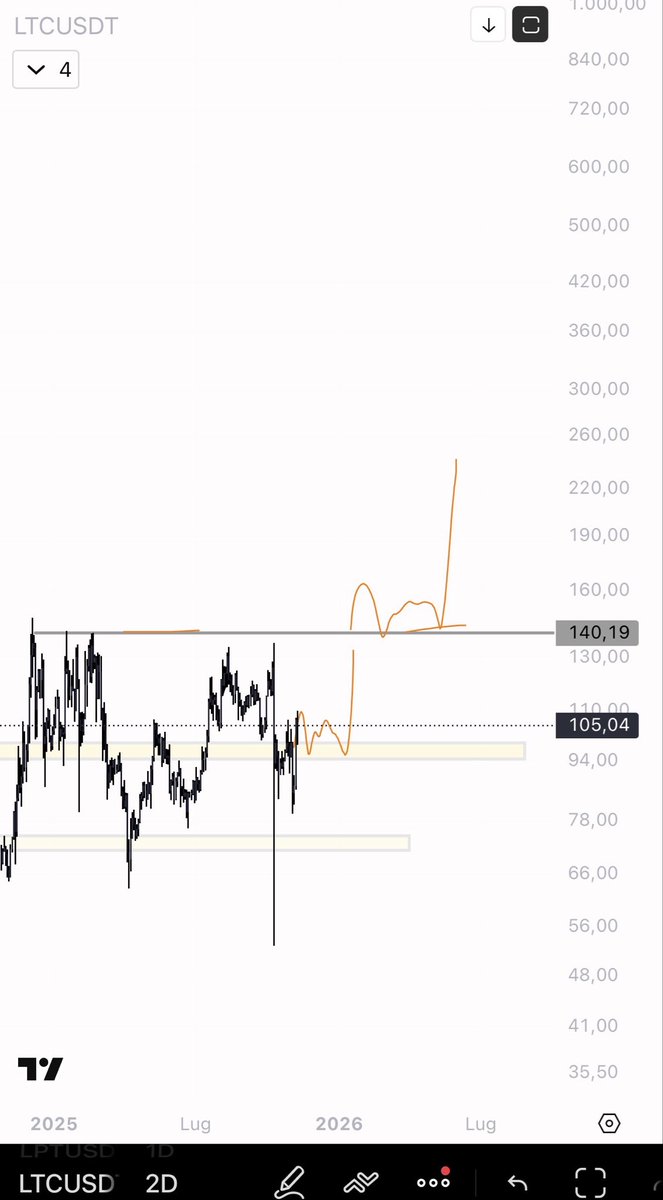
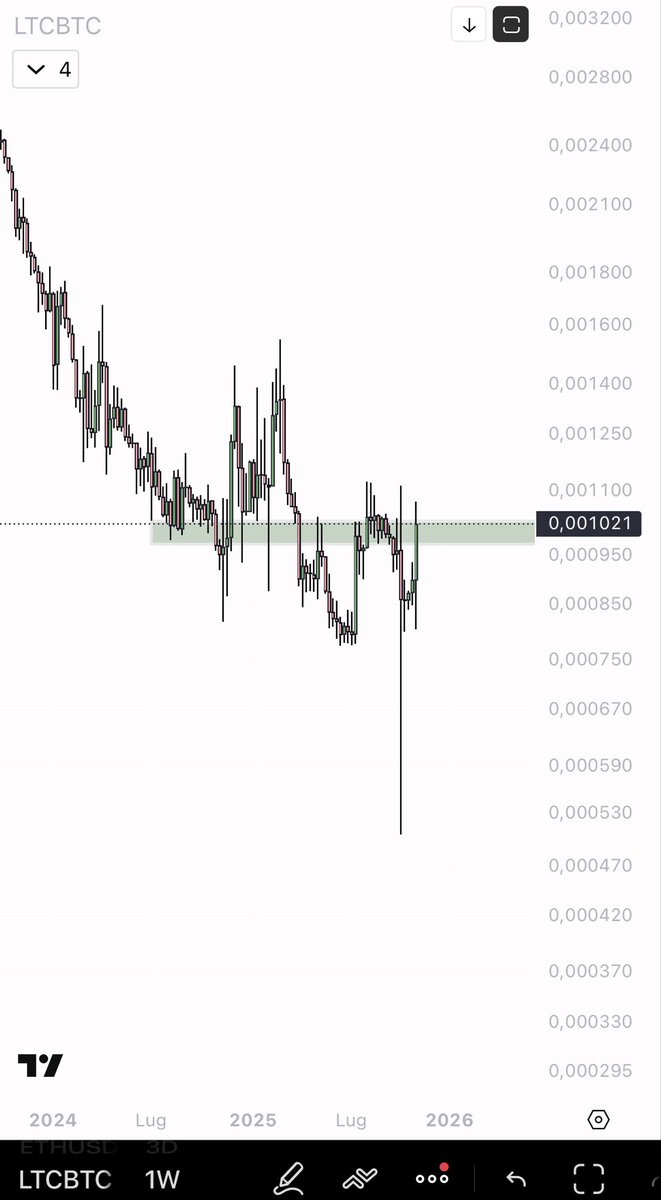
$LTC
This coin, in theory, has the potential to rise much higher, but it has not yet shown the necessary strength. For now, it is only reacting: a correct, clean movement, but not enough to speak of real expansion.
The area I have highlighted is the level it must decisively regain. I want to see the price stabilise above that line, not just touch it and then fall back. When the market exceeds an important level and remains above it, it means that it is not just a spike, but that there is intention behind the movement.
In the coming days, it will all be a matter of confirmation: if volume enters and the price rests on that level without falling back into the range, then a serious expansion can begin.
On the weekly chart, the LTC/BTC pair is entering compression.
The price is tightening more and more within this zone, without losing the key level, and this is exactly the type of behaviour that precedes a significant directional movement.
The dynamics are very similar to those shown by XRP a few months ago: same slow build-up, same absorption candles, same 'silence' before the expansion. When the market stops falling and begins to compress horizontally, it means that liquidity is accumulating.
If it breaks this structure upwards, the move could be big.
In trading, the priority is not to be right, it is not to make the most beautiful analysis, and it is not even to predict what the market will do.
The priority is profits 👈🏻real ones, taken home.
You can have a thousand ideas, a thousand perfect charts, you can catch the bottom and the top almost to the tick...
but if you don't cash in, it's all imaginary.
Trading does not reward those who think well, it rewards those who execute.
Management makes the difference: take profits when they are there, cut when something is not working, protect your capital before your ego. The market does not pay for intentions, it pays for decisions.
In the end, only this remains:
either you bring home profits, or you are just looking at a chart.
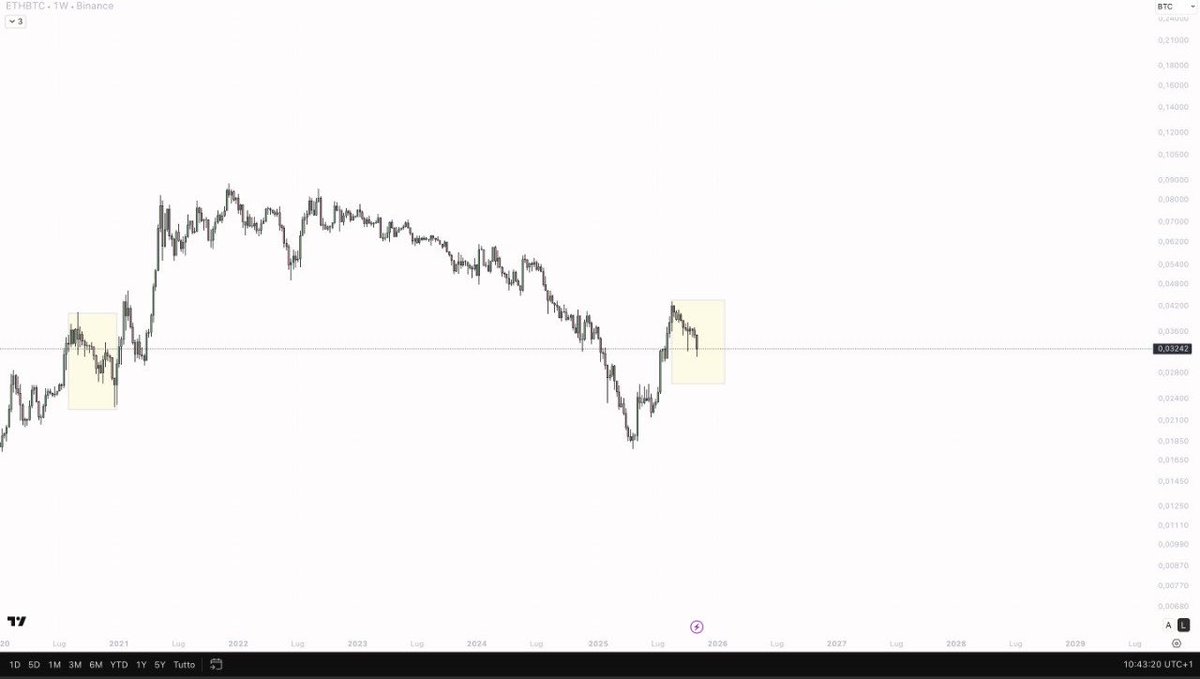
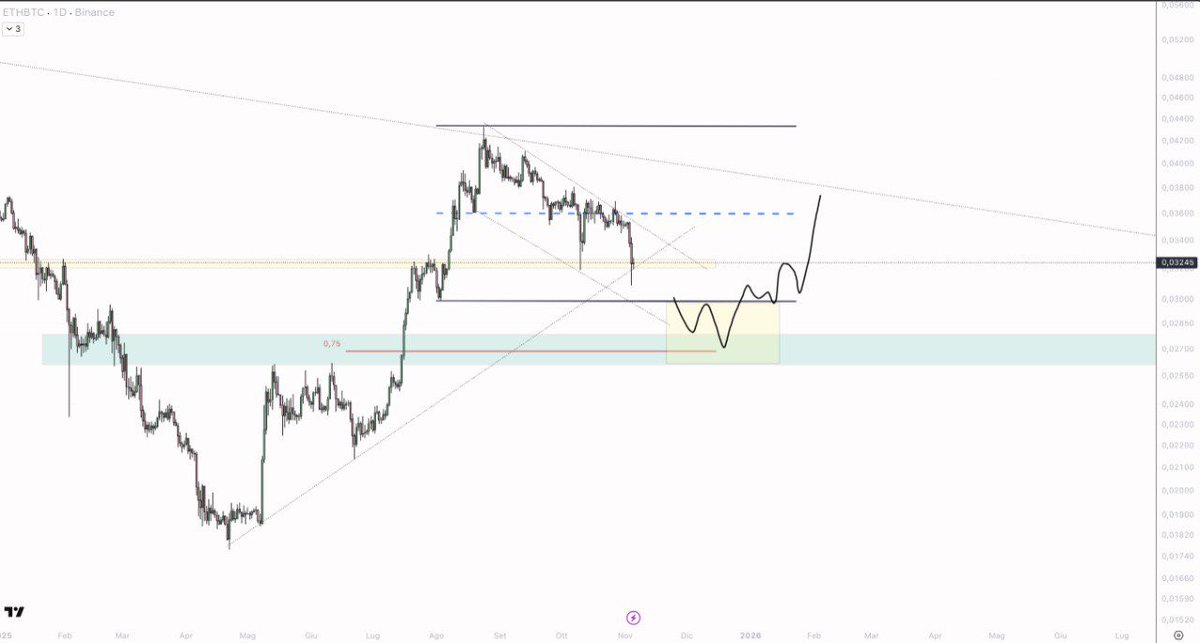
In the coming months, if I had to choose where to focus my purchases during periods of decline, I would focus on $ETH rather than BTC. This is not a random decision: it is based on an analysis of the structure and risk/return ratio. On the ETH/BTC exchange, we are working within a broad demand range after a long period of weakness: here, the market has already shown its ability to absorb sales and build foundations. In this context, any deep dump on ETH tends to offer entries with better measurable risk below the lows of the zone and greater recovery potential if the price regains lost levels. Look for confirmation with a reclaim of key levels on the ETH/BTC pair and on the price action in USD, and let the charts validate the thesis.
In summary: same caution, but more exposure to ETH where I currently see the best relative recovery
Of course 👉🏻even if you’re accumulating spot, risk management always comes first. Position size, invalidation level, and discipline matter more than the entry price.
Weak vs strong structure bullish
Weak vs strong structure bearish
This simple graph is worth more than a thousand lessons
Retweet this simple and best educational contents
@eliz883 “Patient and discipline” that a thing u always talk, not everyone can easily do that but it is the most proficient thing to “survive” in this market. Dont dream too much and make a profit that suits you and if not, it will be forever hallucinations that i’ve learned from u. Tks🙏
Một trong những lí do mà mình tin rằng CHU KỲ NÀY CỦA CRYPTO SẼ DÀI BẤT THƯỜNG đó là:
Chu kỳ kinh tế chưa hồi phục.
Mình biết, crypto đã tăng khá nhiều nhưng mình tin rằng nó hoàn toàn có thể lên cao nữa từ đây.
Chỉ số Kinh tế toàn cầu cho mình biết ta hoàn toàn có thể chứng kiến sự tăng trưởng cho tới Q1/2 2026.
Nó đo lường thị trường trái phiếu, chi phí vận chuyển, các nền kinh tế lớn, và vân vân.
Và nó có độ dẫn tầm khoảng 6 tháng so với chỉ số PMI ISM
Một trong những lí do ta thấy chu kỳ kinh tế đang khá "chết" ở thời điểm hiện tại là do Trung Quốc - cỗ máy sản xuất lớn nhất thế giới - vẫn chưa hồi phục
Nền kinh tế chậm chạp hậu COVID khiến những nhà đầu tư đi vào trái phiếu rất nhiều để tìm tài sản trú ẩn an toàn.
Điều này khiến lợi suất trái phiếu đi xuống (giá trái phiếu tỉ lệ nghịch với lợi suất)
Chỉ khi Trung Quốc sản xuất mạnh trở lại, kinh tế hồi phục và những nhà đầu tư chấp nhận nhiều rủi ro hơn, khi đó ta mới thấy chu kỳ kinh tế thực sự khởi sắc trở lại
Hơn nữa, bản đồ chấm từ buổi họp FOMC vừa rồi cho thấy chúng ta sẽ có m��t chu kỳ cắt lãi suất k��o dài cho tới cuối 2026.
Bullish.
Đó là suy nghĩ của mình
If you're serious about learning TA and building your own trading skillset, make it a habit to monitor the following charts — primarily on the 1W (weekly) and 1M (monthly) timeframes.
• Use 1M to confirm your overall bias.
• Use 1W to plan your entries and exits more precisely.
Here are the key charts you should focus on:
• $USDT.D – This chart gives you clarity on market sentiment and often indicates $BTC direction.
• #TOTAL – Represents the entire crypto market cap. Helps gauge broader market strength.
• #TOTAL2 – Excludes BTC. Focuses on $ETH and the general altcoin market.
• #TOTAL3 – Excludes BTC and ETH. Useful to analyze low-cap altcoin trends.
• #DeFi – Tracks the DeFi sector. Crucial for on-chain strength analysis.
• #OTHERS.D – Reflects dominance of non-top coins. Useful for altcoin cycles and rotation insight.
The most important charts are:
🔹 $USDT.D
🔹 #TOTAL
🔹 #TOTAL2
Once you have a strong read on TOTAL2, charts like TOTAL3, DeFi, and OTHERS.D become optional — mainly for extra confluence when building your trading plan.
EDUCATIONAL CONTENT
Retweet very appreciate
$AAVE example
how to understand if there is a consolidation under resistance for a possible breakout ... observe the liquidity together with the chart .... you can observe how orders are placed on orders close to each other to prepare the up candle
here you have had two possibilities as you can see in the yellow squares....it is one of the easiest trades because your stoploss is really close
I hope it's useful to you! It has a really high win rate! you can use it for both long and short positions
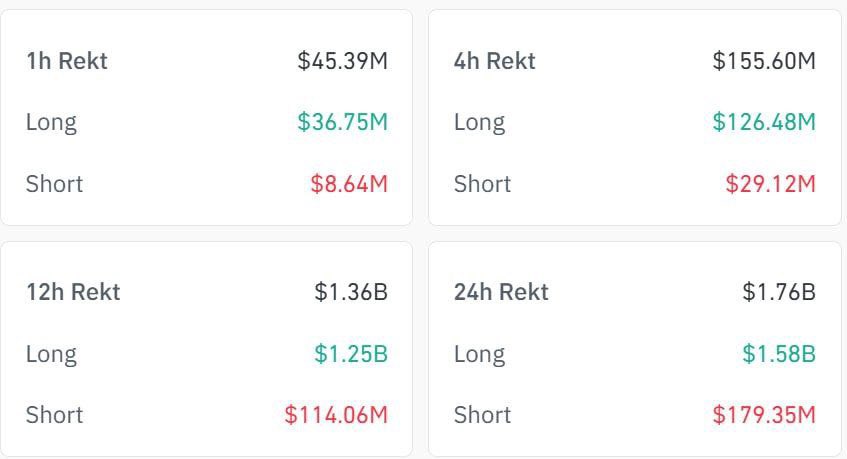
THE BIGGEST LIQUIDATION SINCE 2021!
WHY DOES THE MARKET DUMP AND WIPE ALMOST $2 BILLION TRADES IN JUST 24 HOURS?
HERE'S WHAT HAPPENED:
1. COINBASE TRADERS STARTED THE SELL-OFF.
COINBASE TRADERS BEGAN SELLING 1 HOUR BEFORE THE MAJOR DUMP. THE SELL PRESSURE PUSHED THE LIQUIDATION LIKE A DOMINO.
2. LIQUIDATION CASCADE TRIGGERED THE BIGGEST DROP.
ONCE THE MARKET HIT A KEY LIQUIDATION ZONE, IT WAS GAME OVER.
- OVERLEVERAGED POSITIONS STARTED TO CLOSE.
- STOP-LOSSES WERE TRIGGERED, CREATING A CHAIN REACTION.
3. THE MARKET WAS OVERHEATED
- FUNDING FEES WERE SPIKING (A SIGN OF EXCESSIVE LONGS).
- OPEN INTEREST WAS RISING RAPIDLY (TOO MANY TRADERS PILING IN).
THEN SOMETHING INTERESTING HAPPENED...
1. STRONG BUYING PRESSURE EMERGED ON ETH
ETH DOESN'T EXPERIENCE MUCH DRAWDOWN COMPARED TO BTC.
THE VOLUME IS THERE TOO.
2. UNUSUAL SELL-OFF IN XRP
THE XRP’S LOW LIQUIDITY MADE THE MOVE WORSE. XRP MAY HAVE A LARGE MARKET CAP, BUT ITS LIQUIDITY IS STILL THIN. THIS IS WHY XRP CAN SURGE HUNDREDS OF % OR CRASH OUT OF NOWHERE.
3. MASSIVE VOLUME IN ADA, USDC & FDUSD
WHEN THE DUMP STARTED, THESE THREE SAW INSANE VOLUME.
----
AFTER A LIQUIDATION LIKE THIS, HERE’S WHAT USUALLY HAPPENS:
- LIQUIDATIONS WIPE OUT WEAK HANDS.
- SMART MONEY BUYS THE DIP AT A DISCOUNT.
- THE PRICE SNAPS BACK QUICKLY.
THE DUMP CLEARS OUT WEAK POSITIONS, AND THE STRONG HANDS STEP IN.