@KTutzschke In the last note published, we have defined our regime classifications, in future ones we will dive deeper in regime bought supply behaviour
This chart stamps each coin with the regime that was live on the day it last moved, so every band is real supply, not an estimate. When a band shrinks, that cohort spent.
Full method behind the six regimes is in the bitcoin note. Link below:
https://t.co/MogYtlm8NT
This chart shows only the months when selling at a loss was heavy enough to shrink the market's cost basis.
Every past bottom came with a spike deeper than 4%. January 2015 hit 4.1%. December 2018 hit 5.7%. July 2022 hit 5.6%.
The worst month this cycle was 2.5%. Nothing close has printed.
And it is always recent buyers. Coins older than two years have never made up more than 0.9% of it.
Every coin carries the market condition it was last bought in. Our regime model has six cohorts, and together they account for the whole supply. We are testing what each one looked like at prior cycle lows.
Below is the largest. Coins last bought during an Advance peaked at 11.2M BTC in November. 6.8M remain.
Stay tuned for the bitcoin note:
https://t.co/L87fiTgWXW
The buyers who paid the most have done most of the selling.
Coins bought between $108k and $125k (top 15%) made up 60.5% of every loss long-term holders booked in March. Today, 19.6%.
The weight is lifting, not lifted. Both prior bears ended with this reading in single digits, 7.9% and 2.6%.
https://t.co/T03jZOkNPW
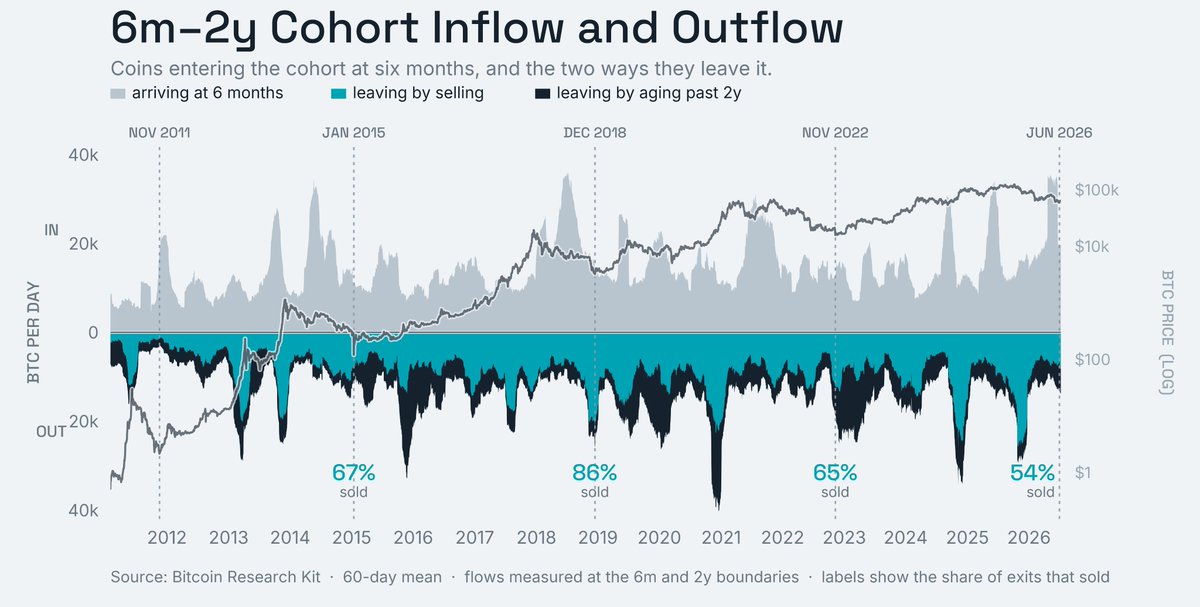
Same decision window I discussed, now watching the door.
Grey is coins arriving. They turn six months old and step inside.
Below the line is how they leave. Teal sells. Navy waits it out and walks past two years. The room is still filling.
At every cycle low the exit gets crowded. 86% sold in 2018, 65% in 2022. At June's low, only 54%. The smallest rush for the door yet, if June was the bottom.
Every rally pulls in fresh money. Six months to two years after the top is where that money makes up its mind.
Younger than six months and the fall hasn't landed yet. Older than two years and the holder has made peace with it.
In between, they waver. That's the dark band running across the chart.
Then it clears out. The coins are sold, or they turn two.
Watch this group, not the price. They carry nearly all the loss, so they're the only ones with anything left to sell.
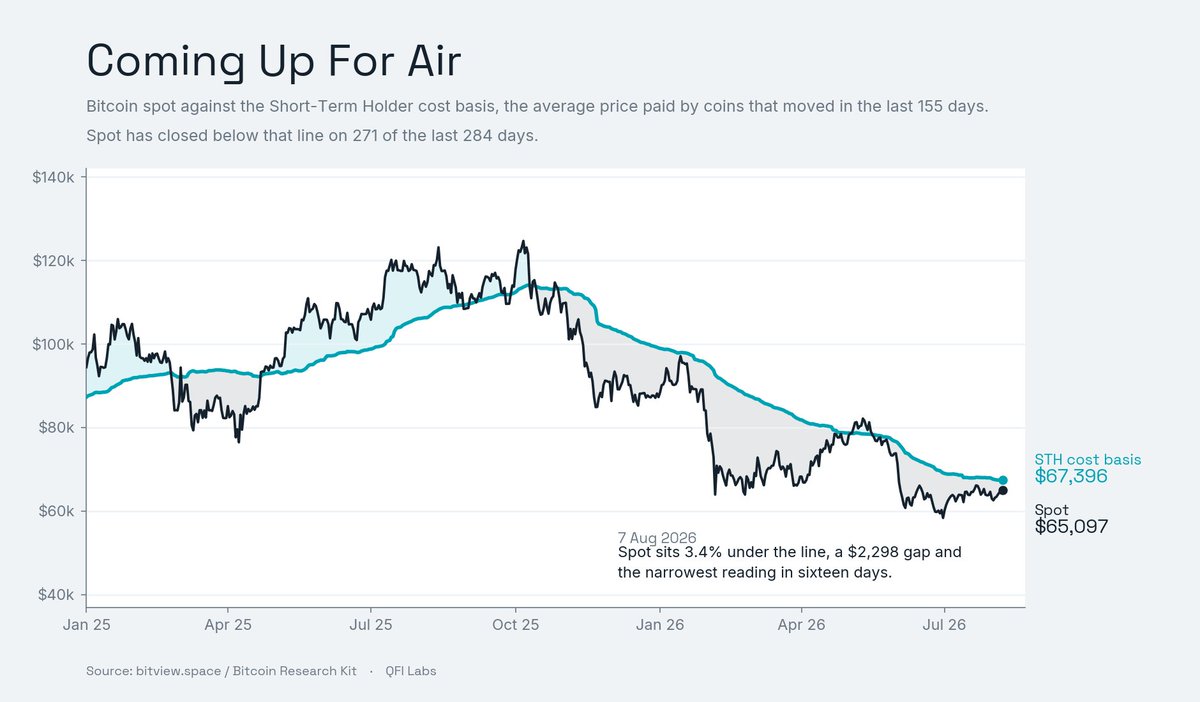
Payrolls printed -23,000 in July against a forecast of +80,000. June got revised down too.
Market cuts September hike odds from 57% to 44%.
Cheaper cash is what brings the carry bid back, so that helps.
But the level that matters is $67,396, what the average recent buyer paid.
Read our latest report:
https://t.co/T03jZOkNPW
When does this Capitulation end?
The market has been in Capitulation for 70 days. This edition sets the current episode against past capitulations and examines the dynamics on the sell side.
https://t.co/dWxHaKTgzh
Last chart sorted coins by how long they'd sat untouched. In this one, each row is a year. The colour shows how far that year's buyers fell below what they paid. The width shows how long they stayed there.
Each row is a group of bitcoin sorted by how long it has sat untouched. Bottom rows were bought this week. Top rows haven't moved in a decade.
Teal color means that group is at a loss.
At all four bottoms, the teal stops in the same place: coins held one to two years. Older holders have never been underwater at a low.
June was the same, only gentler. Those one-year holders were down 42%, against 59% in 2022 and 68% in 2018.
They bought near $95,000
A market is never priced for nothing. Someone is always taking a side. Right now every corner of it is taking the same one.
Options traders are paying less to insure the next week than the next quarter. Whatever they are worried about, they do not think it happens soon.
Futures traders earn 4.27% a year to be long, against 3.625% just holding cash. Six-tenths of a point for the risk. Nobody is stretching.
The price itself has moved more than 5% in a day just once in the last ninety. Historically it does that one day in seven.
And on chain, only 18.8% of all bitcoin has changed hands in the last six months, the lowest share ever recorded. The coins are sitting still too.
Four different groups, four different ways of measuring, one answer. This market is priced for quiet. News keeps arriving. The market reacts to nothing
Bitcoin supply younger than six months is at 18.8%, the lowest share on record.
The coins bought near the October peak have not been sold, and have not yet aged past a year. 3.83M BTC sits in the six-month-to-one-year band, waiting on the clock.
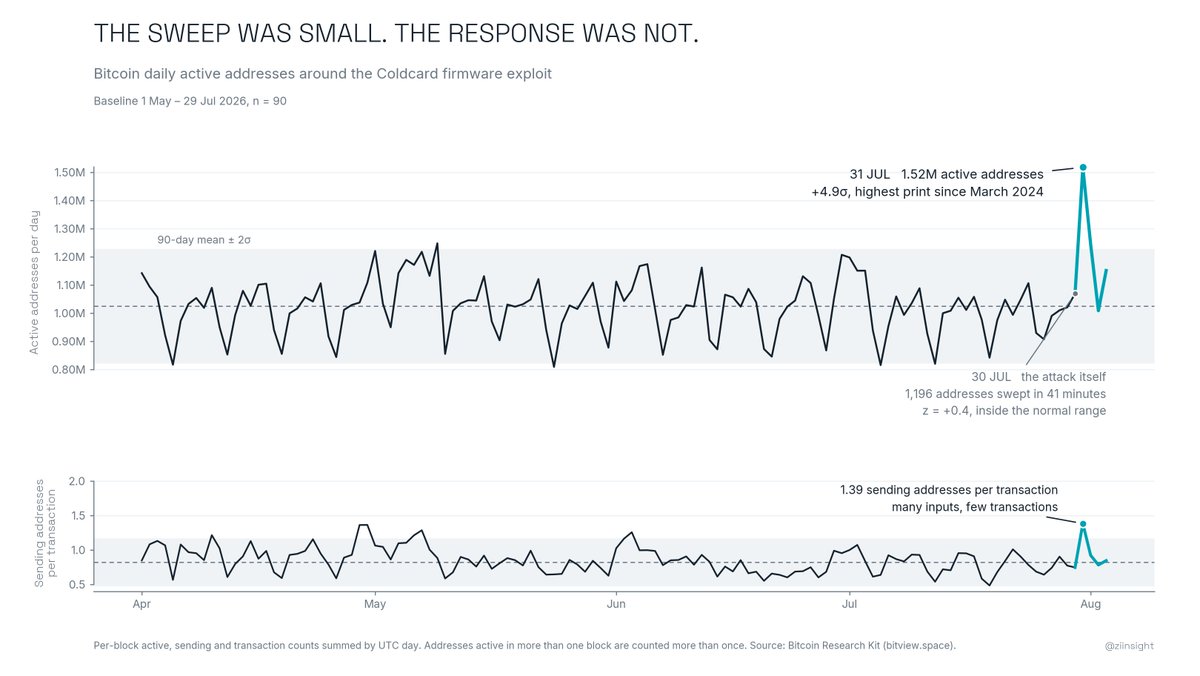
Bitcoin active addresses hit 1,517,902 on 31 July, the highest since March 2024.
The Coldcard hack itself drained 1,196 addresses and left no mark on the chart.
What moved the number was everyone else migrating their coins the day after the advisory.
Bitcoin's 1-year Sharpe ratio printed -1.31 in July. The three prior cycle lows were -1.89, -1.55 and -1.55.
Also, realised volatility into this low ran at 42% against 65% four years ago.
Sharpe divides a year of return by the volatility that came with it, so it reads what a holder was paid per unit of turbulence.
Less pain this cycle, and less payout.