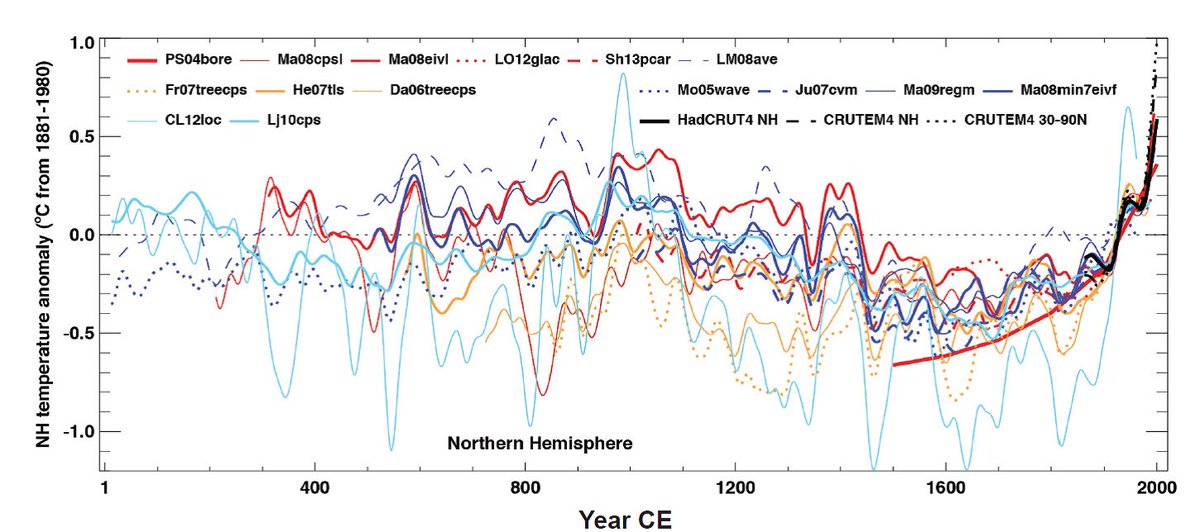
This graph of global annual temperature averages over the past 2000 years was constructed using climate proxies. Direct data on climate only goes back to ~1890, while proxies allow us to study the climate of the past through indirect methods such as ice cores & tree rings
As seen in the graph, from roughly 1450 to the late 1800’s, which marks the beginning of the human industrial revolution, the Earth was actually in a slight cooling period known as ’Little Ice Age’. From then on, temperatures have sky rocketed. The data is clear
The primary greenhouse gases in Earth’s atmosphere are CO2, water vapor, methane, ozone, and nitrous oxide. Greenhouse gases contain 3 or more atoms linked together, creating a flexible molecule capable of holding high energy infrared particles, trapping them in our atmosphere