On-demand insights from #Climate and #EarthObservations for non-commercial | App & API built on #EarthEngine | Initiative between @DRIScience and @UCMerced
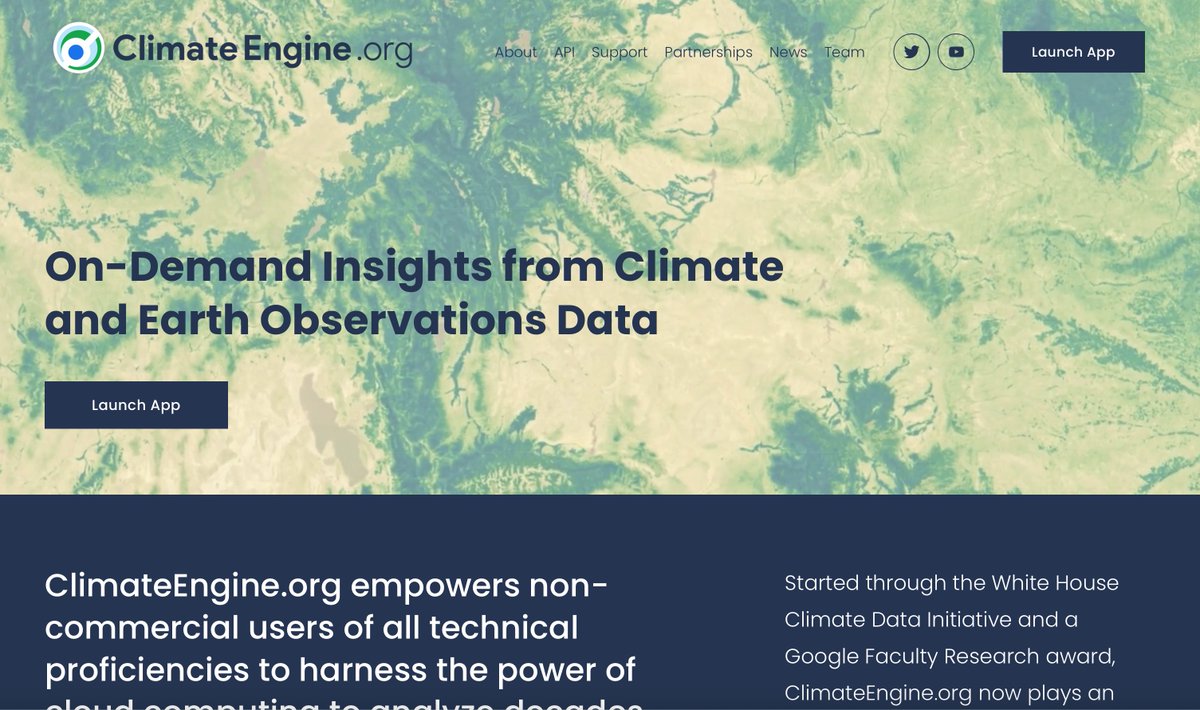
Hello World! We're https://t.co/rfjmO16sGH! Since 2016, the https://t.co/rfjmO16sGH App and API have supported government, non-profit, and tribal partners in leveraging #Climate and #RemoteSensing datasets and today we are doubling down on our mission.
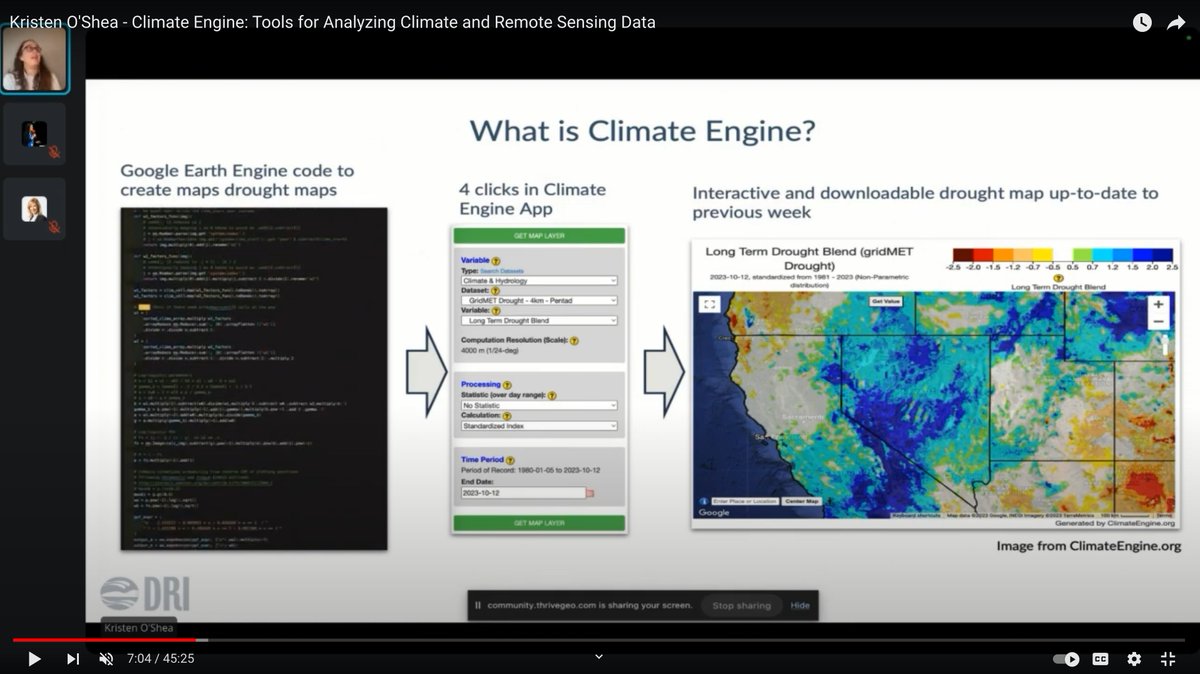
Climate Engine uses @googleearth#EarthEngine to calculate numerical #drought indices, allowing users to determine which time period, statistical distribution, and input variables are used — this video walks you through those choices so you can get started!
#Climate#DataScience
Climate Engine uses @googleearth#EarthEngine to calculate numerical #drought indices, allowing users to determine which time period, statistical distribution, and input variables are used — this video walks you through those choices so you can get started!
#Climate#DataScience
The second video in "The Climate Engine Backpack" video series is now live! 🥳
Learn about "Producing near real-time #drought maps using the Climate Engine app" using #ERA5 to calculate SPI and SPEI for any location on the planet ☀️🌧️
📽️ https://t.co/7RiIGfzv92
@ClimateEngOrg
The second video in "The Climate Engine Backpack" video series is now live! 🥳
Learn about "Producing near real-time #drought maps using the Climate Engine app" using #ERA5 to calculate SPI and SPEI for any location on the planet ☀️🌧️
📽️ https://t.co/7RiIGfzv92
@ClimateEngOrg
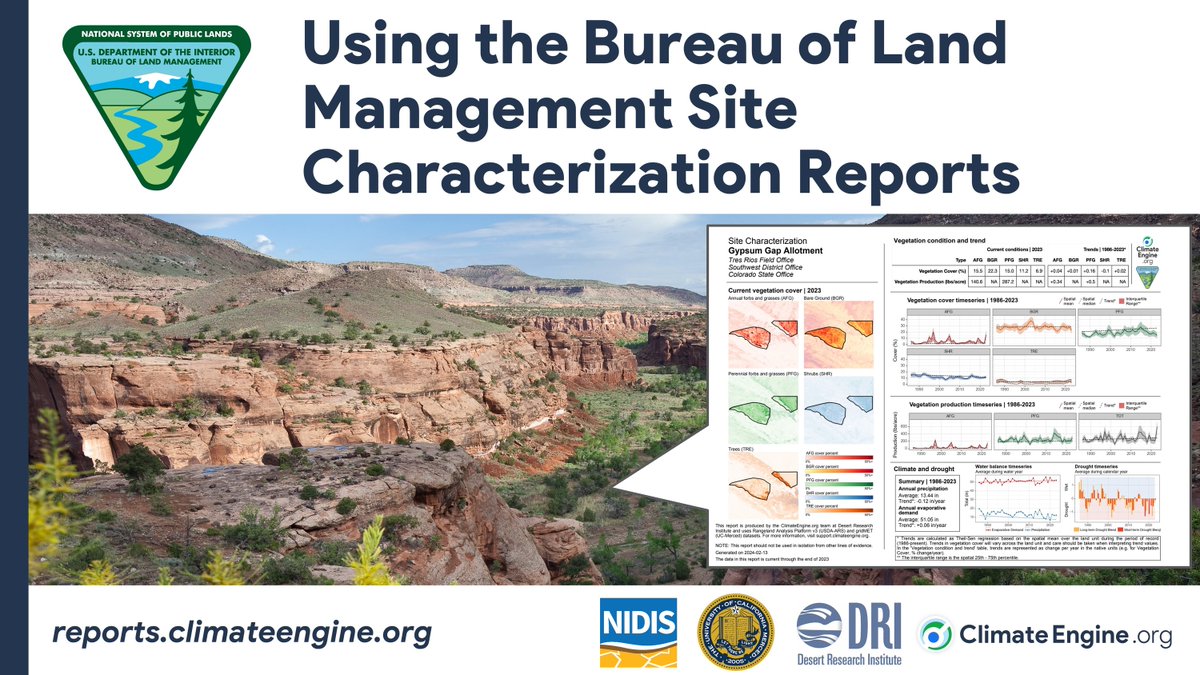
As part of our work with @BLMNational, our team developed an #EarthObservations monitoring system for all BLM land units in CONUS. 🛰️
To aid users, we just published a tutorial video on using the Site Characterization reports. 📄
https://t.co/NW8kfNN1t6
#RemoteSensing#Climate
These reports and the documentation have become a labor of love! 📄
We're hopeful that they will streamline advanced and insightful #remotesensing and #climate data to support a range of decision cases — especially by representing spatial variability🗺️ and trends📈
#geospatial
As part of our work with @BLMNational, our team developed an #EarthObservations monitoring system for all BLM land units in CONUS. 🛰️
To aid users, we just published a tutorial video on using the Site Characterization reports. 📄
https://t.co/NW8kfNN1t6
#RemoteSensing#Climate
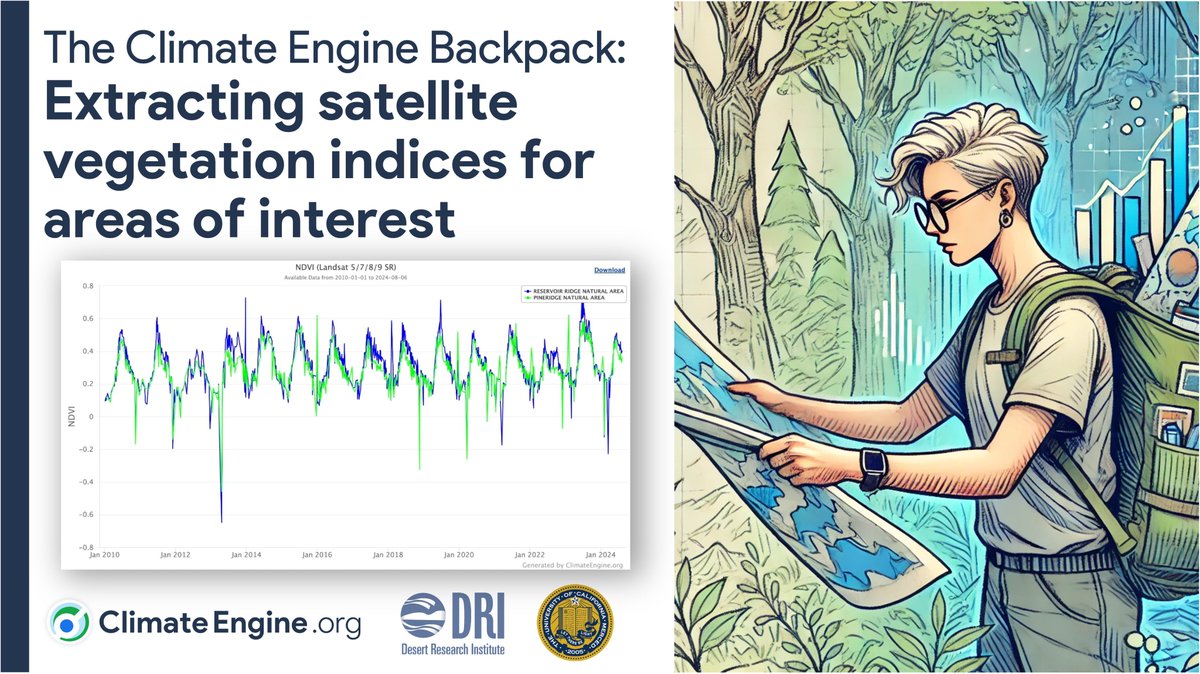
Today, we're introducing a new series called the "Climate Engine Backpack" where we "unpack" all the "equipment" you have available for your next data "adventure!"
Check out "Extracting satellite data for areas of interest using the Climate Engine app!"
https://t.co/xHV6M8KNek
Today, we're introducing a new series called the "Climate Engine Backpack" where we "unpack" all the "equipment" you have available for your next data "adventure!"
Check out "Extracting satellite data for areas of interest using the Climate Engine app!"
https://t.co/xHV6M8KNek
See our very own @myscientistlife present on "Climate Engine: Tools for Analyzing Climate and Remote Sensing Data" for the #EarthEngine User Meetup 🛰️📈
https://t.co/7BMZRaWbsV
Great job, Kristen! 🙌
Thanks for organizing, @SabrinaSzeto! 👏
#Climate#RemoteSensing
🚨New dataset in Climate Engine🚨
The Vegetation Drought Response Index (VegDRI) is produced by @USGS & @DroughtCenter and depicts drought stress on vegetation within the conterminous US using #remotesensing and #climate data 🛰️
Learn about VegDRI here: https://t.co/6BYjaSijvY
Sequías, eventos que exigen más y más indicadores, ojalá tengamos uno trabajado como este. La elaboración de indicadores no es solo asunto de máquinas, sino también de expertos/experiencia, consensos y coyunturas.
Acá hay equipos
Use VegDRI in Climate Engine to:
✅Map current conditions of vegetative drought
✅Assess multi-year trends
✅Pull timeseries data for areas of interest
✅Analyze VegDRI alongside dozens of climate and satellite datasets
🚨New dataset in Climate Engine🚨
The Vegetation Drought Response Index (VegDRI) is produced by @USGS & @DroughtCenter and depicts drought stress on vegetation within the conterminous US using #remotesensing and #climate data 🛰️
Learn about VegDRI here: https://t.co/6BYjaSijvY
Check out this quick demo of the new reporting system we've developed in partnership with @BLMNational!
✅Generate land unit scale maps of climate and remote sensing indicators
✅Dive deeper by viewing real-time reports
✅Export data and reports for use in decision cases
The examples show:
1) Real-time maps of the long-term multi-indicator drought blend, produced in conjunction with @NOAADrought
2) Trends in tree cover in the Bruneau-Owyhee Sagegrouse Habitat project, where ongoing restoration is removing junipers in sage grouse habitat.
Check out this quick demo of the new reporting system we've developed in partnership with @BLMNational!
✅Generate land unit scale maps of climate and remote sensing indicators
✅Dive deeper by viewing real-time reports
✅Export data and reports for use in decision cases