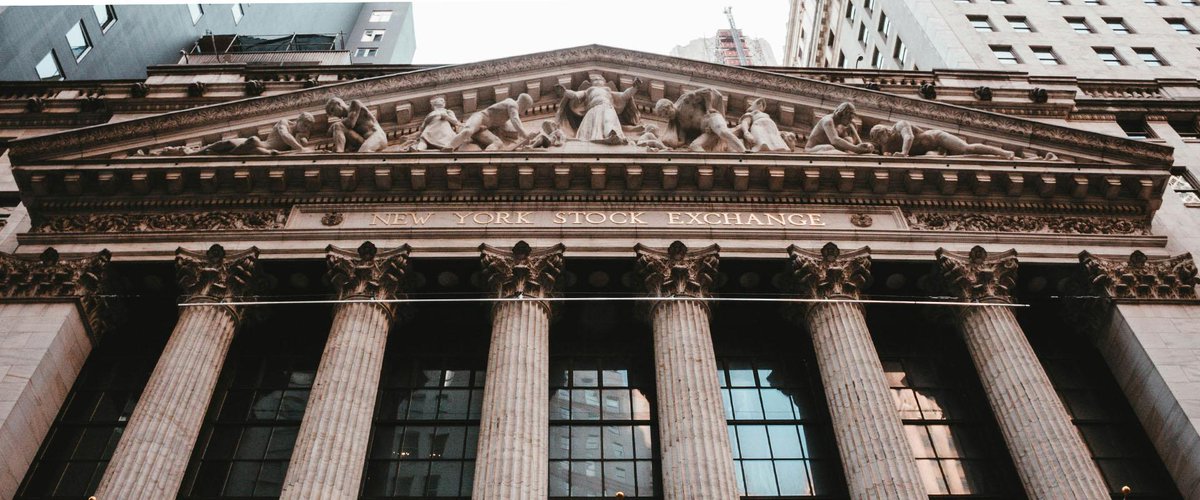
Japan's yen woes turn banks to Bitcoin hedges, reshaping Asia's crypto flows with policy pivots and macro ballast. From 820K BTC holdings to potential $50B influx, resilience emerges.
Stay prepared and trade smarter with Clometrix's quantitative data, pulled from over 45,000 volatility analysis data collected since 2008. With Clometrix's Forecasts, find where are the best buy/sell limits upon data release.
Full story at: https://t.co/Fvd0TmnbMh
October 20, 2025: Japan's FSA proposes letting banks hold and trade Bitcoin amid yen's slide to 155/USD, weakest since 1990. MUFG, SMBC, Mizuho eye crypto as hedges against devaluation. Traders, this could spark $50B inflows, watch BTC, ETH, SOL volatility.
A thread🧵
History sets the stage: Mt. Gox's 2014 $450M collapse led to tight FSA rules, but Japan recognized BTC as legal tender in 2017. Abenomics' stimulus and negative rates pushed firms like Metaplanet to BTC treasuries, as over 100 companies hold 820K BTC worth $85B by mid-2025.
Yen pressures drive the shift: 20% YTD depreciation from trade deficits and BOJ's 0.25% hike lag Fed easing. BTC's -0.7 inverse correlation to yen shines; yen inflows to BTC jumped 40% YTD, with 5K BTC bought in September hedging ¥200B exposures.
Banks gear up: FSA caps at 5% Tier 1 capital, but MUFG's ¥100B BTC pilot yielded 18% H1 returns vs. 2% fiat. SMBC/Mizuho stablecoin handles ¥1T monthly. ETH staking at 4.2% beats JGBs; SOL volumes up 15% in Japan for DeFi hedges.
Volatility links tighten: October's 2% yen drop tied to 5% BTC dip then 8% rebound. Banks' custody could cut intraday swings 10%; BTC-yen beta at -0.65, ETH -0.55, SOL -0.75. ¥10T carry trade unwinds feed cascades, but signal buys.
Counterpoints: BTC's 55% vol dwarfs yen's 12%, risking capital hits; gold outperformed by 5% in spikes. Not all banks dive in as regional lenders cite 20% costs. SOL's 2x beta amplified Q2 losses, but stablecoins held pegs with 4% yields.
Trader tactics: Short JPY futures, long BTC for 10-15% offsets; allocate 15% to JPYC stables, rotate to BTC on FSA nods—18% annualized backtests. Enter ETH at ¥500K support pre-BOJ; trail SOL stops at 2%. Fear & Greed <40 flags dips.
Ripple’s GTreasury bet merges TradFi’s rigor with crypto’s agility, a hedge against macro storms. From $120T treasury markets to XRP’s rise, stability takes root.
Stay prepared and trade smarter with Clometrix's quantitative data, pulled from over 45,000 volatility analysis data collected since 2008. With Clometrix's Forecasts, find where are the best buy/sell limits upon data release.
Full story at: https://t.co/9prfWG46cG
Ripple's $1B GTreasury buy on October 16 reshapes crypto's macro role. As tariff shocks bled $19B from markets, this deal blends TradFi's cash flow precision with XRP Ledger's speed. Corporate treasuries now eye digital assets as balance sheet stabilizers.
A thread🧵
GTreasury’s roots trace to the 1980s, taming FX chaos for Fortune 500s like Coca-Cola. Its platform tracks $12.5T yearly across 13,000 banks. Ripple’s move, post-Hidden Road and Rail buys, fuses this with blockchain, cutting settlement times from days to seconds.
Why now? Tariff hikes and 3.2% inflation strain liquidity. GTreasury’s 95% accurate cash forecasts, paired with RLUSD stablecoin, unlock 25% more working capital. Early pilots show 40-60% lower FX costs, with $2.5T in XRP Ledger volume signaling scale.
Risk management sharpens. October’s 12% BTC plunge synced 0.95 with S&P 500; GTreasury’s hedging tools, tied to Ripple’s oracles, offset 20% via RLUSD swaps. XRP’s volatility dropped to 35% in Q3 vs. ETH’s 55%, showing treasury-grade stability.
Adoption data: 209 firms hold $145B in crypto, up from $80B in 2024. GTreasury’s 1,000+ clients give Ripple 40% Fortune 500 reach. Ondo’s tokenized Treasuries on XRP hit $500M in Q3, yielding 5.2%, a 150bps edge over fiat. Scale is coming.
Counterpoints: Regulatory hurdles loom as GENIUS Act demands audits, and API mismatches could spike costs 10%. Yet, hybrid treasuries outperformed fiat by 8% in Q2, and GTreasury’s 90-day onboarding buffers risks. XRP’s low 0.45 gold beta hints at decoupling.
Trader plays: Cap crypto at 10-15%, blend XRP/RLUSD for liquidity. Hedge pre-FOMC with RLUSD swaps for 5-7% offsets. Enter post-dip when Fear & Greed falls below 40; backtests show 18% gains. Trail stops 3-5% below $2.20 (XRP), $150 (SOL).
Crypto now tracks macro pulses — tariffs prove it. From $19B liquidations to swift BTC snapbacks, the lesson is clear: markets punish leverage but reward patience.
Stay prepared and trade smarter with Clometrix's quantitative data, pulled from over 45,000 volatility analysis data collected since 2008. With Clometrix's Forecasts, find where are the best buy/sell limits upon data release.
Full story at: https://t.co/51A5D2iyuD
October 10, 2025: Trump's 100% China tariff post on Truth Social sparked the biggest crypto liquidation in history. $19B wiped out in 24 hours as BTC crashed 12% to $102K, ETH shed 18%, altcoins like SOL tanked 30%. What drove this chaos, and how can traders prepare? A thread 🧵
The trigger: Trump's tariff escalation, targeting $500B in Chinese imports, hit markets at 9:18 PM UTC. VIX surged 29%, crypto’s correlation to S&P 500 spiked to 0.95. Leverage fueled the fire, $16.7B in longs obliterated, with Hyperliquid alone losing $1.23B across 6,300 wallets.
Historical echoes set context. 2018 tariffs on $34B Chinese goods dropped BTC 10%; 2019’s $360B expansion saw 15% pullbacks. By 2025, crypto’s $4T market cap and 20x leverage made shocks brutal. February’s Canada tariffs hinted at this, with $1B liquidations in a day.
Why so severe? Supply chain fears, China’s rare earth controls had already hiked mining costs 20%. Exchange glitches added pain: Binance API lags triggered $500M in unintended USDe liquidations. On-chain, BTC inflows jumped 150%, gas fees spiked 300%, signaling panic exits.
Not all bled equally. BTC held $100K support, rebounding 10% by Oct 12, buoyed by $150M BlackRock ETF inflows. ETH’s DeFi TVL dipped just 8%, with $481M whale buys. RWAs fell only 5%, drawing safe-haven flows. These divergences hint at crypto’s growing resilience.
Looking ahead: November 1 tariffs loom, risking 25% mining cost hikes and BTC capped at $110K. But history favors rebounds, with February’s 5% dip flipped to 15% gains in 48 hours. A trade thaw could push BTC to $140K by year-end, per $50B ETF inflow models.
Trader moves: Cap leverage at 3-5x pre-policy shocks. Set trailing stops 5-7% below BTC ($110K), ETH ($3,600). Hedge with VIX calls; time entries at Fear & Greed sub-30. Backtests show 12% rebounds post-tariff dips. Discipline turns panic into opportunity.
October's dip tests but doesn't break the bull. Stay prepared and trade smarter with Clometrix's quantitative data, pulled from over 45,000 volatility analysis data collected since 2008. With Clometrix's Forecasts, find where are the best buy/sell limits upon data release.
Full story at: https://t.co/NuYNL30thl
Alert: Bitcoin's plunging 3.3% this week from its $125K peak, erasing $200 billion and liquidating $630 million. Could this October dip kill the bull run or set up a monster rebound to $130K?
With Fear & Greed at 64 and whales accumulating, we dissected the causes, signals, and plays. Act fast or miss the turnaround.
Bitcoin's climb through September slowed to a sharp October pullback. As of October 11, 2025, BTC trades at $118,800.94, down 0.53% in 24 hours and 3.3% weekly from its $125,708 all-time high on October 5. Market cap stands at $2.42 trillion, with $200 billion evaporated since peaks. Liquidations reached $630 million. Ethereum sits at $4,557, off 0.7%, while Solana holds $233.49.
October has a strong history for Bitcoin, with nine green months out of 12 since 2013, averaging 22% gains. The 2021 cycle saw 40% rises amid DeFi hype. 2023 brought 28% on ETF hopes. 2024 delivered 10% despite mid-month dips. Pullbacks often follow September lows, but seasonal liquidity from taxes and holidays drives rebounds, especially in halving years like 2025.
The dip stems from macro headwinds and technical exhaustion. A resurgent U.S. dollar with DXY up 1.5% to 98.2 on tariff rhetoric and core PCE at 2.9% delays Fed cuts. Trump's 60% China levies echo 2018 trade wars. On-chain shows net taker volume at -$400 million. Exchange balances hit five-year lows at 2.36 million BTC, down 3%, as whales pull 170,000 coins.
Technically, the dip retraces 38.2% of the $109K-$125K rally, landing at $119K support. RSI at 62 signals cooling from overbought. MACD at 1,250 shows bullish momentum with divergence warnings. 50-day MA at $115,200 provides support. A break below $118K eyes $114K. Pivot at $122.5K resists. Changelly forecasts $123,176-$131,871 for October.
Bullish undercurrents persist. Liquidations at $630 million are mild versus $1.65 billion in September. Fear & Greed at 70 signals greed. ETF inflows total $57 billion YTD, with $985 million last week. Zcash rose 33%. Gold hit $2,685 ATH. X posts predict $106K dips before Q4 $150K-$180K rebounds.
Outlook favors a rebound, not end. It's a classic retrace in halving Q4, with historical 40% follows pauses. Success needs RSI below 60, ETF inflows over $200 million weekly, DXY under 98. Bear case tests $114K.
Shutdown delays test crypto's maturity but often birth rebounds. Stay prepared and trade smarter with Clometrix's quantitative data, pulled from over 45,000 volatility analysis data collected since 2008. With Clometrix's Forecasts, find where are the best buy/sell limits upon data release.
Full story at: https://t.co/0OlirpVVPg
A massive government shutdown just froze 16 crypto ETF decisions, stranding Grayscale's Solana fund and potentially erasing billions in inflows or sparking a 20% altcoin rally once it ends. Traders caught off guard could lose big, while prepared ones bank huge gains. We dissected the impact and strategies. A thread 🧵
The U.S. government shutdown hits its tenth day on October 10, 2025, halting SEC operations and delaying 16 crypto ETF rulings. Grayscale's Solana Trust conversion, set for October 10, now hangs in limbo alongside Canary's Hedera and Litecoin filings. Bitcoin holds at $124,500, Ethereum at $4,557, Solana at $233.49, with total crypto cap at $4.22 trillion amid anxiety.
Government shutdowns stem from 1974 Budget Act rules, occurring 21 times since 1976 and averaging 10 days. They cost $11 billion weekly in productivity. The 1995-96 21-day halts shaved 0.2% from GDP but left S&P 500 flat. In 2018-19's 35-day lapse, CFTC reports stalled, spiking volatility 12% and dropping BTC 20% before a 29% rebound.
Bitcoin ETFs faced rejections until January 2024 approvals unlocked $57 billion inflows. Ethereum ETFs launched in July 2024 with $14.6 billion cumulative by October. Grayscale's Solana filing in July 2025 aimed for mid-October ruling, now frozen. The 2023 near-miss shutdown stalled FIT21, dropping BTC 10% before reversal.
Delays affect 90 altcoin-focused ETFs, including VanEck and 21Shares for Solana. NFP data pushed to October 10 creates trading voids, amplifying swings. X posts on "Grayscale SOL delay" spiked 35%. Volatility analogs from 2018 show 15% gains post-resolution, with equities averaging -0.5% during shutdowns.
ETH's beta at 1.4 to BTC and SOL's 1.6 to equities rise 0.15 during delays. ETH inverse -0.72 to PCE inflation. SOL TVL at $91 billion and revenue $1.25B amplify rotations. Counterpoints note quick thaws and crypto resilience, with ETH staking at 36.2 million and RWA at $28 billion offering buffers.
Resolutions by October 17 could unlock $4T flows, with 10% to crypto pushing ETH to $5,000 on $500 million+ weekly inflows. Bear case sees ETH at $4,000 on prolonged delays. Strategies include buying ETH at $4,400 on >5-day shutdowns, hedging SOL shorts, and scaling entries in thirds for 3:1 risk-reward.
ETH ETF inflows in 2025 fuel massive potential but demand caution in volatile times. Stay prepared and trade smarter with Clometrix's quantitative data, pulled from over 45,000 volatility analysis data collected since 2008. With Clometrix's Forecasts, find where are the best buy/sell limits upon data release.
Full story at: https://t.co/RNFYmOcNkg
ETH ETFs just sucked in $500M weekly, igniting wild speculation of $5K prices while macro storms rage. Could this be the spark that 3x's your portfolio or the trap that burns it all? Inflows are fueling massive moves, and we dissected the trends, data, and risks. Traders, this is your warning shot.
ETH ETFs launched in July 2024 with $1.1 billion in first-day inflows. By August 2025, weekly inflows hit $500 million, pushing total AUM to $20 billion. This surge rivals Bitcoin ETF launches in 2024, which saw $14 billion inflows. BlackRock and Fidelity lead, holding 70% market share with low 0.19% fees.
Inflows drive price action. Ethereum rose 15% in August 2025 to $3,800, fueled by ETF demand. Speculation pushes toward $5,000, with analysts citing DeFi revival and staking yields at 3.8%. Historical parallels show 2021 ETF hype lifted ETH 400% to $4,878. But macro headwinds like 3% inflation temper gains.
Macro storms add volatility. Fed rate cuts at 80% odds post-Jackson Hole rally ETH 7%, but hot CPI data drops it 5%. Correlations with S&P 500 at 0.5 mean equity dips drag ETH, as seen in July 2025's 10% correction amid yield spikes to 4.2%. Inflows buffer this, reducing drawdowns 2-3%.
Case studies reveal patterns. November 2024 CPI miss rallied ETH 10% on $14 billion inflows. January 2025 NFP beat dropped it 4% amid $500 million liquidations. Solana surged 12% on similar flows, but privacy coins like Monero fell 5% on regulatory fears. Rolling correlations averaged 0.35 for ETH with M2 growth.
Counterpoints include risks. High yields above 4% pull capital from crypto, dropping ETF inflows 15% in Q2 2025. Regulatory scrutiny on staking ETFs could cap gains. But dovish policies and $1.64 trillion Chinese stimulus lift sentiment, with X posts buzzing 50,000+ on "ETH $5K season."
Future outlook sees $5,000 speculation if inflows hit $1 billion weekly. Traders hedge with options during events, spotting 3-5% swings via tools like Clometrix playbooks. Risk management is key. Diversify and set stops amid macro noise.