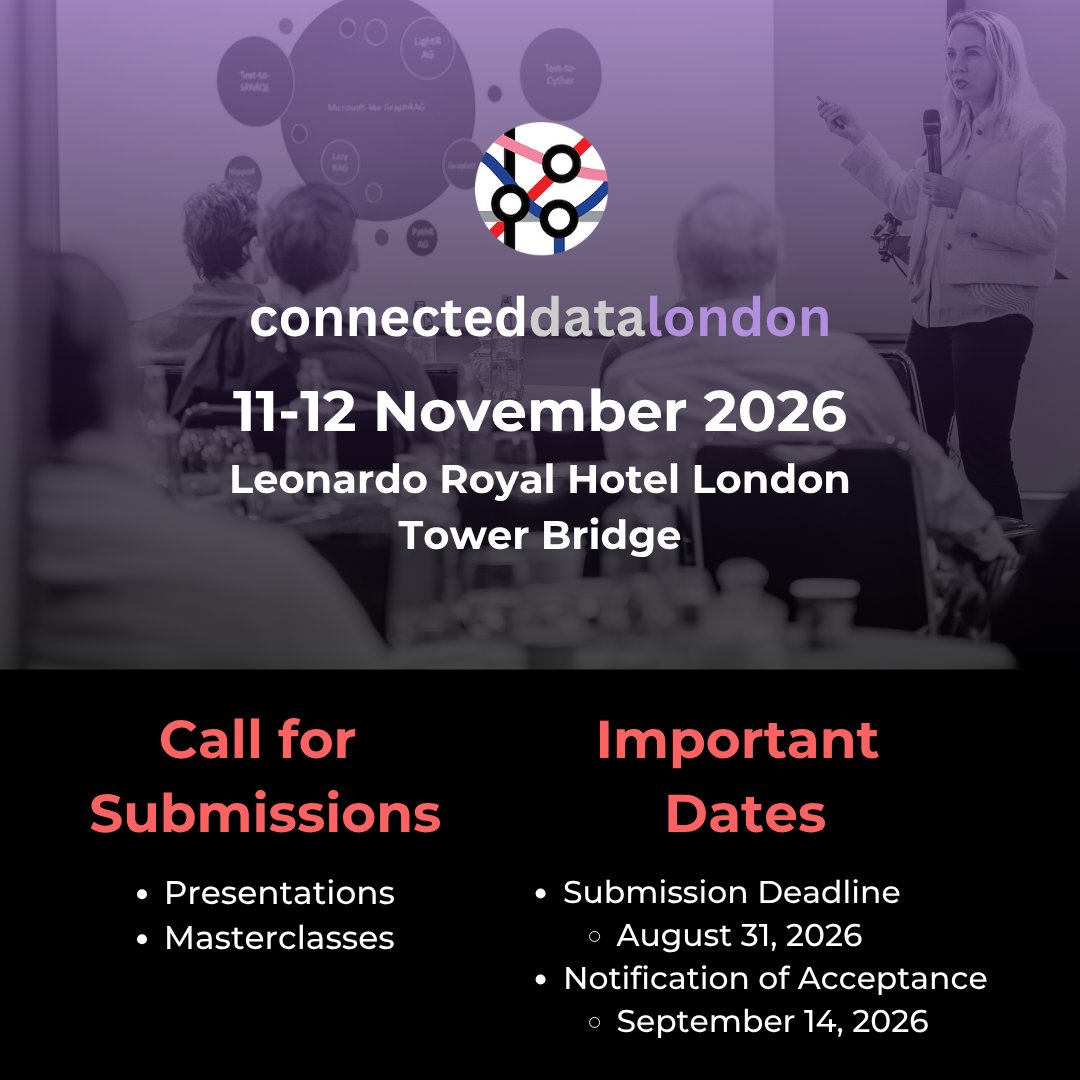
🚀 The wait is over! The Call for Submissions for #CDL26 is NOW OPEN.
Be a part of the celebration: 10 Years Connecting Data, People and Ideas
The leading global technology conference for those using Relationships, Meaning, and Context in Data to achieve great things.
Join us in the heart of London as we celebrate a decade of innovation in Knowledge Graphs, Graph Analytics, Data Science, AI, Graph Databases, Semantic Tech and Ontology this November.
Share your use cases and breakthroughs. Submissions are open across 2 areas:
Presentations:
Real world use cases and innovative approaches across 3 tracks: Nodes, focus on use cases, Edges, focus on innovation, Educational, focus on applications.
Masterclasses:
Hands-on tutorials in which instructors teach attendees skills they can use in their daily work.
Why Speak at CDL26?
Global Platform: Join 350+ luminaries who have graced our stage and reach our ever-growing global audience of thousands.
Adoption and Innovation: From the resurgence of Ontologies to the cutting edge of Agentic AI and Context Graphs.
Speaker Benefits: Free event pass, speaker guidance, and exclusive network discounts.
📅 Deadline: Aug 31
✅ Notification of Acceptance - September 14, 2026
Topics of interest and submission guidelines here:
🔗 https://t.co/oTl7PWU6pm
#ConnectedData #KnowledgeGraphs #DataScience #AI #GraphDB #Analytics #SemTech #EmergingTech
Gold Sponsor: Google BigQuery 🥇
Google joins Connected Data London 2026 as a Gold Sponsor.
An autonomous data to AI platform, they automate the entire data life cycle from ingestion to insights. Their fully managed serverless cloud data warehouse enables scalable high speed analysis of massive datasets without the need for infrastructure management. By separating storage and compute, they help organisations build cost efficient and AI ready data workflows.
See how they are accelerating the journey from data to action at CDL26:
https://t.co/SCkSdWaOro
#CDL26 #ConnectedData #GoogleCloud #BigQuery #DataAnalytics #AI #BigData #CloudComputing
#KnowledgeGraphs #DataScience #AI #GraphDB #Analytics
Introducing Spanner Graph algorithms
At Google Cloud Next, Google announced the preview of graph algorithms with Spanner Graph, bringing Google Research's state-of-the-art graph mining capabilities natively into an operational database.
Enterprises are increasingly leveraging graph technologies to uncover complex relationships in data for fraud detection, social network analysis, entity resolution, and healthcare research.
Graph algorithms -- such as node centrality and community detection -- are the computational methods used to analyze these structures, quantifying patterns and the strength of connections between entities.
Running graph algorithms at scale has historically been challenging and resource-intensive, often requiring complex ETL pipelines to dedicated analytic solutions or risking the transactional performance of the graph database.
Spanner Graph algorithms are designed to tackle demanding enterprise workloads without compromising operational database performance:
Tight integration with GQL: Directly invoke algorithms using ISO Graph Query Language (GQL) to run structural analytics across your data, minimizing complex data movement to external engines.
Near-zero transactional impact: Algorithm execution happens on dedicated compute resources via Data Boost, without custom ETL pipelines. Pay only for what you use.
Global insights on billion-edge graphs in minutes: The engine can run algorithms on graphs with tens of billions of edges within minutes, using dense topology encoding optimized for random access.
Algorithms available include centrality (betweenness, closeness, PageRank), community detection (label propagation, correlation clustering, modularity clustering, weakly connected components), and similarity/path finding (Jaccard, cosine, set-to-set shortest paths).
Customers including DaVita, Yahoo!, SoundCloud, and WPP are already using Spanner Graph algorithms for patient 360, personalization at scale, music graph analytics, and enterprise intelligence.
By Bei Li and Vahab Mirrokni
https://t.co/BUSqQBWPYj
#SpannerGraph #GraphAlgorithms #GraphDatabase #FraudDetection #EntityResolution
--
Connected Data London 2026 | 11–12 November | Leonardo Royal Hotel London Tower Bridge
🎤 Share your work with the world's most passionate data community. The Call for Submissions is open. https://t.co/thpqGAT6Gp
🎟 Tickets on sale now. Early bird discounts up to 30%. https://t.co/S8DdjV3SGZ
📺 Sponsorship opportunities available. Contact [email protected] for details.
#KnowledgeGraph #GraphRAG #Ontology #Graph #AI #DataScience #GraphDB #SemTech
Understand Anything
A tool that turns any codebase into an interactive knowledge graph you can explore, search, and ask questions about.
You just joined a new team. The codebase is 200,000 lines of code. Where do you even start?
Understand Anything is a Claude Code Plugin that analyzes your project with a multi-agent pipeline, builds a knowledge graph of every file, function, class, and dependency, then gives you an interactive dashboard to explore it all visually. Stop reading code blind. Start seeing the big picture.
The goal isn't a graph that wows you with how complex your codebase is — it's a graph that quietly teaches you how every piece fits together.
Here's what actually happens when you run it.
Six agents analyze your project in parallel. A knowledge graph gets built of every file, function, class, and dependency. An interactive dashboard opens, color-coded by architectural layer, fully searchable, every node clickable with plain-English explanations.
Then you get =>
→ /understand-chat - ask anything about the codebase in plain English
→ /understand-diff - see what your changes affect before committing
→ /understand-explain - deep dive into any specific file or function
→ /understand-onboard - generate an onboarding guide for new team members
→ /understand-domain - extract business domain knowledge as a horizontal graph
→ /understand-knowledge - analyze a wiki and surface implicit relationships as a navigable idea graph
The persona-adaptive UI is a detail I hadn't seen before, the dashboard adjusts its detail level depending on whether you're a junior dev, PM, or power user.
It supports multilingual output too. Run /understand --language zh and the entire dashboard generates in Chinese.
It works with Claude Code, Cursor, Copilot, Gemini CLI, Codex, OpenCode, Vibe CLI, Cline, KIMI CLI.
H/T Sandhya Ahuja.
https://t.co/IhpvZ8Xczu
--
The Year of the Graph's Summer 2026 newsletter issue on all things #KnowledgeGraph, #GraphDB, Graph #Analytics / #DataScience / #AI and #SemTech is coming soon.
Subscribe and follow to be in the know. Reach out if you'd like to be featured 👇
Disneyland meets AI, knowledge graphs and ontology for enterprise systems at SAP
“Show me purchase orders with the status ‘deleted’” – such a simple question can be challenging to process for a real-life large enterprise system, which is based on huge amounts of heterogenous metadata providing only sparse semantics.
In this presentation, we show a real-life implementation in which a knowledge graph contributes to addressing this challenge. We describe what it took to build the knowledge graph, illustrate its interaction with generative AI for natural language processing, and finally, discuss remaining challenges and opportunities in the realm of AI agents, data products, and foundation models on structured and unstructured data.
The presentation will also position the topic in relation to MCP (Model Context Protocol) and answer the question: (why) should your MCP servers and tools be powered by a knowledge graph?
Outline of the presentation
Motivation: use cases for natural language access to enterprise data
How to ride the current wave: why MCP (Model Context Protocol) will not solve all data access challenges
Challenge 1: discover APIs (or MCP servers)
Challenge 2: select API subsets (or MCP tools)
Opportunity 1: resolve your challenges with knowledge graphs
Opportunity 2: the context layer & how to provide additional value beyond semantics
The way forward: technical and non-technical means to scale contextualised data access
Target audience: Business & technical
Level: intermediate
Required background: knowledge graphs and basics of generative AI
Link to talk: https://t.co/V8LV22WpRj
--
Felix Sasaki. Chief Expert for Knowledge Graph and Semantic Technology, SAP
Felix Sasaki is Chief Expert for Knowledge Graph and Semantic Technology in the AI Unit at SAP.
--
Welcome to Connected Data London's #TeaserTuesday
Every Tuesday, we share teasers from #CDL25 on our channels
Connected Data London 2025 brought together leaders and innovators. Were you there?
🎥 Watch the sessions: https://t.co/w61JGmLcxh
📩 Join the community: https://t.co/RMj1EA5vl1
Tune in and learn from leaders and innovators; subscribe and watch premieres as they are released!
Join community legends and new voices in #CDL25 for all things #KnowledgeGraph #Graph #analytics #datascience #AI #graphDB #SemTech #Ontology
Knowledge Operations: A Capability Model for AI Systems
Classifying AI systems by the knowledge operations they perform, not the data formats they use.
Two AI systems can both be called "RAG" while performing fundamentally different kinds of knowledge work; conversely, two systems can use different substrates—vectors, SQL, graphs, or tools—while satisfying the same workload requirement. This mismatch makes architecture-centered labels a poor guide to capability.
This whitepaper proposes the inverse:
A system's capability in handling knowledge-augmented work is determined by the knowledge operations it performs reliably, not by the format of the data it retrieves.
Storage and architecture are inputs.
Knowledge operations define capability: retrieving, scoping, interpreting, combining, computing, traversing, orchestrating, governing, and evaluating.
Some are reasoning operations (synthesis, multi-hop traversal, contradiction detection, evaluator-optimizer judgement).
Others (scoping, permission enforcement, audit logging) are control operations that support reasoning instead of performing it. Both count toward fitness.
A knowledge graph does not make a system more capable than one using vector search; ten agents are not automatically more capable than one. The right architecture matches the epistemic demands of the task.
The broader category is called Knowledge-Augmented Systems (KAS): AI systems that combine language models with external knowledge, structure, computation, and execution.
The model proposes seven capability archetypes (K0–K6) wrapped by a governance scale (G0–G5) and an evaluation discipline applied to every operation.
Together they produce a capability profile rather than a single level: a system can be strong at scoped retrieval and cross-source synthesis while having no need for relational reasoning or computation.
That is an appropriate design choice for the workload, not a deficit. Buyers and architects should evaluate fit per workload, not per industry or per vendor stack.
"Fitness to task" is not relativism. The framework retains prescriptive force: a profile is insufficient when the task demands operations the system cannot perform, when governance is below the risk class's prerequisite, or when the system over-engineers operations the task doesn't require, paying latency, cost, and complexity the task cannot absorb.
By Gerasimos Xydas
https://t.co/vFwm2j9o2q
#EmergingTech #RAG #GraphRAG #KnowledgeOps #EnterpriseArchitecture #AgenticAI #DataEngineering #DataModeling
--
Connected Data London 2026 | 11–12 November | Leonardo Royal Hotel London Tower Bridge
🎤 Share your work with the world's most passionate data community. The Call for Submissions is open. https://t.co/jivMJrAaTS
🎟 Tickets on sale now. Early bird discounts up to 30%. https://t.co/l8h5ff6Ytl
📺 Sponsorship opportunities available. Contact [email protected] for details.
#KnowledgeGraph #GraphRAG #Ontology #Graph #AI #DataScience #GraphDB #SemTech
Context Graph Architecture in 2026: Linked Data Orchestration and the Thin Red Line
Context graphs need knowledge architecture. But what does it take to build one? The answer has been hiding in plain sight for years.
Why context graph knowledge architecture need an inference layer, not just an entity layer, to deliver on their promise for enterprise architecture
How ArchiMate 3.2 as an RDF ontology provides the knowledge architecture substrate: federation, derivation rules, and the relationship no architect ever draws
Why hydration remains the practical barrier, and what’s changed since the problem was first named in 2012
How to manage the RDF reasoning cost as an engineering choice between forward and backward chaining
When Foundation Capital declared context graphs AI’s next trillion-dollar opportunity, the hype engine ran with it and the industry rushed to build. But Enterprise Architecture practitioners recognized the problem immediately: they’d been solving it for 40 years.
The real challenge isn’t inventing a new category. The challenge is connecting what EA has always done – mapping organizations’ technology, capabilities, and decisions – with the knowledge architecture layer that turns those fragmented traces into governed, machine-queryable intelligence.
As Forrester’s Charles Betz notes, the center of gravity in enterprise architecture is shifting from documentation to decision velocity. The pain was never that architects couldn’t find issues. Issues arrive daily from linters, scanners, peer reviews. The pain was delay and unpredictability. Designs disappearing into queues. Governance becoming friction.
So what’s the infrastructure that can make decision velocity possible at architectural scale?
In “Beyond the Decision Trace“, we argued that three approaches – the BI semantic layer, context graph/EA, and knowledge graph/ontology – are tackling the same problem from different angles and not talking to each other. The connecting thread is context graph knowledge architecture: formal representation of concepts, relationships, constraints, and inference rules, in machine-queryable form.
We pointed out a concrete piece of that infrastructure – Alberto Mendoza’s work on ArchiMate 3.2 as an RDF ontology. Now is the time to ask what it would take to put it to work. Not as an academic exercise. As engineering.
The answer leads somewhere unexpected: back to 2012, and a problem that keeps coming back under different names.
By George Anadiotis
https://t.co/940ONctzKY
--
🤝 Put your graph tech brand in front of the people who matter
Your graph technology deserves to be seen by buyers, analysts, and builders who are actively shaping the space.
The Year of the Graph is the independent hub that this community trusts.
Slots for the upcoming Summer 2026 Issue are filling fast. Reach out and book yours now 👇
https://t.co/LCvoLhhBBt
📢 #CDL26 UPDATE - Early Bird extended to 15th of June 2026 at midnight.
Lock in your 30% baseline saving before the price increase. Book your pass today—new speaker announcements are coming soon.
👥 Team Bookings: Take an additional 20% off for groups of 3 or more to get your engineering and strategic leads working from the same blueprint.
Secure the best rate now, and we’ll see you in November.
#ConnectedData #CDL26 #DataArchitecture #EnterpriseData #DataGovernance
#KnowledgeGraphs #DataScience #AI #GraphDB #Analytics #SemTech #EmergingTech
Graph reveals self generated architecture of 7 different systems
These graphs show the self generated architecture of 7 different systems.
Each of those graphs contain objects, function calls and data structures. What might not be obvious is those seven systems do the same thing. They were built with the same specification, same testing suites, same tools, same environment but by seven different teams.
Why such huge differences?
First, the code is the real architecture and not some diagram in a specification document (which is little more than a statement of belief).
Second, the real architecture represents all the hundreds or thousands of small decisions made by the person building the code. The choices they make depends upon many factors from experience to the values they have.
As Norman Foster said, "Architecture is an expression of values" and that's true no matter what type of architecture we are talking about.
Whenever you build a system with a co-pilot or an agentic swarm, thousands of small decisions are being embedded into your architecture based upon the values those LLMs have been trained with.
The LLM is culturally a non kinetic form of warfare. It's no different from how we've used art such as Hollywood, video games or books to change other cultures. Except this time it's on steroids and there are few players in the game.
It's about time people started talking about values in this world of AI where everything is sacrificed to expediency.
By Simon Wardley
https://t.co/MREI28GuDD
--
Connected Data London 2026 | 11–12 November | Leonardo Royal Hotel London Tower Bridge
🎤 Share your work with the world's most passionate data community. The Call for Submissions is open. https://t.co/thpqGAT6Gp
🎟 Tickets on sale now. Early bird discounts up to 30%. https://t.co/S8DdjV3SGZ
📺 Sponsorship opportunities available. Contact [email protected] for details.
#KnowledgeGraph #GraphRAG #Ontology #Graph #AI #DataScience #GraphDB #SemTech
Four Arguments Ontologists Never Finished (And Why AI Teams Will Have Them Again)
Twenty-five years of semantic web arguments. AI teams are about to have every single one of them again.
Ontology is having its moment in the sun right now, after being largely sidelined for the past decade, and the timing is not coincidental. Demand for ontologists is rising.
There is growing recognition that a strong semantic foundation is necessary for keeping LLMs grounded in reality. The persistence of memory, along with structured and well-described metadata, are clearly making a major difference in how we build AI systems.
Yet this hasn’t come easily. The semantic community has been debating these issues for a quarter century, and even now there is significant contention about what an ontology is, how it should be formed, and how it fits into the broader context of AI.
This article looks at four areas where ontologists were not so much flat-out wrong as persistently unfinished, and where AI teams are now rediscovering the same fault lines, usually without knowing they are standing on them.
1. Open vs. Closed World Assumption
This is the foundational assumption underlying the biggest distinction between the semantic community and the rest of the data modelling world. It ultimately comes down to governance: if you and I both create a model of some aspect of the world, which model is correct?
In the open world model, the assumption is egalitarian: both. In the closed world model, the assumption is authoritarian: mine is.
2. The Importance of Reification
Language is highly referential. When you use a subordinate clause, what you are qualifying is often not the subject but the whole assertion, an annotation on an assertion.
Reifications are references to assertions themselves.
3. Context Graphs and the Primacy of Time
Knowledge graphs first emerged in the mid-2010s as a way of describing things in a system and how they relate to other things. In this model, there is no particular distinction about time.
Most knowledge graphs treat time as an uncomfortable afterthought. This has come back to bite ontologists repeatedly, because time is another way of saying change.
4. Named Graphs, Namespaces, and the Edges of Authority
What is a graph? This is one of the thorniest questions in ontology, though it has not been fully acknowledged as such.
The default notion under the open world assumption was a collection of assertions, open-ended by nature. On its face, not unreasonable. If you have a global identifier for a resource, you do not really need to partition the graph.
Where things get uncomfortable is when multiple authorities assign assertions about the same entity under different identifiers, where even the nature of those entities may differ from one authority to the next.
By Kurt Cagle
https://t.co/drS2AV6jCr
--
Connected Data London 2026 | 11–12 November | Leonardo Royal Hotel London Tower Bridge
🎤 Share your work with the world's most passionate data community. The Call for Submissions is open. https://t.co/thpqGAT6Gp
🎟 Tickets on sale now. Early bird discounts up to 30%. https://t.co/S8DdjV3SGZ
📺 Sponsorship opportunities available. Contact [email protected] for details.
#KnowledgeGraph #GraphRAG #Ontology #Graph #AI #DataScience #GraphDB #SemTech
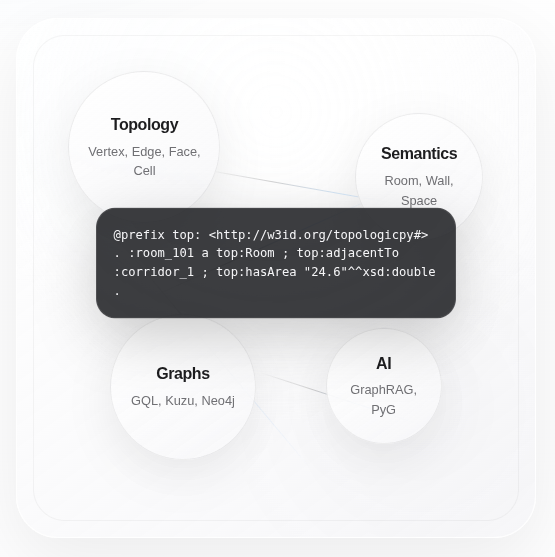
TopologicPy is a spatial-semantic graph framework
A computational environment where geometric entities, topological relationships, building semantics, graph analytics, databases, GQL, GraphRAG, RDF, and AI workflows can speak the same ontology.
With the help of LLMs, a formal, comprehensive, consistent and persistent semantic layer has now been added that defines and connects concepts such as:
* Vertex, Edge, Wire, Face, Shell, Cell, CellComplex, Cluster, Graph
* Space, Room, Wall, Door, Window, Storey, Building
* Relationships, metrics, provenance, and analysis results
* IFC-derived entities and their semantic classifications
* RDF/OWL classes and properties for linked-data workflows
This starts to connect several worlds that are often treated separately:
* IFC and BIM geometry
* Topological spatial models
* Graph databases such as Neo4j
* GQL-style graph querying
* RDF and OWL semantic web models
* Linked Building Data
* BOT, Brick, and related building ontologies
* Graph machine learning
* GraphRAG and AI-based spatial reasoning
TopologicPy has morphed into a spatial-semantic computing framework: one that can move between geometry, topology, BIM, graphs, RDF, OWL, Linked Building Data, graph databases, machine learning, and AI reasoning.
By Wassim Jabi
https://t.co/cDEKqi31DA
#TopologicPy #SpatialComputing #BIM #LinkedBuildingData #GraphML #OpenSource
--
The Year of the Graph's Summer 2026 newsletter issue on all things #KnowledgeGraph, #GraphDB, Graph #Analytics / #DataScience / #AI and #SemTech is coming soon.
Subscribe and follow to be in the know. Reach out if you'd like to be featured 👇
https://t.co/7pg6gqWYvw
Graph Systems for Data in Motion
Enterprises employ Graphs systems (as property graphs, Knowledge Graphs, etc) to model business logic semantic and gather insights from their entire estate. Sources of truth are generally silos and business insight requires traversal though multiple of these silos to gather insight for scenarios like Customer 360, logistics, security, etc. Graph systems are the emerging technologies to achieve that.
Data is continuously evolving in multiple ways: schema is changing and new columns or details are augmented to existing sources of truth; entire new datasets are enhancing the business logic; data itself is continuously augmented and is streaming in continuously. Analytics systems deal, in general with data at rest while in real world enterprise have data in motion.
Graph system achieve their latency and richness through indexing and/or de-normalization for fast traversal. In order to minimize the cost of such techniques, the tradeoffs is to silo the analysis most of the time but still bring the “whole” graph together when needed.
We are proposing a framework to handle the realities of data in motion using graph systems. These are generic techniques anyone can employ and model over their existing systems; our product blueprint will incorporate this framework into its roadmap. The framework is built on the following principles:
The graph model is defining the graph schema and semantic, but the indexing should be lazily built to optimize the cost. We strongly believe that graphs are valuable and accepted as indices, an overlay that is not requiring changes to sources of truth in the enterprise
Models should be hierarchical to be able to compose semantic from multiple sources, allowing either localized use of smaller graphs or global views that span over multiple graphs. Users could further project or extend these models as they need. Enterprises will be able to deploy stable semantics and users can still experiment and avoid rigid schemas.
Systems that allow accretive schema and data changes allow real-time updates to these graphs.
We provide examples through a fictional graph scenario that the audience could relate to; we show these techniques can be used to handle exabyte size streaming data estates in a cost effective manner.
https://t.co/JJI69cWa0M
--
Bogdan Arsintescu. Lead Software Architect, Microsoft
Justin Fine. Principal Product Manager, Microsoft
--
Welcome to Connected Data London's #ThrowbackThursday
Every Thursday at 3pm GMT, we are releasing gems from our vault on #YouTube
Tune in and learn from leaders and innovators; subscribe to our channel and watch premieres as they are released!
#knowledgegraph #graphdatabase #graph #AI #datascience #analytics #semtech #ontology
Why Metadata, Semantics, Taxonomy, Ontology, Knowledge Graphs, and Context are relevant in the age of AI
Every AI agent failure can be traced back to the same root cause: nobody agreed on what the data means.
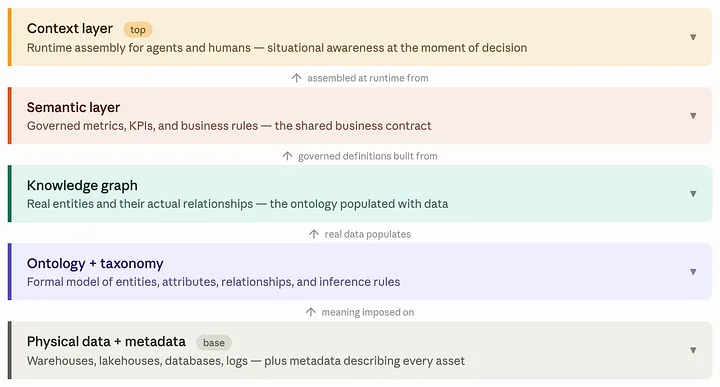
Metadata, semantics, taxonomy, ontology, knowledge graphs, and context are not interchangeable buzzwords. They are a stack, and each layer does a specific job. Skip one, and the system breaks in a predictable way. Get them all right, and you have the difference between an agent that hallucinates and one that reasons.
Here is what each layer actually does:
Metadata makes assets findable and trustworthy - the serial number, the warranty date, the table schema. The substrate everything else depends on.
Semantics turns symbols into meaning. "Active Customer" means nothing until someone defines it as a customer with at least one transaction in the last 90 days.
Taxonomy organizes concepts into parent-child hierarchies. It lets you ask "show me all laptops" without enumerating every model in existence.
Ontology adds the relationships. Not just that a MacBook Air is a laptop, but that it has a chip, ships with an OS, is owned by a customer, and is covered by a warranty.
Knowledge graph populates the ontology with real data. The ontology is the schema. The knowledge graph is the queryable, connected instance of it.
Context is the runtime assembly - pulling the right slice from every layer below, plus session state, recent actions, and applicable policy, at the moment of decision.
When humans get three different revenue numbers from three different reports, we tolerate the chaos by reconciling inconsistency through conversation. Once the consumer is an agent, the same chaos becomes operational risk. AI will not solve our consistency problem. It will scale it.
By Sanjeev Mohan.
FAQ on Metadata, Semantics, Taxonomy, Ontology, Knowledge Graphs, and Context https://t.co/zn0XoNZLAr
#Metadata #SemanticLayer #KnowledgeGraph #Ontology #EnterpriseAI
--
Connected Data London 2026 | 11–12 November | Leonardo Royal Hotel London Tower Bridge
🎤 Share your work with the world's most passionate data community. The Call for Submissions is open. https://t.co/thpqGAT6Gp
🎟 Tickets on sale now. Early bird discounts up to 30%. https://t.co/S8DdjV3SGZ
📺 Sponsorship opportunities available. Contact [email protected] for details.
#KnowledgeGraph #GraphRAG #Ontology #Graph #AI #DataScience #GraphDB #SemTech
Knowledge Graph Research, Applications and Best Practices
Similar to how software engineering is a premium application domain for knowledge graphs, graph is emerging as the fastest growing segment in AI research. Graph was a significant part of NeurIPS 2025, signifying its growing importance and market share.
Dan McGrath’s findings reinforce this. McGrath tracked the raw growth of graph-related research against the baseline of all AI papers from 2023 to present. The results show a clear acceleration, with a turning point in 2024, when graph became the fastest growing segment in AI research.
Real-world applications abound as well, as shown in Juan Sequeda’s Connected Data London 2025 trip report. A knowledge graph conference where every single talk came from businesses. Not by vendors. Not POCs. Real production deployments with mature architectures and well thought out roles and processes.
Sequeda has been a knowledge graph builder and advocate for decades. He shared 20 lessons from 20 years of building ontologies and knowledge graphs, and he will be back to Connected Data London 2026 as part of an initial lineup also featuring William Tunstall-Pedoe, Malcolm Hawker and Jessica Talisman.
Veronika Heimsbakk wrote a series of posts for data engineers looking to understand knowledge graphs. Kicking off with the motivation – why you should care about knowledge graphs – she elaborates on data engineering ontologies, a few elementary pieces on logic, and shares a translation guide – SPARQL for SQL developers.
Ashleigh Faith also has decades of experience modeling knowledge graphs and ontology. She shares her top 10 modeling tips for ontology and graph. While her tips have a heavy focus on RDF-based graph models, the principles are deep enough to be useful for almost any graph data modeling project.
The debate between the RDF and Labelled Property Graph (LPG) graph data models is ongoing. Sergey Vasiliev explains Property Graph and LPG as structural and applied semantic models, places RDF in its role as a general semantic framework, and formally analyses the relationships between them. He argues RDF is a knowledge representation model and LPG is decision infrastructure.
Niklas Emegård shares a no-ontology hack to show that you don’t need to spend weeks data modeling to start building a RDF knowledge graph, and Pieter Colpaert argues for eventual interoperability– avoiding getting stuck on making trade-off decisions and having to wait for consensus.
--
📩 Excerpt from The Year of the Graph Spring 2026 newsletter
Read "Beyond Context Graphs: How Ontology, Semantics, and Knowledge Graphs Define Context" with more sections, references and attribution here 👇
https://t.co/pxabFH0ide
All things #KnowledgeGraph, #GraphDB, Graph #Analytics / #DataScience / #AI and #SemTech.
Beyond the initial build: How do you maintain a Knowledge Graph at scale? 📈
For #CDL26, we are calling for pioneers who are borrowing practices from software engineering to manage the full lifecycle of their graphs. We want to move the conversation from "Look what we built" to "Look how we manage it."
We are seeking submissions on:
Persistence & Virtualisation: When to use in-memory vs disk-based stores.
Provenance & Versioning: Handling updates and lineage in a graph environment.
Certification & Training: Ensuring your team has the skills to meet growing demand.
Share your operational breakthroughs with a technical audience in London.
🗓️ Deadline: 31 August
🔗 Guidelines and Submissions: https://t.co/dKwVP5KTMd
#CDL26 #ConnectedData #KnowledgeGraphs #DataScience #AI #GraphDB #Analytics #SemTech #EmergingTech #DataManagement #EngineeringExcellence #MLOps
Ontology Isn't the Hard Part: Why Enterprise AI Fails at the Layer Beneath
If you have been following the enterprise AI debate, you will have encountered a growing consensus: AI only works when anchored in structured context. Ontology, semantic layers, knowledge graphs -- the terminology varies, but the argument is consistent. Without structured context, AI produces outputs that are syntactically correct but operationally meaningless.
That argument has largely been won. And it raises an immediate follow-on question.
If organisations now understand that ontology matters -- if they are investing in semantic modelling, shared data models, and workflow definition -- why do so many implementations still fracture at scale? Why does the gap between successful pilot and reliable deployment remain so persistent?
The answer is not that the ontology is wrong. It is that the system beneath the ontology was never built to support it.
Most enterprise systems were not built with AI in mind. The result is what Rowland Agidee calls Application Design Debt -- not technical debt in the conventional sense, but structural misalignment between how systems were designed to operate and what is now required for data-driven, AI-enabled decision-making.
Application Design Debt is invisible in normal operation. The debt only becomes visible when you introduce a semantic layer that requires stable, consistent, traceable data flowing through systems that were never designed to provide it.
Ontology sits on top of this debt. It does not erase it.
The fix requires shifting focus one level down -- to Infrastructure Trust: the degree to which a system can guarantee five properties.
Provenance continuity
Semantic stability
Integration determinism
Transformation transparency
Change observability
Without them, ontology is a well-designed structure resting on ground that shifts. With them, AI becomes something an organisation can genuinely depend on.
"The organisations that close the pilot-to-scale gap are not those with the most sophisticated models or the most ambitious semantic architectures. They are the ones that looked one layer below where everyone else was looking -- and built something solid there first."
By Rowland Agidee.
https://t.co/IfmmX12ROY
#EnterpriseAI #Ontology #DataArchitecture #SemanticLayer
--
Connected Data London 2026 | 11–12 November | Leonardo Royal Hotel London Tower Bridge
🎤 Share your work with the world's most passionate data community. The Call for Submissions is open.
https://t.co/jivMJrAaTS
🎟 Tickets on sale now. Early bird discounts up to 30%. https://t.co/l8h5ff6Ytl
📺 Sponsorship opportunities available. Contact [email protected] for details.
#KnowledgeGraph #GraphRAG #Ontology #Graph #AI #DataScience #GraphDB #SemTech
Giving AI a Shared Language: Unified Knowledge Graphs for Multimodal Data
Multimodal AI is moving fast: systems like GPT-5.5 can already process text and images in one system.
If multimodal AI is moving this fast, do we still need Unified Knowledge Graphs?
Multimodal AI and Unified Knowledge Graphs are two different paths toward the same goal.
A multimodal AI system can learn a common language implicitly.
In a Unified Knowledge Graph, the common language is built through explicit relationships.
That makes the structure more visible, reusable, and easier to verify.
Unified Knowledge Graphs are a relationship-aware layer around AI systems.
GPT-5.5 can process the pieces.
Relationships explain how they belong together.
By Elena Romanova
https://t.co/I63XL0MVjM
#MultimodalAI #UnifiedKnowledgeGraph #KnowledgeRepresentation #ExplainableAI #GraphTechnology #LLM #AIArchitecture #DataIntegration #GPT5
--
Join the Conversation
Subscribe to the Year of the Graph newsletter for quarterly insights on #KnowledgeGraphs, #GraphDB, Graph #Analytics, #AI, #DataScience and #SemTech .
📧 Subscribe: https://t.co/7pg6gqWYvw
💼 Sponsorship inquiries: https://t.co/LCvoLhhBBt
Ontology and knowledge graphs in telecoms
Knowledge graphs power the systems we use every day, from search engines to recommendation platforms. Behind these systems lies a model: a connected view of data drawn from different sources, enriched with rules that give meaning to the relationships. This modelling process is what enables knowledge graphs to support complex use cases, from answering questions to generating recommendations.
In this masterclass, we will explore how dataflows provide a practical way to build such models. A dataflow offers a visual and repeatable approach for transforming structured data into RDF, applying business rules and linking domains into a unified graph. By defining how different pieces of data connect, dataflows turn raw inputs into a meaningful, queryable model.
Using files that represent domains of a telecom network, we will build a knowledge graph step by step. Participants will see how to load structured data, apply rules to model relationships across domains, and query the graph to generate useful visualizations of the network.
Designed for data scientists and engineers of all levels, this session introduces the high-level concepts of modelling with knowledge graphs while providing hands-on skills for creating them. You will leave with an understanding of how dataflows bridge raw data and connected models - the foundation of the intelligent systems we rely on every day.
Link to Masterclass - Graphs in the Real World: Modelling for Complex Enterprises: https://t.co/3QQh7Z8Ha3
#AI #emergingtech #digitaltwin #datamodeling
--
Xanthos Angelides. Business Development Manager, NumoData
Xanthos is a Business Development Manager and seasoned technology leader with over 25 years of experience in telecoms. Starting his career as a consultant, he went on to lead roles in product, pre-sales and delivery.
Mark Manley. Solutions Architect, NumoData
Mark is an experienced Solutions Architect and Trainer with a background in computer science and information systems.
--
Welcome to Connected Data London's #TeaserTuesday
Every Tuesday, we share teasers from #CDL25 on our channels
Connected Data London 2025 brought together leaders and innovators. Were you there?
🎥 Watch the sessions: https://t.co/w61JGmLcxh
📩 Join the community: https://t.co/RMj1EA5vl1
Tune in and learn from leaders and innovators; subscribe and watch premieres as they are released!
Join community legends and new voices in #CDL25 for all things #KnowledgeGraph #Graph #analytics #datascience #AI #graphDB #SemTech #Ontology
Ontologist / Knowledge Engineer / Knowledge Graph Engineer - Via Ex-Amazonians
What does it actually mean to work as an Ontologist or Knowledge Engineer? A detailed job description - built with input from practitioners who've done the work at Amazon - breaks it down clearly.
The role sits at the intersection of data, semantics, AI, and business understanding. It combines ontology development, knowledge graph design, semantic modeling, data integration, and stakeholder communication. In practice it can range from highly conceptual ontology architecture to hands-on pipelines, graph queries, and system design.
The title varies. You might see: Ontologist, Knowledge Engineer, Knowledge Graph Engineer, Semantic Layer Specialist, or simply Data Engineer. Many organizations use overlapping or imperfect titles, especially when ontology work is embedded inside larger data or AI teams.
Core responsibilities include:
Defining concepts, entities, relationships, and semantic structures
Building and maintaining knowledge graphs
Connecting datasets with inconsistent schemas or terminology
Supporting AI, search, recommendation, and question-answering systems
Translating business concepts into machine-readable models
Facilitating conversations between departments with conflicting terminology
Key skills span three areas:
Knowledge Engineering: identifying reliable data sources, writing mappings between data sources and ontologies, developing consistency and reasoning engines, writing graph queries (SPARQL, Cypher, TKQL), handling linguistic ambiguities, regression and progression testing, creating data visualization templates.
Ontology Work: scoping use cases and competency questions, gathering SME input, modeling and extending ontologies, writing inference rules and reasoning logic, improving guidelines and naming conventions, internationalizing ontologies.
Data Engineering: ETL pipeline development, knowledge graph performance metrics, data integration across formats and schemas.
A typical day might include meeting with stakeholders to clarify terminology, designing ontology structures, mapping incoming datasets into a graph model, writing design documents, and educating internal teams about semantic layers.
Key personal traits: highly organized, comfortable with ambiguity, patient communicator, able to balance idealism with practicality.
By Ashleigh Faith, Beth Homes and Christelle Maignan (Ex-Amazonians)
https://t.co/nQQh2buOSh
#KnowledgeEngineering #Ontology #SemanticModeling #DataEngineering #EnterpriseAI
--
Connected Data London 2026 | 11–12 November | Leonardo Royal Hotel London Tower Bridge
🎤 Share your work with the world's most passionate data community. The Call for Submissions is open. https://t.co/thpqGAT6Gp
🎟 Tickets on sale now. Early bird discounts up to 30%. https://t.co/S8DdjV3SGZ
📺 Sponsorship opportunities available. Contact [email protected] for details.
#KnowledgeGraph #GraphRAG #Ontology #Graph #AI #DataScience #GraphDB #SemTech
Choosing the Right Graph
The right graph is rarely just about the data model. It is also about the organisation around it.
Since roughly 2012, the knowledge graph category has collapsed two quite different intellectual traditions into a single marketing category.
The first - RDF and OWL - descends from formal logic, knowledge representation, library science and Berners-Lee's Semantic Web. The second - the labeled property graph (LPG) used by Neo4j, Apache TinkerPop and most contemporary graph databases - descends from graph theory, object-oriented databases and the operational demands of connected-data applications such as social networks, fraud detection and recommendation engines.
Both are graphs. Both are routinely called "knowledge graphs." Yet the data models, semantics, query languages, governance assumptions and engineering economics differ enough that picking the wrong one is a costly architectural mistake.
The question is often framed as RDF versus labelled property graph, but that can make the decision feel more like a technology debate than an architectural one. The discussion needs to focus on the problem being solved: what kind of meaning needs to be captured, how much governance is needed, what queries need to be supported, and how the graph will be used over time.
RDF and OWL can be powerful when shared meaning, standards, interoperability and reasoning matter. But they also need discipline around identifiers, vocabularies, modelling choices and stewardship.
Property graphs can be easier to start with and are very effective for operational workloads and application development. But simplicity at the start can become a constraint later if provenance, integration or semantic consistency becomes central.
The choice should be contextual. The best graph is not the one that looks most elegant on a slide. It is the one the team can govern, query, explain and evolve.
Use RDF/OWL when the dominant problem is meaning, integration across organizational boundaries, formal reasoning, FAIR/linked-open-data publishing, or long-term governance.
Use a labeled property graph when the dominant problem is operational, multi-hop traversal performance on connected data, rich edge attributes and developer ease of adoption within a controlled application boundary.
When both axes are equal, use a hybrid store such as Amazon Neptune or Stardog - and budget for the conceptual overhead of maintaining two query surfaces.
That said, RDF 1.2's native edge-annotation support shifts this formula, weakening one of the historical reasons to reach for an LPG in the first place.
A useful read if you are designing a graph strategy, selecting tools or bridging semantic modelling with delivery.
By Jessica Talisman h/t Sergey Vasiliev
https://t.co/1amsvCtWGJ
#KnowledgeGraphs #RDF #PropertyGraphs #SemanticWeb #Ontology
--
📩 The Year of the Graph's Spring 2026 newsletter issue on all things #KnowledgeGraph, #GraphDB, Graph #Analytics / #DataScience / #AI and #SemTech is coming soon.
Subscribe and follow to be in the know. Reach out if you'd like to be featured 👇
https://t.co/7pg6gqWYvw
Wanted: Masterclass Instructors for #CDL26. 🛠️
At Connected Data London, we don’t just talk about the future - we build it. Our 2-hour Masterclasses are designed to give attendees practical, hands-on skills they can use in their daily work immediately.
We are looking for experts to lead deep-dive tutorials on:
Graph Engineering: Persistence strategies, triple stores vs LPGs, and scaling.
AI Implementation: Building GraphRAG pipelines, fine-tuning LLMs with KGs, or agentic workflows.
Data Modelling: Advanced ontology design, SHACL validation, and semantic layers.
Why lead a Masterclass?
Beyond the prestige of the CDL stage, you’ll have the opportunity to engage deeply with a technical audience hungry for real-world skills.
📝 Submit your Masterclass proposal: https://t.co/LYWPyNlfy1
#CDL26 #ConnectedData #KnowledgeGraphs #DataScience #AI #GraphDB #Masterclass #GraphDatabase #DataEngineering #AIWorkshops