In its Q1 2026 Gold Demand Trends report released last week, the World Gold Council highlighted continued strong central bank buying, with 244 tonnes purchased (+17% q/q and +3% y/y), valued at $38.2 billion (+38% q/q and +75% y/y). Global gold mine production fell 9% quarter-on-quarter (seasonally typical) but rose 2.4% year-over-year thanks to ramp-ups at Barrick’s Loulo-Gounkoto, Batu Hijau, and several Canadian mines; despite six straight years of record-high gold prices, annual production has grown at a sluggish 0.7% compound rate.
link: https://t.co/lrv90Lm9BS
Overall, this is structurally bullish for gold miners, primarily through sustained high gold prices and a tight supply backdrop, though the benefits are more pronounced for established producers with operational leverage than for the sector as a whole in the very short term.
Looking forward to seeing how valuations change in the coming weeks and months ahead...
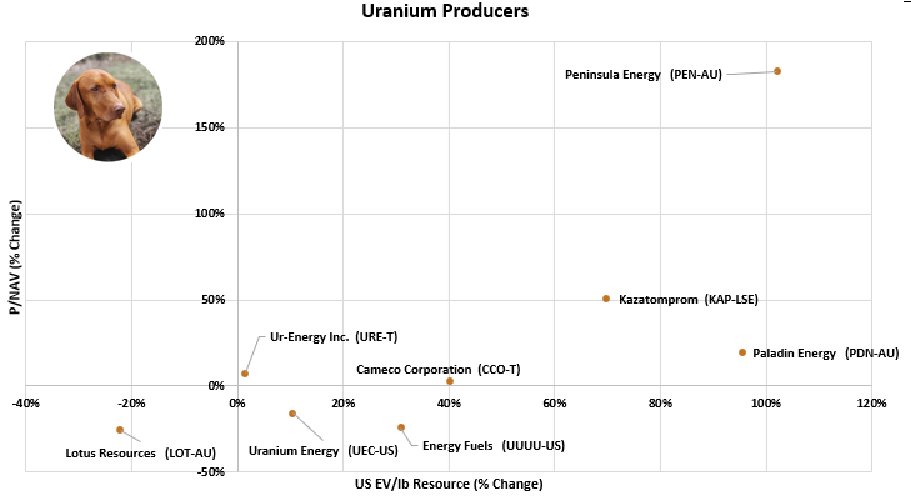
Since September 28, 2025, when we last looked at the sector, uranium producers have shown varied changes in valuation multiples.
Peninsula Energy (PEN-AU) recorded the largest increases, with P/NAV rising approximately 183% and EV/lb Resource up about 102%. Kazatomprom (KAP-LSE) also advanced, with gains of roughly 50% in P/NAV and 70% in EV/lb. Paladin Energy (PDN-AU) saw its EV/lb increase by around 110%, while its P/NAV rose more modestly. In contrast, Lotus Resources (LOT-AU) experienced declines of about 22% in EV/lb and 26% in P/NAV. Uranium Energy (UEC-US), Energy Fuels (UUUU-US), Cameco (CCO-T), and Ur-Energy (URE-T) showed mixed or relatively flat performance, with some modest EV/lb gains offset by stable or declining P/NAV.
The data indicates greater valuation expansion for companies with strong resource growth and development momentum. @PEN_Energy@Ur_Energy@Energy_Fuels@Paladin_Energy@cameconews
@Stock_Vixen Yes, once these results are reflected in quarterly reports, we should see companies with significant copper exposure benefit substantially.
The EV/CuEq lb valuations for 11 junior copper companiesrange from $0.01 (Caravel Minerals) to $0.70 (Develop Global), with a median of $0.05, signaling widespread undervaluation compared to historical averages (~$0.10–$0.20/lb) amid a bullish copper market ($4.50/lb, with $5+/lb forecast by 2026). Low valuations like Caravel, Faraday, and Solaris (≤$0.05) suggest high-upside M&A potential but carry exploration risks, while mid-tier names like Marimaca ($0.27) offer de-risked cash flow; investors should diversify across jurisdictions and monitor resource updates for catalysts, balancing geopolitical and funding risks.
From the end of Q4 2024 to the most recent quarter (MRQ), major precious metals companies experienced a remarkable strengthening of their balance sheets, largely fueled by record-high gold prices and robust free cash flow generation.
Agnico Eagle Mines Limited delivered the most dramatic turnaround, swinging from a net debt position of $512 million to a strong net cash position of $3,489 million. Barrick Gold Corporation followed closely, improving from $1,701 million in net debt to $2,050 million in net cash, while Kinross Gold Corporation achieved a significant reversal from $1,210 million in net debt to $1,349 million in net cash. Wheaton Precious Metals maintained its position among the sector’s strongest, with net cash rising from $1,170 million to $1,571 million. Mid-tier producers such as Alamos Gold, Pan American Silver, and Franco-Nevada also posted gains or remained in solid territory (though Franco-Nevada saw a decline from a high base while staying debt-free), and IAMGOLD reduced its net debt by $693 million. Only B2Gold experienced a modest widening of its small net debt position.
Overall, these substantial changes highlight disciplined capital allocation, aggressive debt repayment, and cash accumulation across the sector, significantly enhancing financial resilience and flexibility for future dividends, share buybacks, and growth opportunities.
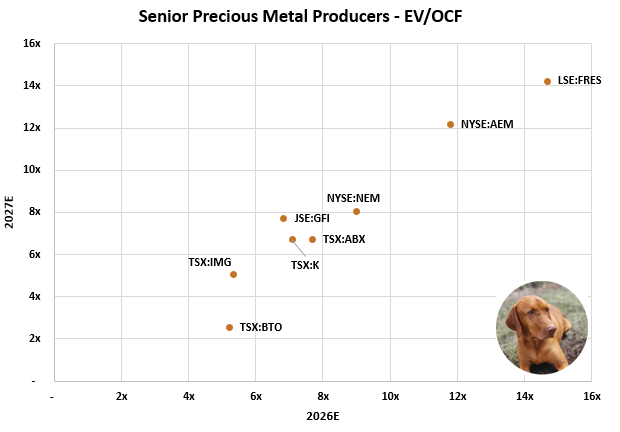
In early 2026, with gold trading near record levels, major gold miners trade at attractive forward EV/CF multiples, mostly between 7x and 9x on 2027E cash flow. B2Gold (BTO) stands out as the cheapest at just 3x in 2027E (down 50%), signaling strong expected cash flow growth. Mid-tiers like IMG and Kinross also look discounted at 5–7x, while seniors NEM and ABX sit at 7–8x. Premium names AEM (12x) and Fresnillo (14–15x) trade at the higher end. Overall, modest multiple compression reflects robust cash flow growth ahead, making the sector appear reasonably valued with BTO offering the most compelling value.
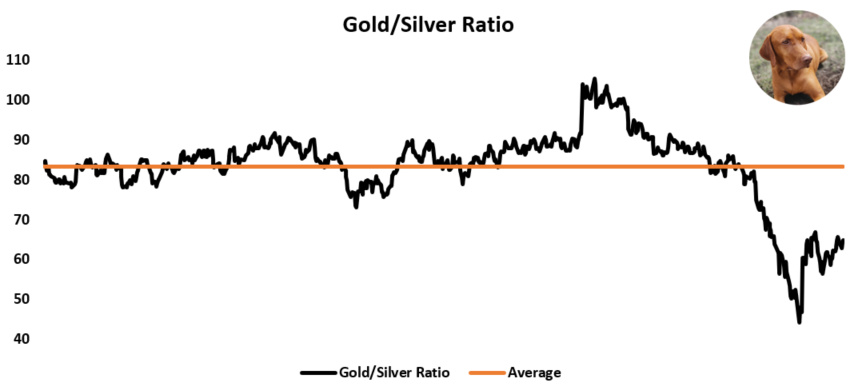
The gold/silver ratio currently stands at approximately 64.8, well below its 3-year average of around 83. This lower reading indicates that silver is outperforming gold on a relative basis, reflecting stronger industrial demand for silver (from solar, EVs, and electronics) and a maturing precious metals bull market where silver often accelerates in the later stages. For junior miners on the GDXJ, this setup is generally positive, as many miners carry significant silver exposure and tend to see leveraged gains when the ratio compresses.
On February 23, we reviewed YoY P/NAV valuation changes for GDXJ’s top ten publicly traded holdings. On an equal-weighted basis (via our proxy), the average multiple has expanded to 1.29x from 0.79x versus the same time last year.
We analyzed a dataset of 21 gold developers and explorers, focusing on their relative enterprise value (EV) per ounce in Canadian dollars. The average across the group came in at C$234/oz.
Formation Metals (CSE:FOMO), by contrast, boasts an EV of roughly C$25 million, with a historic resource of 855,000 ounces. The company plans to drill 30,000 meters to further validate the N2 Project and highlight its upside potential for a 3.0-million-ounce deposit...
Crunch the numbers and see for yourself how undervalued this truly is...
Our dataset of 30 base metal stocks (TSX, ASX, LSE, TSXV) are mostly trading closer to their 52-week highs than lows. On average, they need +32% to reach highs and -64% to hit lows. Compared to when we did this analysis in September last year (+17.5% to highs, -51.8% to lows), the sector has pulled back moderately but remains positioned toward the upper end of its recent range.
On February 23, we reviewed YoY P/NAV valuation changes for GDXJ’s top ten publicly traded holdings. On an equal-weighted basis (via our proxy), the average multiple has expanded to 1.29x from 0.79x versus the same time last year.
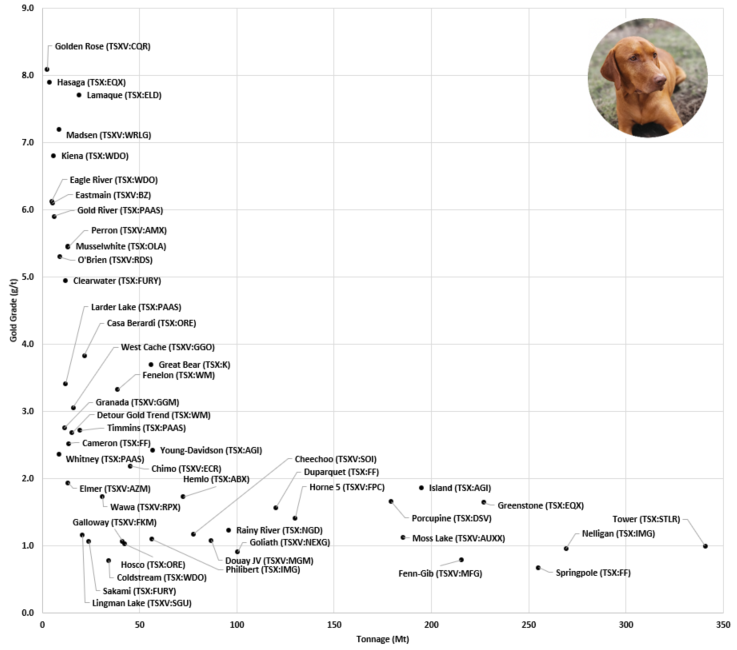
Considering all gold deposits in Quebec and Ontario listed on the TSX or TSXV that exceed 600 koz of gold (excluding major outliers), the average metrics per deposit are 69 million tonnes at 2.99 grams per tonne of gold for 3.4 million ounces.
Assets included in this analysis: Golden Rose (TSXV:CQR), Whitney (TSX:PAAS), Lingman Lake (TSXV:SGU), Sakami (TSX:FURY), Elmer (TSXV:AZM), Coldstream (TSX:WDO), Hasaga (TSX:EQX), Eagle River (TSX:WDO), Granada (TSXV:GGM), Eastmain (TSXV:BZ), Cameron (TSX:FF), Gold River (TSX:PAAS), Kiena (TSX:WDO), Detour Gold Trend (TSX:WM), Larder Lake (TSX:PAAS), Galloway (TSXV:FKM), O'Brien (TSXV:RDS), Hosco (TSX:ORE), West Cache (TSXV:GGO), Wawa (TSXV:RPX), Timmins (TSX:PAAS), Clearwater (TSX:FURY), Philibert (TSX:IMG), Madsen (TSXV:WRLG), Musselwhite (TSX:OLA), Perron (TSXV:AMX), Casa Berardi (TSX:ORE), Goliath (TSXV:NEXG), Cheechoo (TSXV:SOI), Douay JV (TSXV:MGM), Chimo (TSXV:ECR), Rainy River (TSX:NGD), Hemlo (TSX:ABX), Fenelon (TSX:WM), Young-Davidson (TSX:AGI), Lamaque (TSX:ELD), Fenn-Gib (TSXV:MFG), Springpole (TSX:FF), Horne 5 (TSXV:FPC), Duparquet (TSX:FF), Great Bear (TSX:K), Moss Lake (TSXV:AUXX), Nelligan (TSX:IMG), Porcupine (TSX:DSV), Tower (TSX:STLR), Island (TSX:AGI), and Greenstone (TSX:EQX)
The time we have all been waiting for... Gold prices have surged to a record high of $5,608 this month, driven by a weak US dollar (at 4-year lows amid Trump's tariff threats and Fed criticism), geopolitical tensions (US warnings against Iran), economic uncertainty (Fed holding rates amid inflation and fiscal worries), and strong demand from central banks, ETFs, and physical buyers.
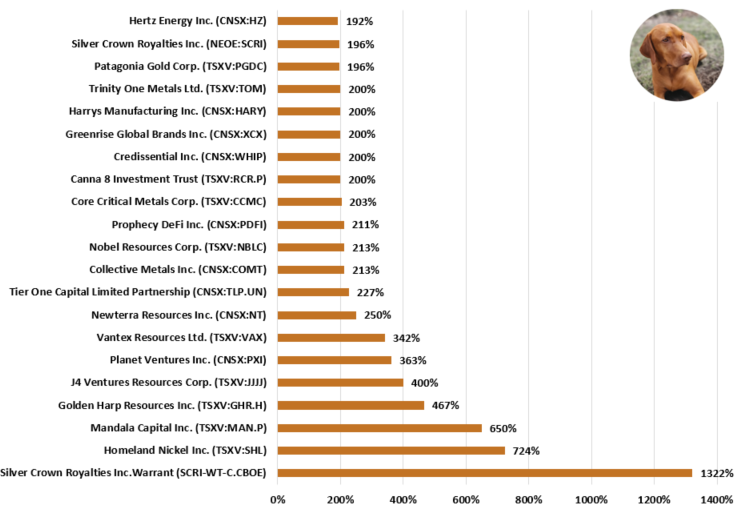
In Canadian stock markets, encompassing the TSX, TSXV, CBOE, and Canadian Securities Exchange (CNSX), a select group of tradable products stood out with exceptional gains. Out of a total of over 4,480 listed entities, here are the top 20 best performers, showcasing impressive percentage increases that highlight their market momentum:
With silver and gold hitting all time highs, some food for thought:
Above ground stockpiles of silver are estimated at 3-4 billion ounces. Gold? Roughly 2x silver at 7.5 billion ozs. We know 20mln Bitcoin has been "created" so far.
Suggests silver cloud hit $500/oz if it was valued the same as Bitcoin. Or more if valued as gold on account it being less readily available.
Interestingly, there is also less silver in the Earth's crust than there is gold (about 1/3 less). Kind of makes the whole silver pricing mechanism arbitrary ... and leaves a lot of potential upside even from these record levels, in my opinion ... Must be a reason I continue to add to my $SCRI position ;)