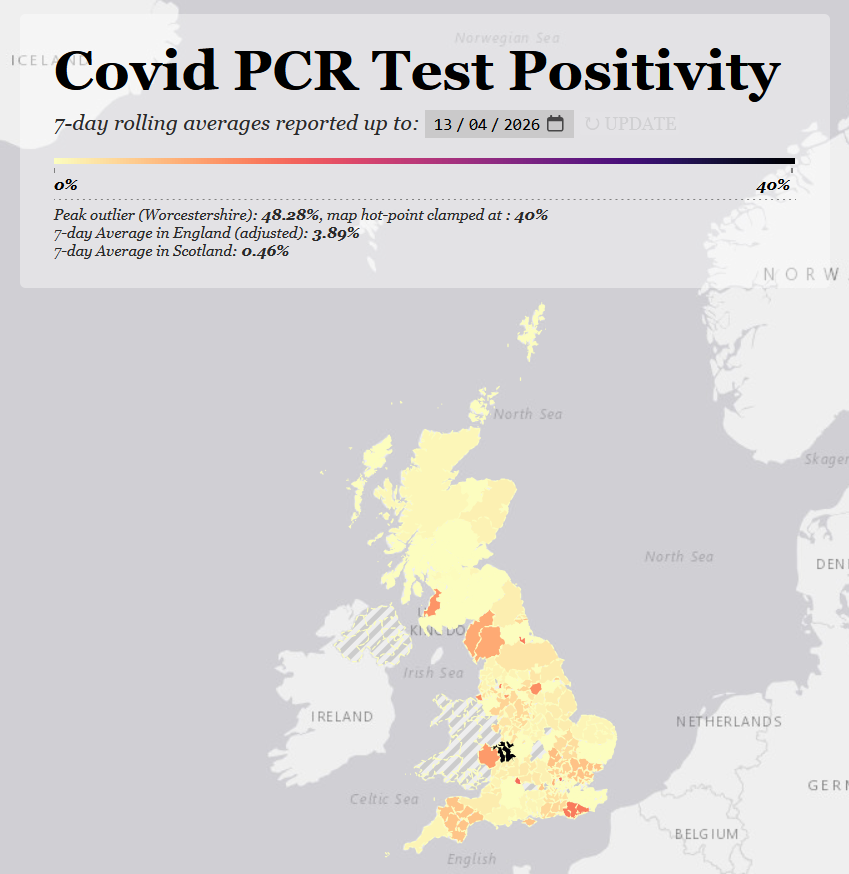
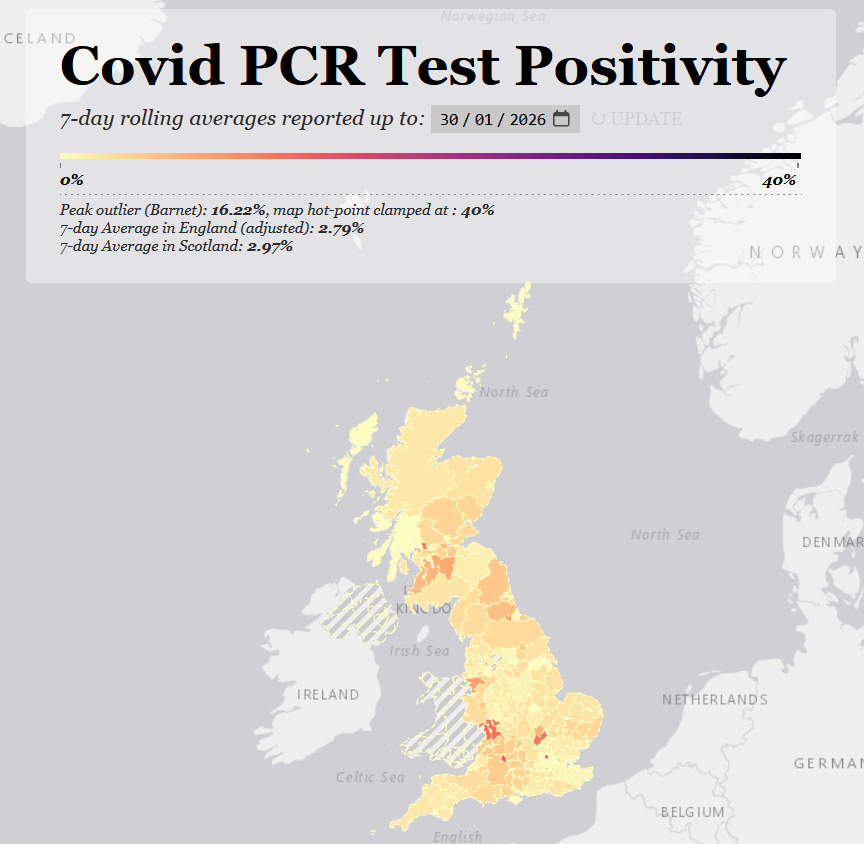
The PCR positivity map is out and this week we have data for Scotland, where reporting is a little more reliable than in much of England.
https://t.co/1phcyp7jth
1/4
The PCR positivity map is out, national positivity has barely shifted at 2%, and the hotspots aren't shifting either.
Most of these are around or slightly over 10%.
https://t.co/1phcyp7jth
1/5
The PCR positivity map is out and national levels have nudged up very slightly.
As the hotspots remain the same as last week, we can conjecture the rise is mostly a localized one.
https://t.co/1phcyp7jth
1/8
The PCR positivity map is out and levels are still pretty stable or declining.
This is the last week of winter NHS stats. There are 372 patients still in covid beds. The hospital trend is up in London and the SE, down elsewhere.
https://t.co/1phcyp7jth
1/8
The PCR positivity map is out, and positivity is the lowest it's been in 12 months.
With flu also down to near baseline, now is the lowest-risk period we've had in a very long time.
https://t.co/1phcyp7jth
1/5
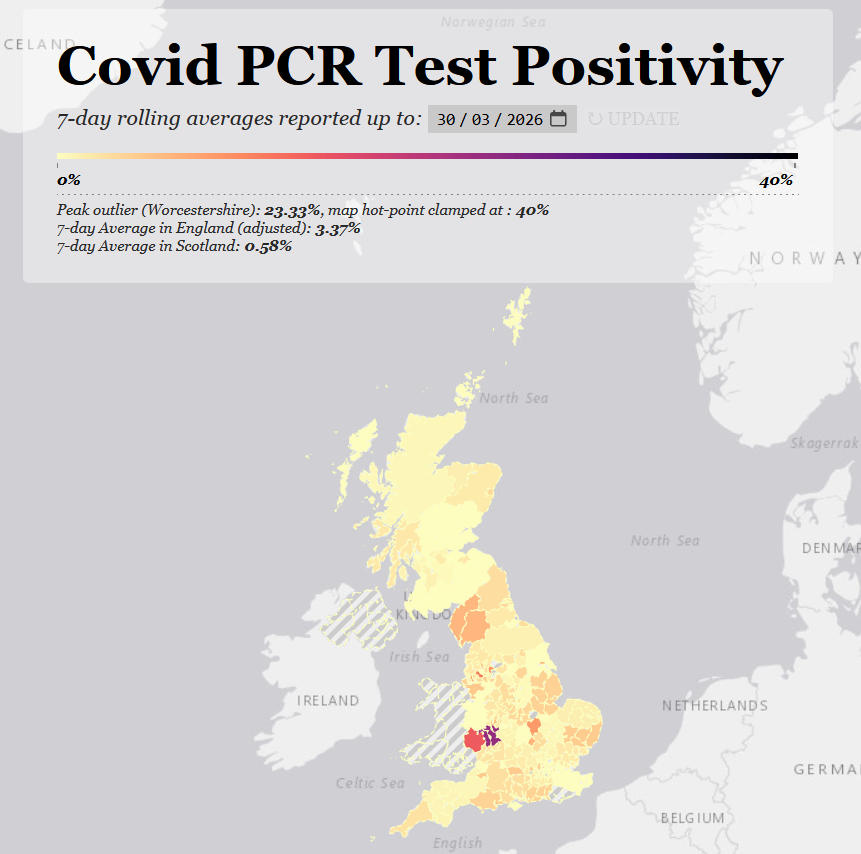
The PCR positivity map is out, and positivity is up slightly in England, down slightly in Scotland.
Hotspots haven't changed, but the levels in those hotspots have.
https://t.co/1phcyp7jth
1/6
The PCR positivity map is out, and there has been very little change since last week.
National positivity for England is at 2.79%, and at 2.97% for Scotland.
The areas of elevated positivity remain mostly the same.
https://t.co/1phcyp7jth
1/7