$ETH / $USDT Update
Thanks for coming. Massive green candle, just as expected. Closed the position for nearly $6K in profit. Now watching $BTC for a retest of the 94K–95K zone as another potential long opportunity.
$ETH / $USDT Update
$ETH could really take off if it breaks above 3,200, just like in early December when price rallied to 3,445.
The daily chart is showing very similar structure now: an initial rejection at the red Fib level followed by consolidation, setting up a potential strong move on a second breakout attempt, coupled with the same liquidity gap.
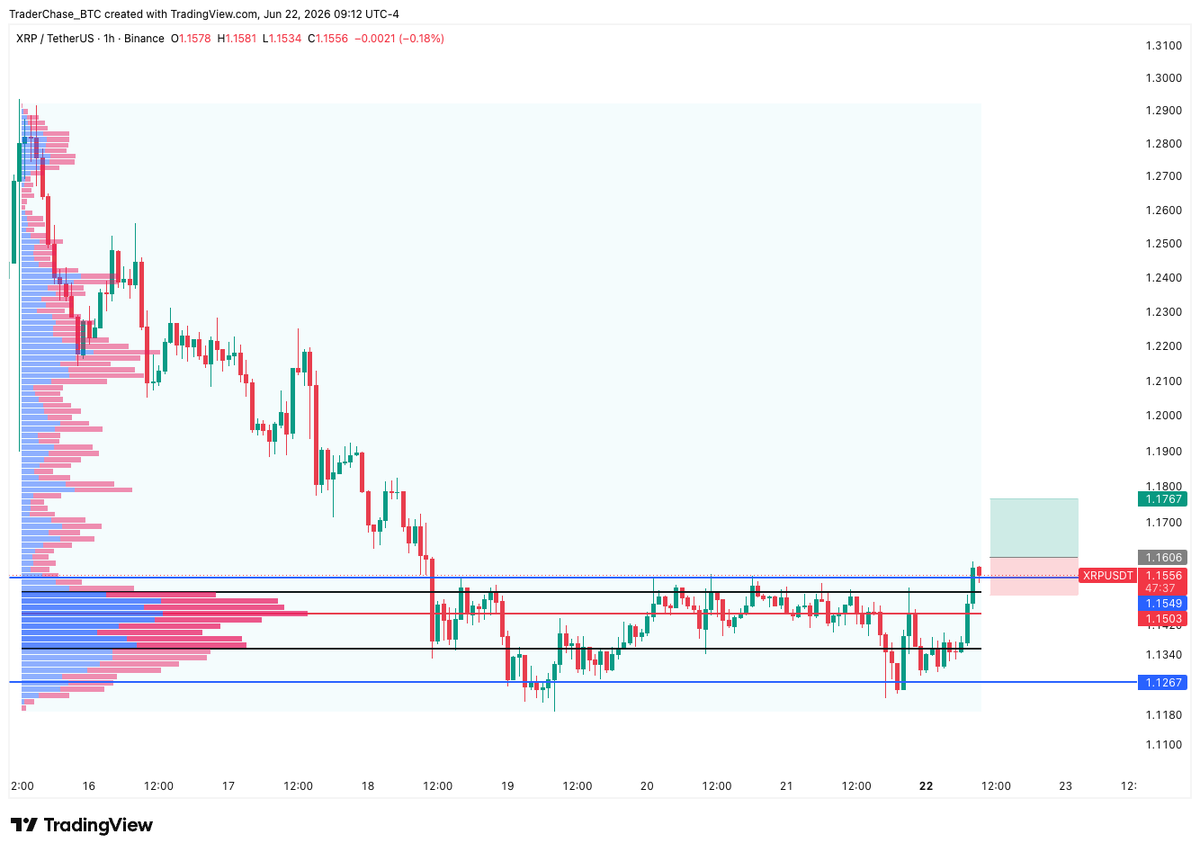
$XRP consolidating, just tested the top of the range.
Flip this resistance to support and it could really run especially with the massive liquidity gap above.
Trigger order is set above the previous local high at $1.1606
TP: $1.1767
SL: $1.1503
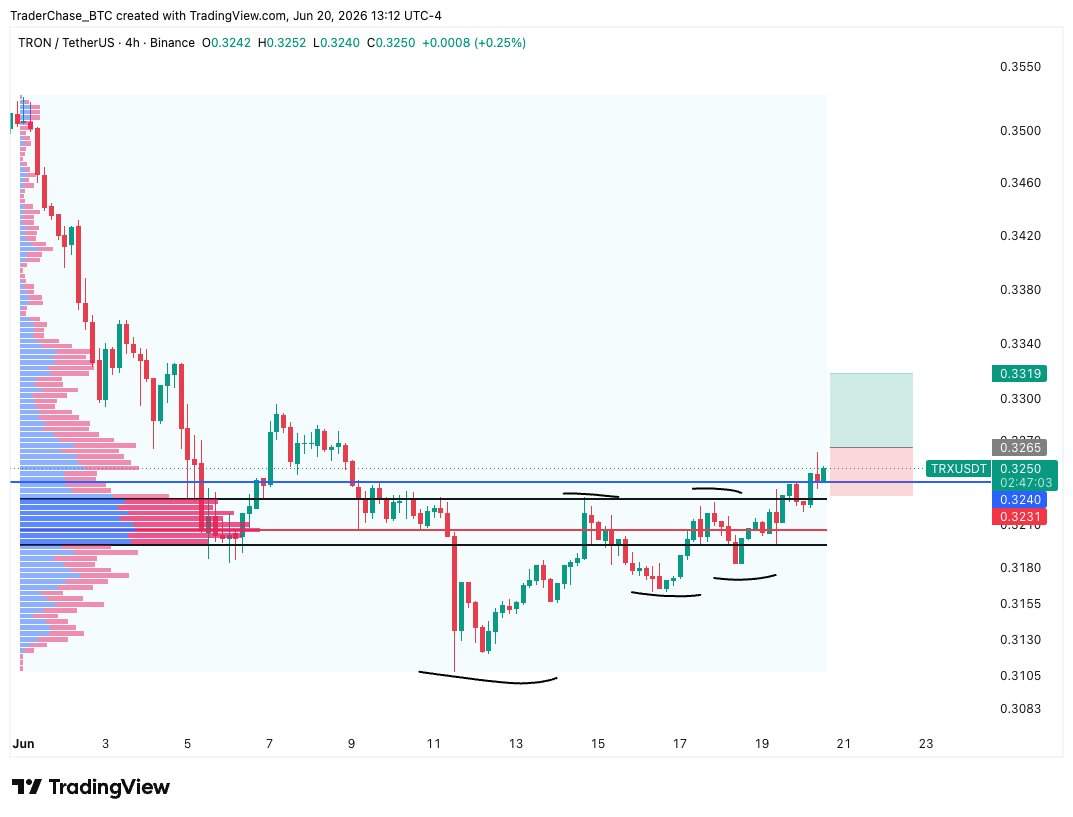
Everything lined up on this tron:native long.
✅Bullish structure, higher highs and higher lows
✅Resistance broken, retested, then expansion
✅Clear liquidity gap to fuel the run
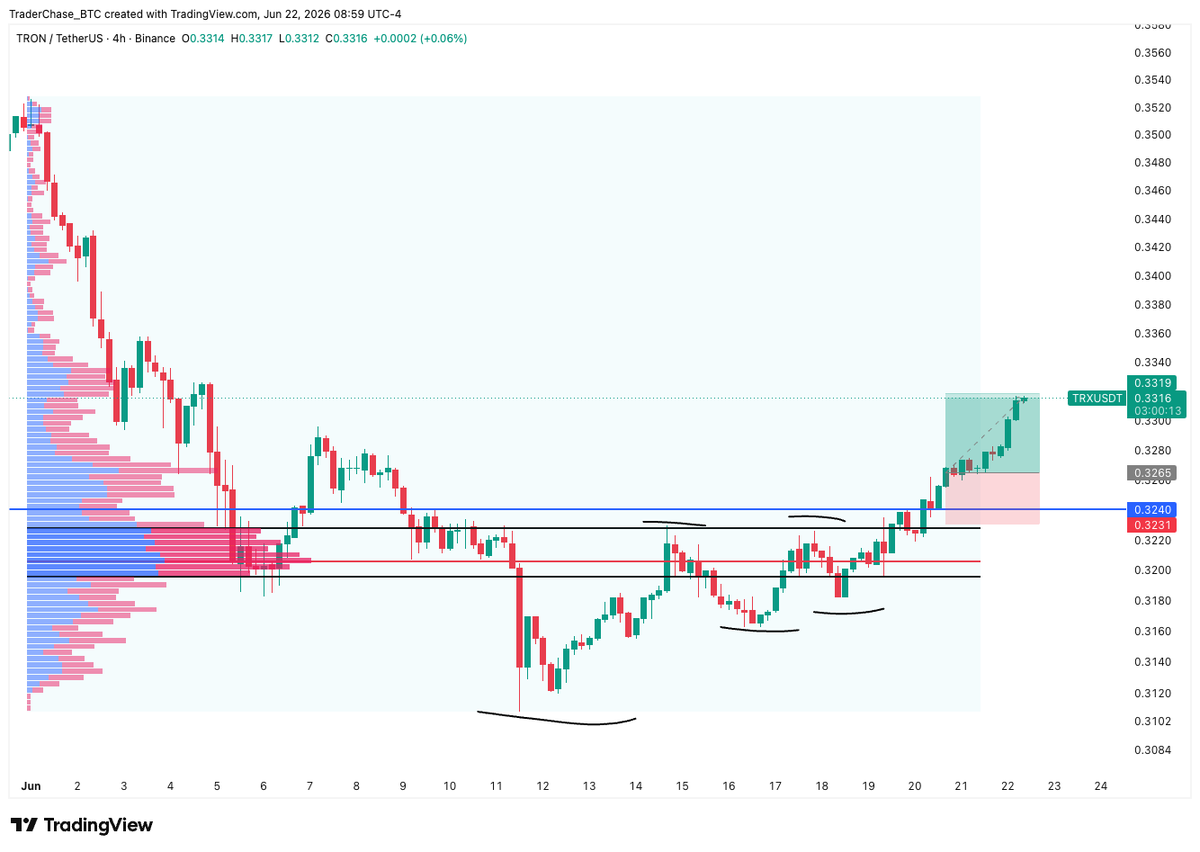
$TRX setting up for a strong move. Trigger order placed above the previous high at $0.3265. Higher highs and higher lows forming on the 4HR with a break of resistance.
Waiting on the trigger order, but this is what I'm thinking:
TP: $0.3319
SL: $0.3231
Just longed zcash:native here. We were seeing nothing but bearish market structure with lower lows and lower highs printing on the 4HR chart. That pattern has flipped and we're now in a consolidation period with a lot more upside than downside.
TP: $492.00
SL: $457.00
$TRX setting up for a strong move. Trigger order placed above the previous high at $0.3265. Higher highs and higher lows forming on the 4HR with a break of resistance.
Waiting on the trigger order, but this is what I'm thinking:
TP: $0.3319
SL: $0.3231
Shorted $BNB here. We're seeing a break from the bullish pattern of higher highs and higher lows, with a new lower high breaking the momentum. A shift in market structure like this usually leads to a sharp move down.
TP: $582.50
SL: $588.90
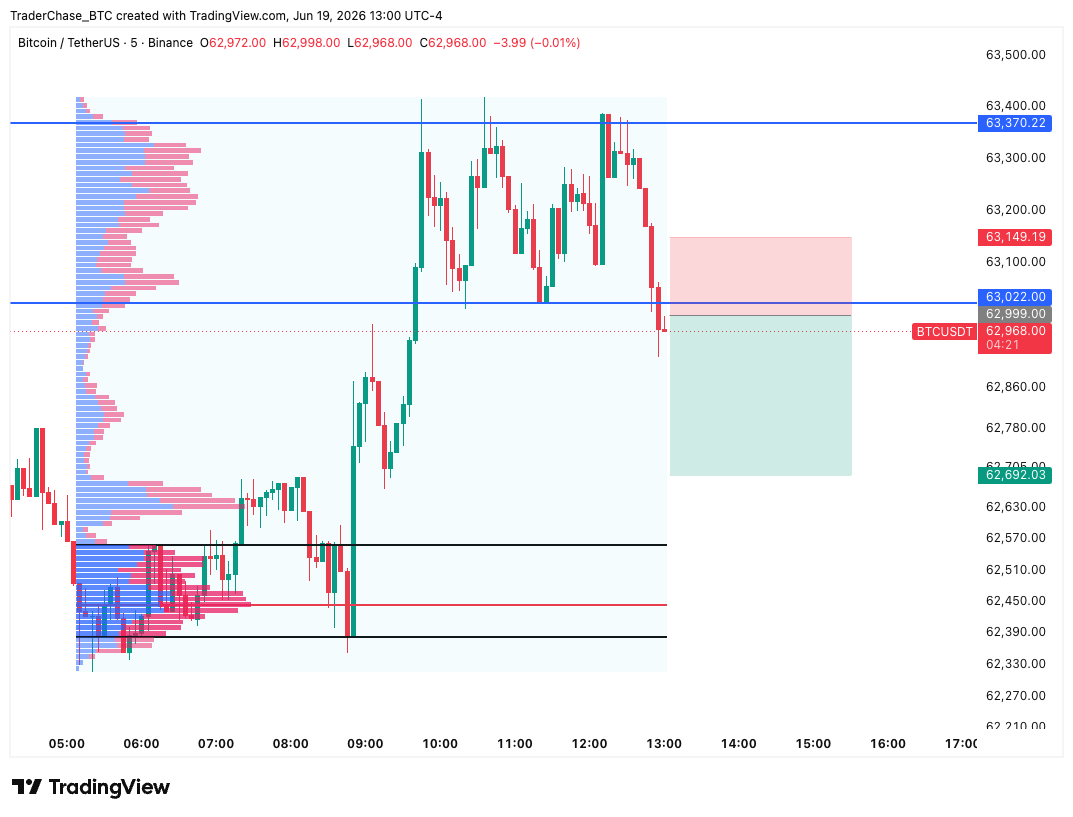
$BTC structure looking bullish on the lower timeframe. Higher highs, higher lows, pressing into resistance around $63,400.
Break above the prior high and I'm going long. Stop loss below the previous higher low around $62,970.
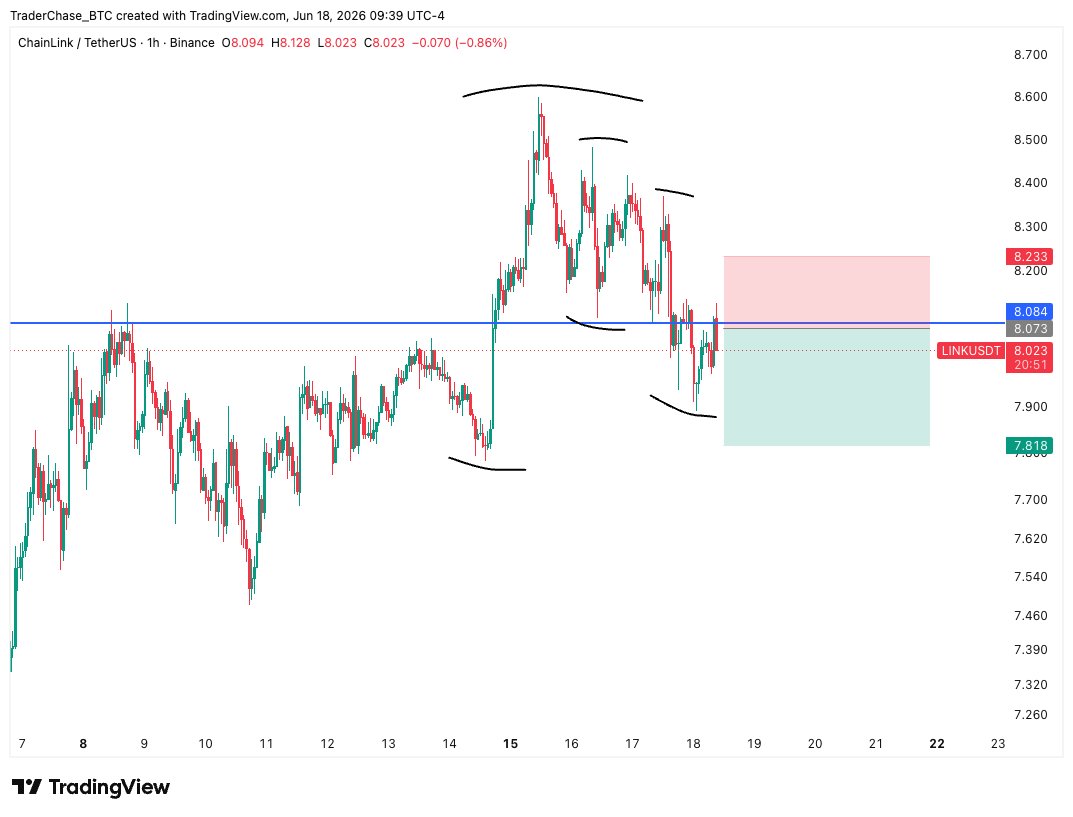
Perfect short here on $LINK. Following market structure is so crucial, and it's honestly one of the simplest trading strategies out there. Combine that with breaks of support and resistance and you've got profitable setups all day.
Just shorted $LINK. We're seeing lower highs and lower lows forming on the 1HR chart, coupled with a break of the support level. Only one way this can go in my opinion📉
TP: $7.818
SL: $8.233
Shorting $BTC here
Just saw a lower high print on the 1HR chart which breaks the bullish market structure of higher highs and higher lows.
TP: $63,400
SL: $67,500
Called it, just saying🤷
We’re heading to 50K. Don’t say I didn’t warn you.
Quick shoot ups from previous lows aren’t recovery. That’s how you get a major crash. You want consolidation, a real breakout of the lower highs and lower lows structure.
We haven’t seen that yet📉
Shorting $BTC again. This market structure looks brutal and it’s only a matter of time before this drops heavily in my opinion.
Target at 76,100
Stop loss at 85,150