1.5h later and $JASMY price is up by 3.5%. From here it's possible that price continues higher, but a further pull back to 0.045-0.047$ is also possible.
Taking profits and waiting to see what happens.
$JASMY just doesn't stop running. Hidden bearish on RSI/Stoch on 30min TF suggests a pull back soon. But doesn't mean that it won't go higher still. Monthly resistance at 0.046-0.047$.
$JASMY just doesn't stop running. Hidden bearish on RSI/Stoch on 30min TF suggests a pull back soon. But doesn't mean that it won't go higher still. Monthly resistance at 0.046-0.047$.
Going to enjoy the weekend and not looking at the charts at all. Seems to me that we're going to see some boring sideways action the coming days anyway.
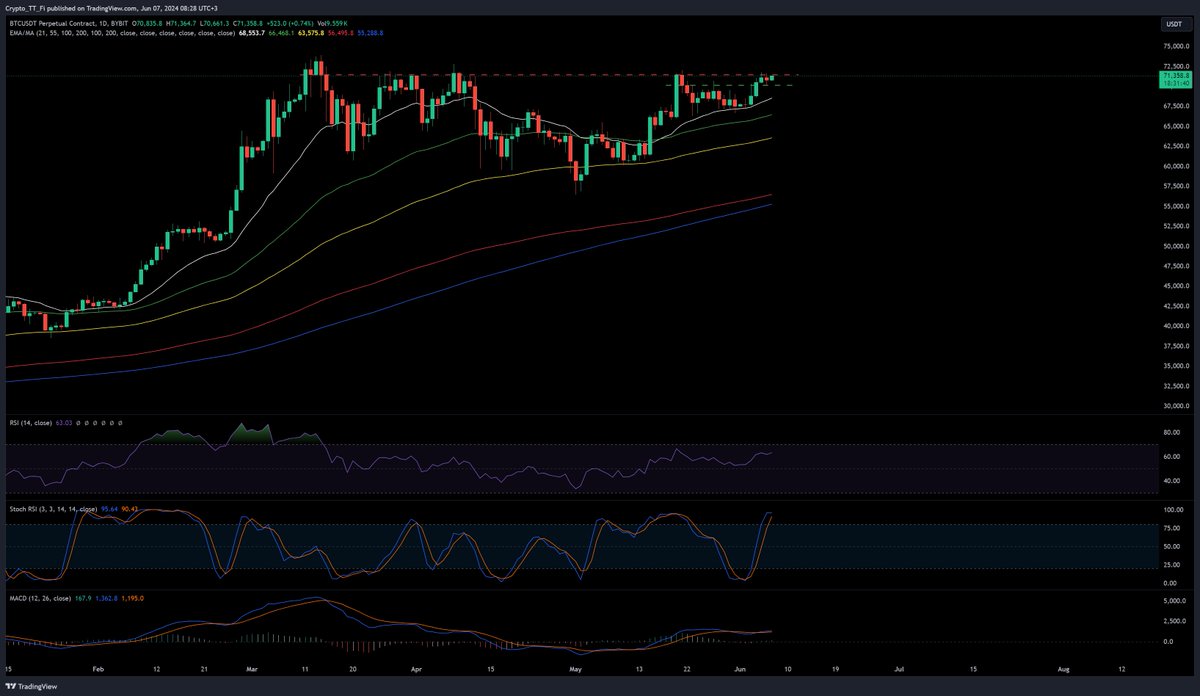
$BTC 66.8k is a major support and should be expected to hold the price.
The level at 65.8k could be hit as well, which coincides with 1d 21EMA.
After that the next major support is at 64.5k which happens to be where 1d 55EMA is at.
$BTC 66.8k is a major support and should be expected to hold the price.
The level at 65.8k could be hit as well, which coincides with 1d 21EMA.
After that the next major support is at 64.5k which happens to be where 1d 55EMA is at.
Nothing has changed excluding ETH related coins, which are pumping pre-ETF approval. Could be a buy the rumor sell the news event just like we had with BTC ETF.
Everything else seem to be in a downtrend on the short term.
Markets just turned bearish for me in the short term. Wanted to see some continuation of the bounce, but we're back down. Not looking for longs until some bullish sign present themselves on the lower time frames.
$RNDR going strong with a massive 4h candle, as anticipated. Retest of ATH seems inevitable if 11.7645$ is broken. $NVDA earnings most likely coming in hot pushing AI coins.
$RNDR doesn't seem bothered by the fact that the whole market just liquidated some longs. Holding 11.34$ should justify a run for the ATH. Let's see how the 4h closes.
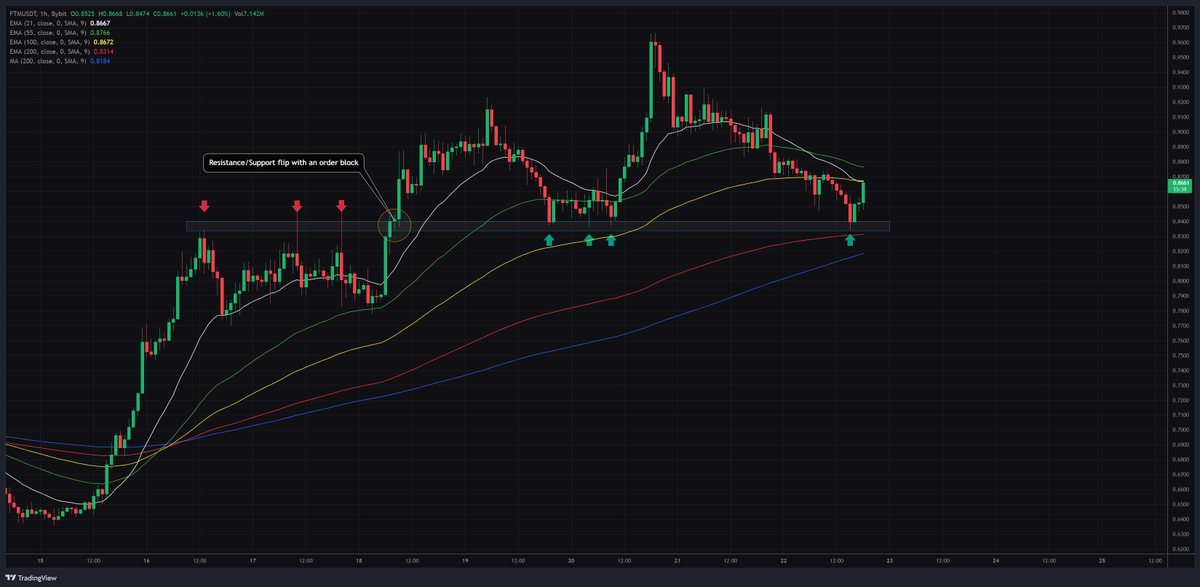
One of the easiest ways to make money trading, which requires a lot of patience and noticing the areas of interest, is using order blocks. In the image is an example for $FTM on the 1h timeframe.
Notice how red arrows represent resistance points, which now serve as a support zone
One of the easiest ways to make money trading, which requires a lot of patience and noticing the areas of interest, is using order blocks. In the image is an example for $FTM on the 1h timeframe.
Notice how red arrows represent resistance points, which now serve as a support zone
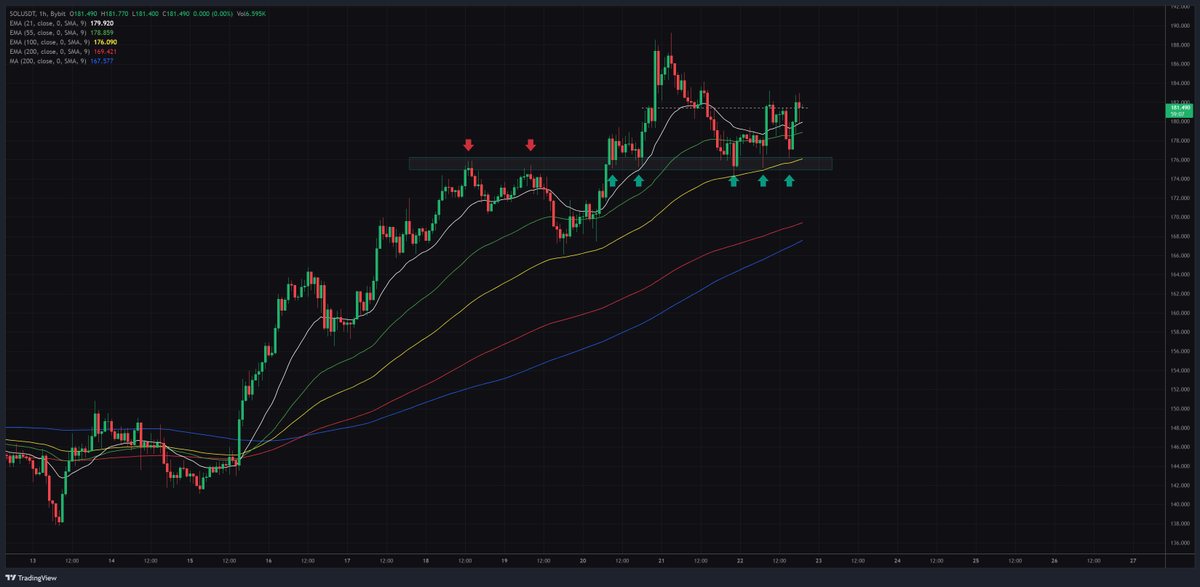
Opened a short on $SOL due to the fact that 50RSI was lost on 30min&1h as well as MACD flipping negative. Stoch is also moving to the bearish side. This isn't a fool proof signal, but price going down seems more probable atm.