“Ladies and gentlemen, this is your captain speaking… ✈️”
Please fasten your seatbelts, we have started landing our flight!
Turbulence ahead as per previous experience. So remain calm, stay seated, and enjoy the rest of the flight.
#Bitcoin#BTC#Crypto
PumpMarket mainnet is now LIVE
Predict weather or not any @Pumpfun token will graduate or not within an hour.
Profit if your prediction is correct.
This is just the beginning.
https://t.co/v2lUPplz9q
#Bitcoin – Special Weekly Report:
The Big Sunday Report: All We Need to Know
🚩 TA / LCA / Psychological Breakdown: Bitcoin is currently in Stage 4 out of 6 in the current bear market: These six stages are my own framework, developed through direct observation of every major Bitcoin bull and bear market so far. The structure repeats because the underlying drivers repeat: liquidity mechanics, leverage positioning, and predictable human behavior under stress and current panic.
Stage 1: Euphoric market and insane buying appetite:
This is what happened between 115k and 125k. The first stage mainly ends with extended sideways movement at euphoric levels, often biased in one direction, or with sudden spikes to the upside after a long consolidation despite extreme bullish sentiment. On the surface, everything looks strong, but in reality the market is overloaded and overleveraged, with late entrants who believe risk has disappeared. Insane price predictions happen here, and people reach the highest level of greed.
Stage 2: Breakdown of a highly important psychological level:
This stage begins once we drop below an important psychological mark, which in this cycle was 100k. The psychological level is extremely important because its loss stresses short-term investors and flushes out leverage traders, giving them the first warning signs that their euphoric dream from Stage 1 is over. The speed of the second move is noticeable and intentional. It happens very quickly and does not allow investors to rethink, recalculate, or properly manage their positions. The market acts before they can react. It front-runs them, and many lose control here. The best example was the fast crash on the 10th of October, which caused the largest liquidation event in crypto history. It happened within a few hours.
Stage 3: The fastest and most brutal move + bear market confirmation:
After Stage 2, the market needs to move even faster. Market makers cannot allow retail to realize what is happening; the speed needs to be maintained, so an even more brutal downside move follows. Stage 3 is the fastest of all phases and fully confirms the bear market with an extreme and rapid downside move, typically exceeding a 50% drawdown from the all-time high, which has been the case. In this scenario, investors are in deep depression and strong panic. They had no time to recalculate, hedge correctly, or reduce leverage. They are sitting on losses they never prepared for. I consider Stage 3 the most brutal phase of a bear market. It happens very fast and removes reaction time. The move from 97k in January to 60k in February, a crash of 50% within only 30 days, reflects that brutality. Many have not realized that nearly 50% of BTC’s market cap was wiped out within 30 days. The most violent mechanical repricing is likely behind us, and we have now entered Stage 4, which brings retail into psychological torture.
Stage 4: Dehydration, depression, and perfect liquidity creation:
This is where we are now. Stage 4 is not very violent or volatile, but it is extremely exhausting. The price moves sideways for a long period, often several months, within its own defined region. This is why I defined the current sideways structure and drew the “box,” showing clear upside and downside boundaries. You could also describe this as a weak-hands selling zone. A sideways move allows market makers to generate liquidity on both the upside and downside by trapping breakout traders and breakdown sellers. Sideways does not mean nothing is happening in the market, that is what retail sees when markets move sideways for a long time, but the message is much bigger. It means the market is preparing to exhaust participants fully while creating a large cluster of liquidity below the current zone, an area defined as the future capitulation region. This phase creates dehydration, frustration, regret, and anxiety. Retail traders start saying, “Bitcoin will drop another 30–40%; it’s better to sell here.” Many think the same way. Most short-term holder capitulation happens in Stage 4. Retail traders exit here because they missed selling in Stage 1, failed to sell in Stage 2, and had no time to react in Stage 3. Now they sell at a loss, as on-chain data confirms. Based on the data I see, the breakdown below the box that will bring us into Stage 5 is more likely to happen in a few months, not in the coming weeks. For the short term, I have placed buy orders between 57–60k within the current sideways structure and expect a bounce in the short to mid term. This does not change my broader outlook of lower targets.
Stage 5: Total fear, drama, and capitulation:
This is the true capitulation phase. It is not always the fastest move, but it is the most emotional one. Fear turns into panic, and panic turns into forced selling, even among experienced long-term holders. This stage is often connected with the collapse of a large player, an exchange failure, or a black swan event. It is remarkable to see panic selling after an asset is already down 50–70% from its all-time high, yet this phenomenon repeats every cycle. Originally, I projected the bottom between 50–60k when BTC was trading at 120k. In January, I adjusted this to 40–50k. With current macro data and visible stress in global markets, including the REPO and liquidity markets, I now consider 35–45k as the ultimate bottom scenario. That implies another significant downside from current levels, where the final capitulation is likely to play out.
Stage 6: Stabilization and structural reversal:
This final stage is a mix of total fear, volatility, and continued sideways movement. Selling pressure gradually disappears, and the market begins building the foundation for the next bullish cycle. Structurally, market makers prepare for recovery. This is the moment when large players begin accumulating heavily during capitulation, while retail investors scream for lower and lower prices, calling for extreme targets such as 10k or below. Retail becomes greedy again for lower prices and ultimately misses the bottom, a perfect repeat of every cycle in which retail investors buy high and sell low.
Right now, we are in Stage 4. The worst in terms of high-speed mechanical downside is likely behind us, but the real psychological damage phase has just begun. Regret increases. People rethink their decisions. They calculate exit plans that come too late. This is the reason why we have seen the largest short-term holder capitulation in the last few days. The key lesson remains simple: never let the market trade you; you trade the market. When price moves fast, reaction time disappears. When price moves slowly, discipline disappears. Understanding these stages allows you to operate structurally rather than emotionally. My heavy accumulation will begin between Stage 5 and Stage 6, not before. This pattern has repeated across every Bitcoin cycle so far. Human behavior is an architecture repeating under different market conditions, but the architecture itself always remains the same.
Join Premium: https://t.co/oSzGvO03RF
Join Free TG channel: https://t.co/zkdgaR6H3c
THIS IS NO FINANCIAL ADVICE AND EDUCATIONAL CONTENT ONLY
Bitcoin bear market drawdowns have a clear pattern:
2011: -93%
2015: -86%
2018: -84%
2022: -77%
Every cycle, the drawdown gets smaller as the market matures.
Following this trend, the 2026 bottom should be around -70% from the $126K ATH. That puts us at $38K.
Good luck buying your bottom at $69K, $60K and $50K. I’ll see you at $38K.
AI will make you jobless.
Crypto will make you not need a job.
Buy and hold now, retire in a few years. 🙋♂️if crypto allowed you to retire already.
(Not financial advice)
#Bitcoin/ Stock market – What’s Next?
The Big Sunday Report: All You Need to Know:
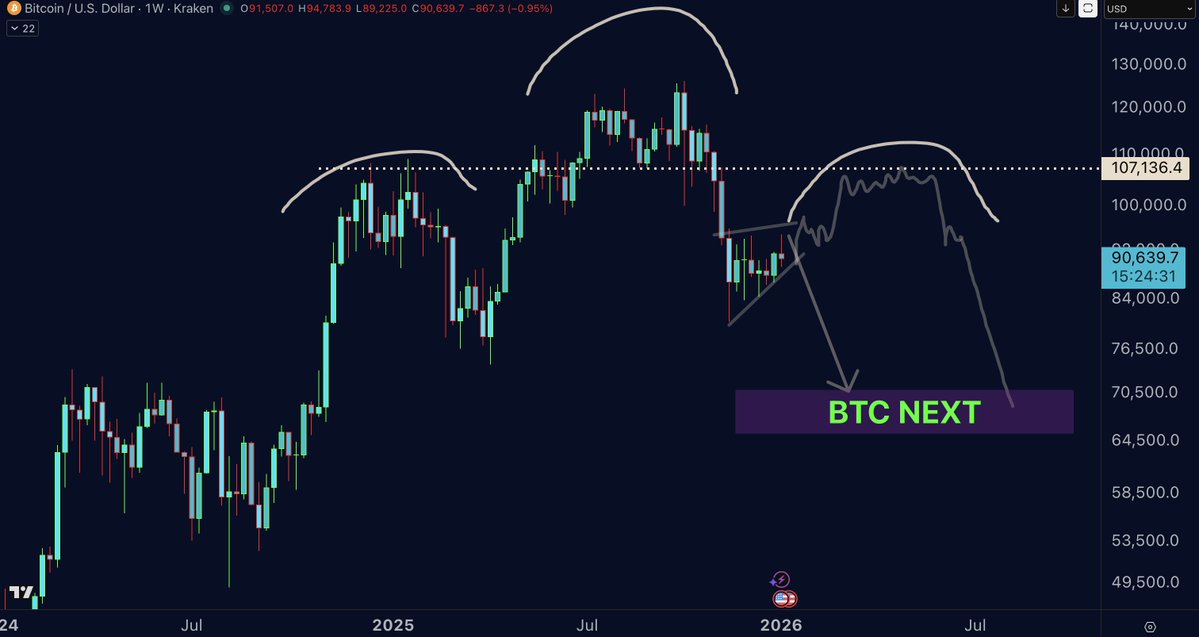
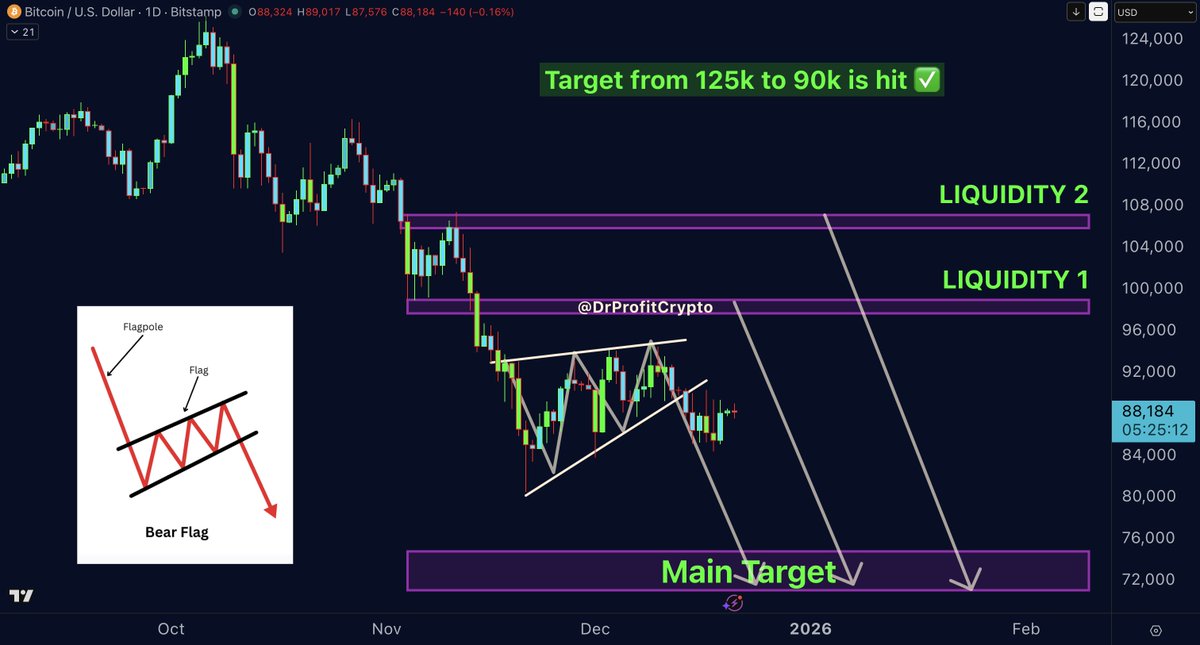
🚩 TA / LCA / Psychological Breakdown: Bitcoin is forming three major bearish setups at the same time. The first is a massive bearish divergence already active on the weekly and monthly charts. The second is a clear bearish flag pointing directly toward the 70k region. The third is a potential head-and-shoulders structure that is still very much in play. A push into 97–107k is not off the table because there is heavy liquidity resting there, but make no mistake: 70k BTC is a matter of time! The set up for the target of 70k is yet 50:50 in terms of probabilities. It can either break out from the bearish flag towards 70k region straight, or complete the Head and Shoulders pattern first before going to 70k next. Thats the only uncertainty but the destination is the same of 70k!
My next major target is 70k. Does that mean I’m adding shorts here? Absolutely not. The only area where I will add aggressively to my existing shorts from 115–125k is on an upside move into the 97–107k zone. As mentioned last week, the set up remains active and there are no changes.
At the same time, insiders are selling at maximum speed. Since August the market is seeing massive amounts of insider sales, I am following this Data since more than a year and havent seen this size of insider sales ever before, starting from August 2025 till this date. This week there was no change as well, insiders speak one language and thats selling only! I’ve called these moves accurately before, and I am fully convinced that a 2008-style crash is approaching. The entire system is under pressure, banks are stressed, and silver is forcing liquidations one after another. Ask yourself why banks are suddenly borrowing more and more just to cover silver exposure. This is not normal behavior
We are living in extreme times, and once again what I warned about is playing out. Most people ignore fundamentals until it’s too late, but the market right now is structurally bearish and can break at any moment. I am bullish only on gold and silver, ultra-bearish on stocks and Bitcoin, and positioned with large shorts from between 115-125k. If the market gives me 97–107k, I will add more serious size to shorts, and I will also close the spot position from 85k and roll those profits straight into the short side.
This week on Tuesday we will see CPI Inflation data, forecasted at 2,7%. Otherwise nothing more interesting to happen this week. January 15 matters because U.S. lawmakers vote that day on the CLARITY Act, a law that decides how crypto is regulated. If it passes, it moves one big step closer to becoming real law. This would finally make clear who controls crypto and what rules apply. Markets watch this day closely because clarity = confidence and more big money entering if positive result, in case of a negative result expect the next leg down. No matter what the result will be it wont change the mid - big BTC picture that is and reamains bearish!
Join premium here: https://t.co/4ilNrRs1q2
THIS IS NO FINANCIAL ADVICE AND EDUCATIONAL CONTENT ONLY
The #BTC chart we all need to know:
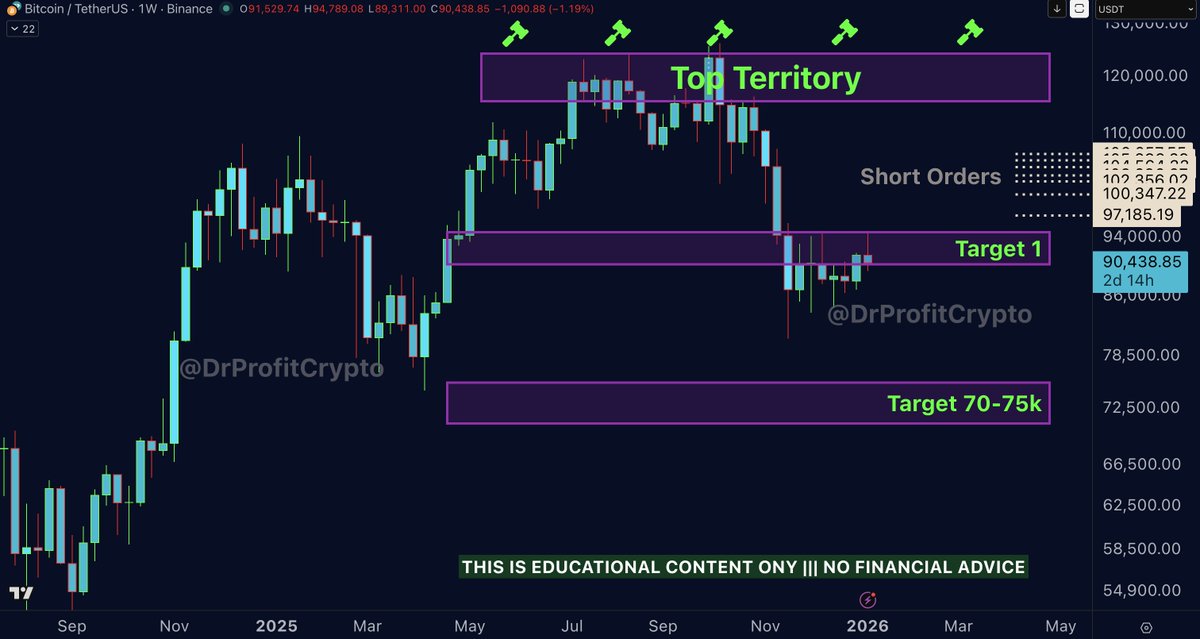
In August 2025 I started to prepare my short orders between 115-125k that triggered in September - October. After the big move that lead us to target 1 at 80k I said its time to expect some sideway moves in the same region. Since 7 weeks we are moving in the same region exactly as predicted two months ago.
We are now targeting the 70–75k zone as the next major objective. Does it mean I would add more short at the current region? HELL NO! The only area where I’m willing to add aggressively to the existing short from 115-125k is on a up move into 97k–107k. Any move into that region is an opportunity to increase size with real size.
So in Summary its very simple:
- Keep shorts open from 115-125k
- Placing short orders from 97-107k
- Having a BTC spot position open from 85k
- BTC spot position SL is set at entry area
- Next target is BTC at 70k region, bearish
#Bitcoin/ Stock market – What’s Next?
The Big Sunday Report: All You Need to Know
🚩 TA / LCA / Psychological Breakdown:
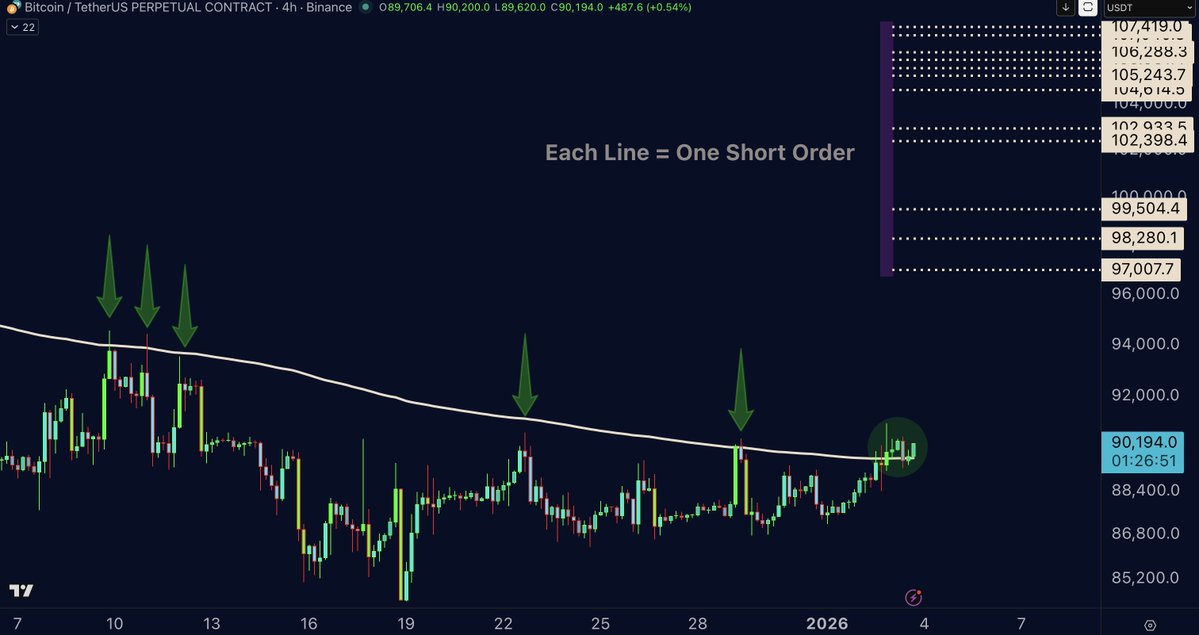
This is an early Sunday report, published on Saturday due to the current market movement and a very important development. For the first time in a month, BTC is breaking out above the Silver Line, which was rejected in the last five attempts, now with a clear retest and bullish confirmation. What does this mean? It means that Bitcoin has managed to defeat the bears at this short-term resistance, giving a clear signal that it is ready to move further. This is what I have been waiting for over the past two months. After hitting my target of 80k, I clearly stated that targets of 97–107k were not off the table before continuing the downside move, and that I was buying spot at 85k, looking to sell between 97–107k. Now it looks like the market wants to make this move. For this reason, I am placing several short orders between 97–107k, where each line represents one short order. For example, if my trading capital is 10k, I divide it into 12 parts and place each order with its respective size. This is how I always trade to catch the absolute best average price for shorts.
At the same time, I keep the shorts from 115–125k fully open, as the placed short orders are important preparations in case the market allows us to visit these levels. Remember that I remain fully bearish on this market and am targeting levels below 70k in the coming months.
Something that supports my bearish narrative is the fact that on New Year’s Day, the FED lent $106bn in overnight repo operations to banks. The question is: why? Why such a large amount? The more important answer is that the FED changed the lending rules in September 2025, on the same day as the FOMC press release, likely to avoid too much attention on the new rule. Back then, the standing repo had a daily limit of $500bn to be lent, meaning it would be returned within a day or two to the FED. Now its a total cap for all banks combined, up to $240bn per single bank, which is a major red flag that screams one thing very clearly: the system is under far more stress than most people are willing to admit. In simple terms, the Fed is preparing for situations where multiple large institutions may need massive liquidity at the same time, and they are making sure there is no chaos when that moment arrives. And history showed us, the moment when Banks been in pressure, needed help or been sitting at extreme low liquidity, the markets didnt like it at all and we saw a bear market. This is the current scenario. This is exactly what I predicted in August when I turned bearish, calling it by name: a repo and liquidity crisis. Now, on New Year’s Day, we saw the largest amount ever lent: $106 BILLION US DOLLARS! AGAIN $106bn!!!! That is something that should have shaken the markets, yet the markets did not seem to react.
At the same time, insiders continue to sell at maximum speed. I have been able to predict these events very accurately, and I am more than confident that a 2008-style crash will repeat in the near future. The entire market is putting pressure on banks, while silver is liquidating and applying stress to one bank after another. Is this the reason banks are borrowing more and more money to cover their short positions in silver? These are crazy times we are living in, and congratulations to everyone who trusted my words, as what I predicted and shared has once again come true. Many people ignore these fundamental signs, but the market is extremely bearish and could crash at any moment. I am bullish only on gold and silver, ultra-bearish on stocks and BTC, and opening large shorts across almost all of them. If the market allows a move into the 97–107k region, I will add a significant amount of capital to shorts. On top of that, I will realize the spot position from 85k and add those profits to the short positions as well. That is exactly what I am going to do.
Join free TG: https://t.co/zkdgaR6H3c
Join premium here: https://t.co/4ilNrRrtAu
.
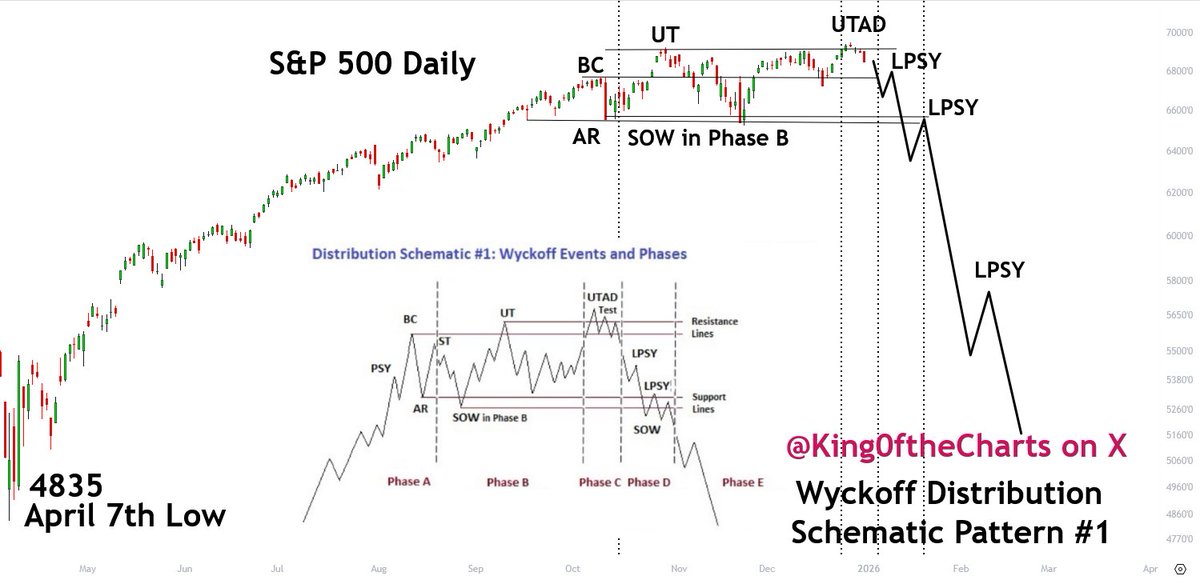
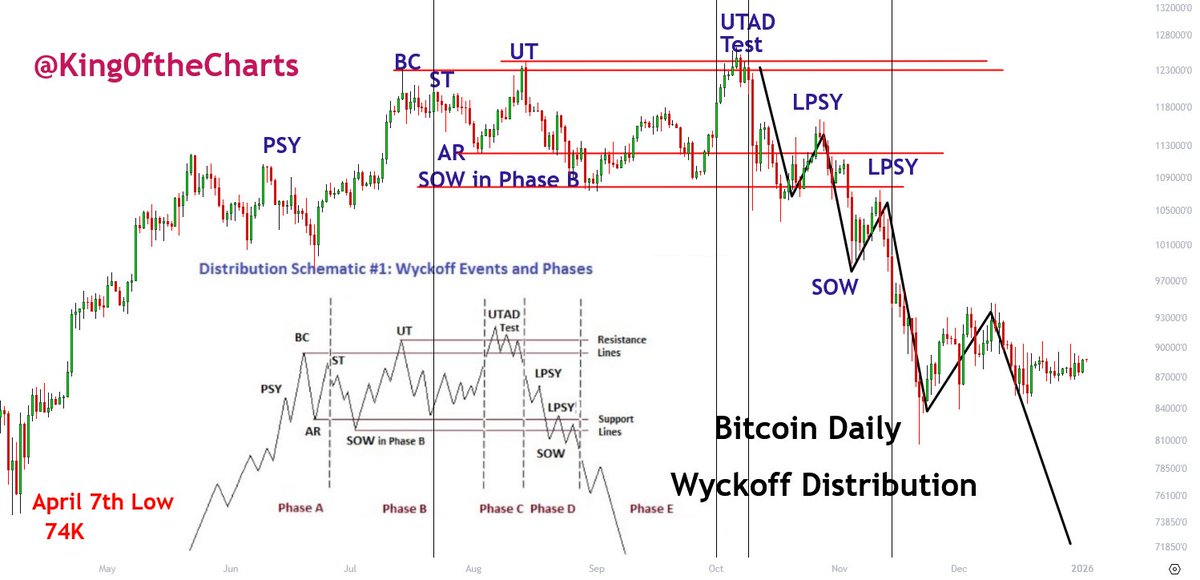
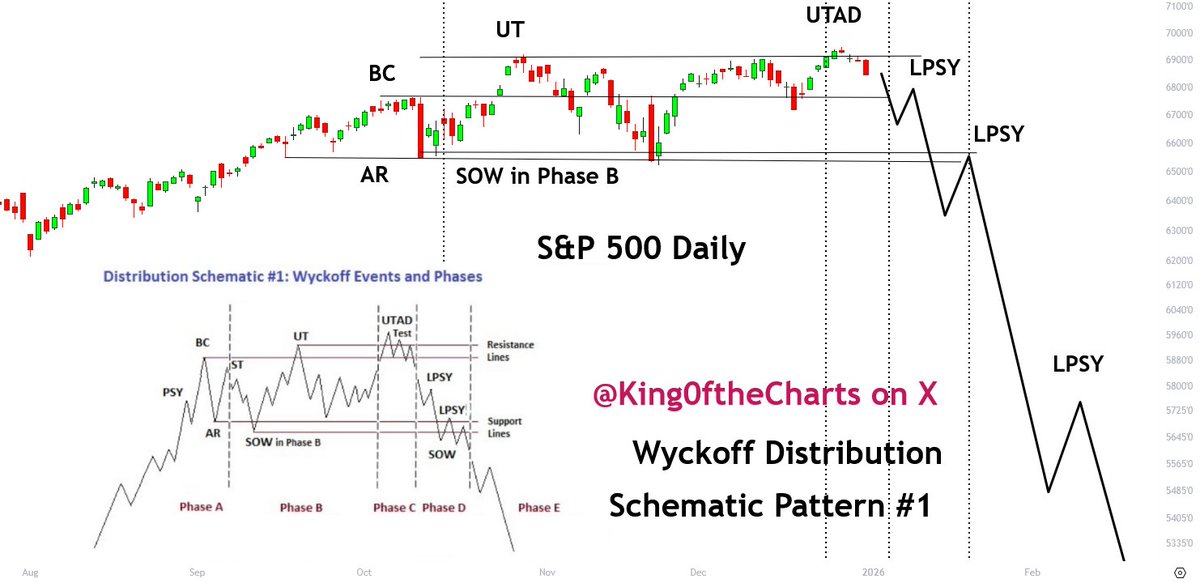
As I spoke about last week and earlier this week, every since Christmas Eve, when the S&P 500 broke to a new ATH, that the S&P 500is forming the exact same topping pattern that Bitcoin formed, the Wyckoff Distribution Top, Schematic Pattern #1.
As BTC starts it's next leg down to finish the pattern and likely move much lower than the April 7th low, the S&P 500 and the NASDAQ 100 will play catch up. SPX should start the distribution pattern
$SPX $SPY #SP500 $BTC #BTC #Bitcoin $QQQ $NDX
.
Today is December 27, 2025 and it is still a bad day to be bullish on Bitcoin.
If you think BTC CRASH is over, you're wrong.
If you think BTC will make new highs in 2026, you're wrong.
If you think the BTC bottom was at $80K, you're wrong.
BTC will soon drop below my next target at $74K.
The experts predicted Bitcoin would be at $200K to $250K by the end of the year and BTC is at $87K today. All the experts were wrong and my signals got it right, calling the day of the top and predicting this CRASH.
The CRASH isn't over yet and BTC is going to get another leg down before it gets a tradable bottom which will be followed by a massive relief rally. Again, I continue to predict that BTC will drop 40% to 50%+ by January, that will be followed by a massive bear market rally in early 2026, likely into March or April.
.
#BTC #BTCNews #Bitcoin $BTCUSD #BTCUSD #TomLee #CryptoNews #crypto #trump #ALTSEASON $BTC_F $NVDA $AAPL $MARA $MSTR #BitcoinCrash $NVDA $IBIT #ETH $ETH #Ethereum
#Bitcoin – What’s Next?
The Big Sunday Report: All You Need to Know:
🚩 TA / LCA / Psychological Breakdown: Bitcoin has been in a bear market since September, and nothing has changed since then. I said in September that we would not bottom in 2–3 months, not in 4–5 months, no. It will take at least 12–14 months to fully bottom out, with a price target in the 60k region for BTC, which is going to happen. As always, people tend to believe that markets will react or move fast, not understanding the importance of liquidity formation and that’s why time matters in such a price movement. Regarding this, I believe that BTC will see an upside move toward the 97–107k region in the coming weeks. I don’t even believe that any big downside move will happen before February, March 2026. This is why I am saying we will stay in a long sideways range for the next couple of weeks until the final leg down starts. I have been saying this since November, stating that BTC entered a phase of sideways movement, whose entire goal is to create more liquidity on the downside. That’s why it takes time, and this means a couple of months. It’s hard for many people to understand, as many expect fast moves or moves straight to the target, but that’s not how markets work.
For this reason, I am bullish in the short term and have bought BTC, but my short stays open and is not closed at all. This means the market allows me to operate more flexibly by keeping the short open, which can now act as a perfect hedge, while using capital in reserve to buy more BTC and sell later with a 20% price increase once we reach the target of the 97–107k region. This is the exact plan as of now, and I am expecting a slow rise as well, continued with a lot of manipulation to exhaust as many people as possible. Imagine the following scenario: the same repeat of what we saw in the last 6 months, again for another 12 months. How many will be able to buy the bottom? How many will be psychologically able to buy the bottom in a year? How many will be psychologically defeated? And how many will start FOMO after prices reach a new ATH and beyond, missing the entire move after the bottom was seen? These are very important questions that should be answered.
In my opinion, the markets remain in an extremely tight liquidity crisis, as I mentioned and observed already in August, and now the markets seem to have understood that liquidity is indeed extremely low. We see, on almost all recession or liquidity indicators, the same levels as in 2008 and worse. We have worse liquidity than during the Credit Suisse crisis, and somehow the banks manage to survive. The reason for this survival is the new rule regarding the Standing Repo facility, which no longer limits banks to borrowing a maximum of $500bn per day in total for all banks together. Now it means each bank can borrow up to $240bn per day from the Fed and needs to pay it back 1–2 days later with interest. This change means the Federal Reserve is acting like an always-open emergency cash window for banks so the financial system never runs out of short-term money. Banks are not being given free money, and they are not being paid to borrow. They temporarily hand over very safe assets like US government bonds and receive cash only for one night, and the next day they must give that cash back with interest. Before, the Fed limited how much total cash all banks together could borrow, which risked panic if too many banks needed money at the same time. Now that limit is gone, so any bank with proper collateral will always get the cash it needs. The number showing that a bank could theoretically borrow up to $240bn per day sounds huge, but it is misleading because the money must be returned the next day and cannot be kept or accumulated. This is very important for those who watch the standing repo and understand that the repo market is something like a money-printing machine, this is something only someone uneducated would say. Saying this equals tens of trillions per year is like saying someone earns money by using a credit card every day, which is not true. This does not mean the Fed is printing unlimited money or canceling tariffs or politics; it simply means the Fed wants to prevent sudden freezes in the financial system. The real message is that the system is fragile enough that the Fed wants to remove any chance of a liquidity accident by guaranteeing short-term cash at all times as long as banks provide safe assets.
Now ask yourself again: why all of this? Are we fighting inflation? Are we winning the fight or losing it? The real answer is that we are losing the fight against inflation and debt, and I am expecting a big crisis to happen in 2026, followed by COVID-style money printing in late 2026 and a repeated 2020 scenario. Assets, real estate, gold, silver, Bitcoin everything will increase, and money will keep losing value. That’s the reality, and yet I am saying the printers will turn on once we see the crisis, and it is very close in my opinion.
Enjoy your tea, wait, dont over-trade
Regarding #Bitcoin, my position is changed from fully USDT, with shorts averaging an entry around 119K to Fully BTC from 85k and short entry from around 119k average
THIS IS NOT FINANCIAL ADVICE BUT EDUCATIONAL CONTENT ONLY. ALL WRITTEN HERE IS MY OPINION AND MY OWN TRADING AND INVESTING STRATEGY
Join Premium: https://t.co/4ilNrRs1q2
Join Free TG: https://t.co/zkdgaR7eSK
🚨 🇯🇵 Rate Hike WARNING
Japan may hike rates tomorrow (99.8% odds)
For years, global funds borrowed yen at ~0% and piled into stocks, bonds, crypto (BTC).
cheap liquidity is ending.
When rates rise: • Yen strengthens
• Lev gets unwound
• Funds sell liquid assets first → BTC
I am buying back BTC around $86,000 to tactically trade a short-term relief move. As outlined in the Sunday Report, I see the probability for Bitcoin to revisit the 97k–107k region before the next major leg lower unfolds. Thats a 20% move from the current region, as trader a good risk reward trade with a tight stop loss. Still, I’m very bearish and I will play this move with absolute and the highest form of risk management. Means: I will make sure to place the stop loss at entry once in solid profit, also the short from 115-125k will be running and is not closed.
This setup is aimed at the few weeks only, before the strong bearish price action resumes with lower targets!
Bitcoin remains extremely unstable and bearish for the mid term, the strong downside continuation can happen at any moment, even before reaching the 97-107k zone. A deeper and faster sell-off is absolutely possible. So buying now should be taken with extreme high caution.
Short positions remain fully open.
Any upside is treated as distribution and liquidity for the next leg down, with the 70k region still firmly in focus as main target. In case we visit the 97-107k region I would take fully profit again on the spot position and add the profits into the short!
Current BTC price: $86,288
Date: 16.12.2025
@cryptorover#FOMC Summary
• Economy expanding at a moderate pace
• Job gains slowing + unemployment ticking up
• Inflation creeping higher & still elevated
• QT officially stopped as of Dec 1
• Vote breakdown: 1 wanted 50 bps, 1 wanted no cut — everyone else backed a 25 bps cut