$BTC
The Macro Outlook
Look at the current "Box" on the 1W chart. Most traders see sideways price action and call it "dead." I see a Master Foundation being poured for the next leg to $130k+.
Here is why Bitcoin needs to stay in this structure before it can explode:
Absorbing the Overhead Supply: Breakouts create "bagholders" who want to break even and early whales who want to take profits. This box is where Smart Money "grinds" through that sell pressure. They are absorbing every coin so that when the move happens, there’s no one left to sell into it.
The "Leverage Flush": Markets can't go vertical when everyone is 50x long. This ranging price action triggers stop-losses and liquidates the impatient. If you can’t handle the sideways grind, you won’t be around for the vertical expansion.
Structural Validation: The longer we stay here, the stronger the "Floor" becomes. We are turning previous resistance into a launchpad. A "Base" this large leads to "Space" that retail can't even imagine yet.
The Bottom Line: Structure takes time because Liquidity Rotation is a process, not an event. While the crowd chases the 1m noise, we watch the HTF levels.
Are you getting bored, or are you getting positioned?
A) Accumulating every dip
B) Waiting for the breakout
C) Just watching from the sidelines
Drop your status below. 👇
$BTC.D is showing a classic "Tap and Trap" signature. It has hit a major multi-year resistance ceiling, and the structure is now primed for a reversal.
Here is why it looks "tapped" and what the roadmap looks like for April and beyond:
1. Why it looks "Tapped" (The Technical Wall)
The 60% Psychological Barrier: Your chart shows $BTC.D struggling to maintain any momentum above the 58%–60% zone. This area has historically acted as a "Hard Cap" for Bitcoin dominance in post-halving cycles.
Double Top / Distribution: The price action inside your marked box is essentially a "Distribution phase." This happens when the "Smart Money" stops buying BTC and starts quietly rotating that capital into Altcoins while the retail crowd is still focused on BTC hitting $100k.
Loss of Momentum: While the Bitcoin price is ranging, the dominance is failing to make higher highs. This "Bearish Divergence" on the 14-day fractal suggests the "King" is tired and needs to share the liquidity.
2. What to expect next (The Roadmap)
If the structure holds as expected, we are looking at a structural shift that favors a massive Altcoin expansion:
The "Slow Bleed" (April): I expect $BTC.D to lose the bottom of your current box. This won't happen all at once; it will likely be a choppy decline as BTC itself consolidates.
The "Altcoin Spring": As dominance drops toward the 50%–52% level, you’ll see "High Beta" alts (like AI, DePIN, and Layer 1s) start to outpace BTC's percentage gains.
The Target: The long-term roadmap (as seen in your previous 1W analysis) targets a move back down to the 40%–44% range. This is the "Golden Zone" where full-blown Altseason occurs.
3. The "Why" (Macro Perspective)
In 2026, Bitcoin is acting more like a "Store of Value" (Digital Gold). Once it reaches a certain price saturation, investors naturally move down the risk curve to find 10x returns, which can only be found in the Altcoin market. The "Tap" you see on the chart is the signal that this rotation has officially begun.
The $BTC.D "Ceiling" is officially in. We’ve tapped the 60% macro resistance, and the distribution is clear.
While the crowd waits for BTC $100k, the smart money is already moving the furniture into the Altcoin house. Expect a bleed toward 50% in the coming months. April is for the patient; May is for the positioned.
$ETHBTC
While everyone is distracted by BTC’s sideways "Box," the ETH/BTC pair has just completed a massive retest of its multi-year support at 0.030 BTC.
Here is why the "Flip" is incoming:
1️⃣ The Macro Floor: We’ve seen a brutal "Stop Run" into the 0.028–0.030 range. This flushed out the last of the ETH bears. Historically, when ETH/BTC taps this level while $BTC.D is at its ceiling (58-60%), a violent bounce follows.
2️⃣ The 14-Day Divergence: While BTC makes lower highs on dominance, ETH is forming a Hidden Bullish Divergence on the HTF charts. Price is stabilizing around $2,000–$2,100 (ETH/USD), acting as a "Spring" for the ratio. Once the 0.035 resistance breaks, the floodgates open.
3️⃣ The April Rotation: As BTC continues to "Build the Foundation" in its box, liquidity is already leaking into ETH. This is the first domino. When ETH/BTC moves, the rest of the Altcoin market follows its lead.
What to Expect: Expect ETH to outperform BTC in April. We aren't just looking for a bounce; we are looking for a structural shift back toward the 0.05 - 0.06 target as Bitcoin Dominance falls off its cliff.
The Strategy: Ignore the noise. The most hated asset is usually the one that makes the most millionaires in the next leg.
Sabar. Tawakkull. ETH is the lead domino.
Engagement Farm: Is ETH finally ready to take the wheel, or are you staying 100% in BTC?
ETH Season 👑
BTC Only 😍
Drop your emoji below. 👇
🚨 THE CLOCK IS TICKING ON GLOBAL SECURITY
On March 30, 2026, Google dropped a research paper that should have everyone paying attention.
Quantum computers may be able to BREAK the security behind crypto wallets, banks, passports, and government systems… with far fewer resources than anyone expected.
This is NOT just about Bitcoin.
This is about the entire digital world.
Right now, everything depends on one assumption:
That no computer can figure out a private key from a public key.
That assumption protects:
- Your bank account
- Every HTTPS website
- Government systems
- Military communications
- Your phone updates
- Encrypted messaging apps
ALL of it.
Quantum computers change the game.
They can solve the exact math that keeps all of this secure.
Until now, experts believed it would take millions of components to make this a real threat.
Google just said: you may only need under 500,000.
That is about 20x less than expected.
And at that scale?
The attack could take around 9 minutes.
Bitcoin block time: 10 minutes.
Read that again.
That means a powerful enough quantum machine could potentially intercept and steal transactions BEFORE they are confirmed.
Let that sink in.
Now the reality check:
This machine does NOT exist yet.
But the timeline just got pulled forward.
And that changes everything.
Here is the part most people are missing:
This is not just a crypto problem.
This is a GLOBAL SECURITY problem.
The same math protects trillions of dollars, government systems, and the infrastructure of the internet itself.
If it breaks, it does not just hit Bitcoin.
It hits EVERYTHING.
Now the good news:
The world is not asleep.
- Quantum-resistant cryptography is already being developed
- Some blockchains are already testing it
- Governments started rolling out new standards in 2024
- Major tech companies are preparing upgrades
- Google itself is targeting a 2029 migration
But here is the catch nobody wants to talk about:
Crypto cannot move fast.
Banks can force updates overnight.
Governments can mandate change instantly.
Bitcoin?
No CEO. No central authority.
Every upgrade requires global consensus.
Slow. Messy. Complicated.
And there is an even bigger problem:
Millions of BTC are sitting in wallets where the public keys are already exposed.
No one can move them.
No one has the keys.
Those coins could become permanent targets the moment quantum crosses the line.
Meanwhile, trillions in tokenized assets are being built on the SAME security layer.
And most people are still not thinking about it.
Bottom line:
The lock protecting the internet is weaker than we thought.
The timeline is shorter than expected.
The solutions exist.
But the window to act is shrinking FAST.
This is not panic.
This is a WARNING.
And the world needs to move faster.
🚨 WARNING: SOMETHING EXTREMELY UNUSUAL IS HAPPENING
For the first time since 1996, global central banks now hold MORE GOLD than U.S. Treasuries.
Read that again.
MORE GOLD THAN TREASURIES.
And if you think that is just a normal portfolio shift…
YOU ARE COMPLETELY WRONG.
This is not about gold going up.
This is about the institutions running the global reserve system quietly shifting AWAY from U.S. government debt… and back into hard assets.
That is a BIG signal.
Because when central banks choose gold over Treasuries, they are telling you one thing:
Trust is shifting.
Now look at the numbers.
Back in Q4 2015:
Treasuries = 33% of reserves
Gold = 9%
Today:
Gold = 24%
Treasuries = 21%
That is not a small move.
That is a COMPLETE REVERSAL.
Gold did not just rise…
Its share nearly TRIPLED.
Treasuries lost dominance.
Now do the math.
Central banks hold around 36,000 tonnes of gold, roughly 1.16 BILLION ounces.
At $4,500 gold, that is over $5.2 TRILLION sitting inside official reserves.
And they are STILL buying.
About 1,000 tonnes per year for the last three years.
That is roughly $140+ BILLION flowing into gold every single year.
That is not trading.
That is a STRUCTURAL SHIFT.
And it gets even clearer:
According to the :
- 95% of central banks expect gold reserves to INCREASE again
- 73% expect dollar reserves to DECLINE over the next 5 years
Let that sink in.
The biggest players in the world are preparing for:
More inflation risk
More geopolitical stress
More fiscal instability
LESS reliance on the dollar system
This is the real warning.
Not that gold is rising…
But that gold is taking share from what used to be the SAFEST asset in the world.
If this trend continues, this is not just another cycle.
This becomes a full regime shift.
In reserves.
In trust.
In global capital flows.
This can move slowly…
Until suddenly it doesn’t.
And when it flips fast, most people will still be looking at headlines instead of positioning.
Stay ahead.
$DOGE
HTF Pov
The major zone has been reclaimed, and now the price will close up above this green line. Closing above this line means the liquidity deviation is completed, and now it wants to run to the upside.
You can see the 1st trade as well in this picture, and the price rallied fast, then the box was not reclaimed. I am expecting $doge to close above this line, and then it can simply go to 0.12.
LTF looking good and solid here.
$WiF
HTF
The yellow line has been tapped and confirming this range low bottom, the upside momentum looks good, and the liquidity is sitting on 0.20.
Range low confirmation means market makers are planning to run the asset to the upside, and here you can see both taps, which retail will use as a double bottom and range break.
"Exactly. The 1W 'Box' is essentially a liquidity vacuum. While retail complains about the chop, the HTF fractal is quietly neutralizing the overhead supply. Once that distribution is complete, the path of least resistance isn't just up—it’s vertical. 📈"
🚨 BREAKING: THE U.S. ECONOMY JUST SENT A MIXED SIGNAL — AND MOST PEOPLE ARE MISSING IT.
U.S. manufacturing is STILL expanding… even with war, oil above $100, and global disruption.
ISM Manufacturing PMI just came in at 52.7 for March.
That’s not just a beat — it’s the third straight month above 52.
Anything above 50 = expansion.
Let that sink in.
For most of 2023 and 2024, manufacturing was stuck in contraction.
The recovery only started in late 2025.
And now? It’s holding — even under pressure.
But here’s where it gets interesting.
This is March data.
Meaning:
The Iran war was already active Oil was already above $100 The Strait of Hormuz was already disrupted
And STILL… manufacturing expanded.
That tells you something very important:
👉 The industrial side of the economy is more resilient than expected.
Now flip to the consumer.
Retail Sales:
+0.6% (headline) +0.5% (core)
Both beat expectations.
Sounds strong, right?
Not so fast.
That’s February data.
Before:
The war started Energy prices surged Supply chains tightened
So what you’re really looking at is this:
👉 Manufacturing = POST-shock strength
👉 Consumer = PRE-shock strength
And that gap matters.
Because the next wave of data will answer the only question that matters now:
Does the consumer crack under pressure… or hold like manufacturing?
That’s the moment markets are waiting for.
And when that data hits, it won’t be a slow reaction.
It’ll be fast.
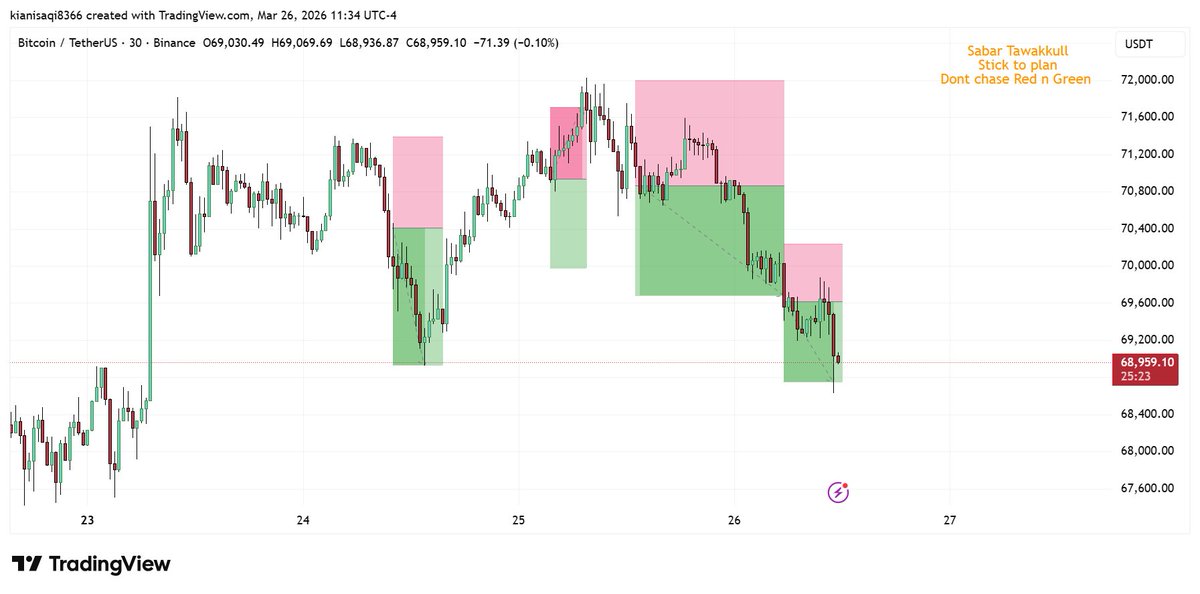
$BTC
LTF
Tp hit on every short scalp, the reason of lattest scalp was price breached the range of 69k and see the magic itself.
Every LTF range breakdown is for selling, keep selling until 65k.
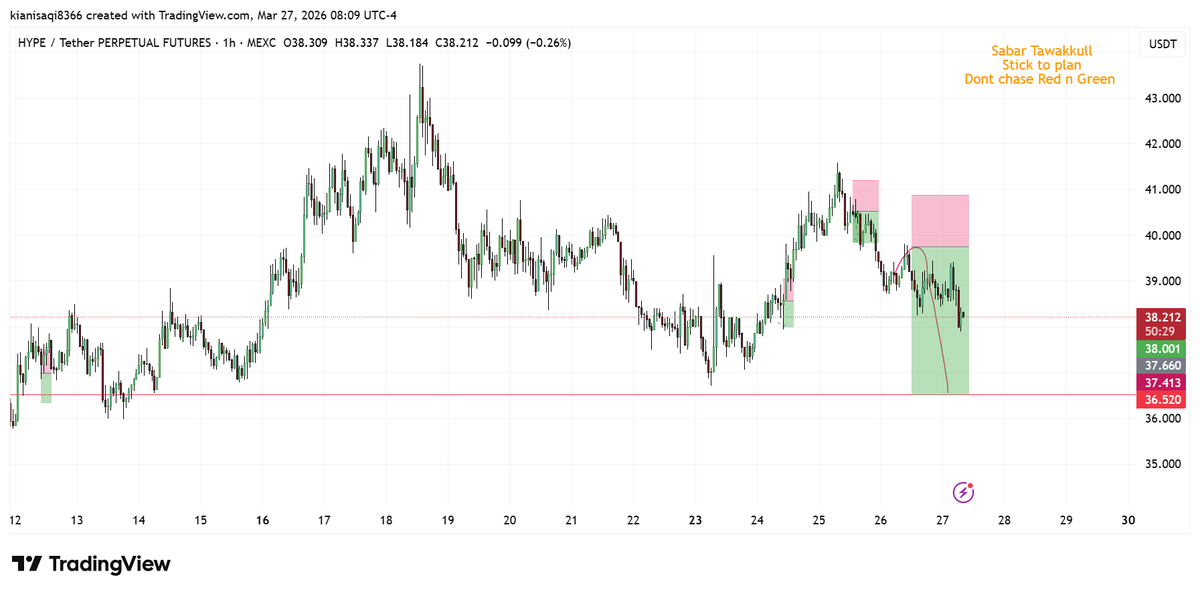
$HYPE
Shorts are melting profits, if you know how to manage the risk and how to play the range, this is the result you get.
Hope everyone printed good money.
RT and comment for more free trades.
$BTC
65K needs to hold, or we are in for a new low. Price tried multiple times to breach the zone of 75k, but it failed.
This range is still active, and each support and resistance is tested multiple time means that now which way the price goes first will get breached.
65k looks like the golden pocket of this range, and we can expect a decent bounce towards 69k,71k, and beyond, but if 65k gets breached, be ready for a new low before any major upside move.
🚨 RUMORS GROW: COULD THE U.S. HOUSE MOVE AGAINST DONALD TRUMP BY MARCH 31?
The situation right now is tense.
Reports suggest lawmakers are deeply divided, and political pressure is rising fast.
If you think this won’t affect you, you’re mistaken.
If you hold any assets:
Stocks
Crypto
Bonds
U.S. dollar
You should be paying attention.
Hearings and political clashes are intensifying inside the U.S. House of Representatives.
Both Democrats and Republicans are raising concerns about the actions of Donald Trump.
Several key issues are fueling the situation:
Escalating global trade tensions
Immigration enforcement policies
Budget uncertainty
Rising geopolitical risks involving Iran
Growth in U.S. national debt
Concerns over executive authority
All of these factors are increasing political pressure.
Let’s look deeper:
There are ongoing concerns about potential influence over the Federal Reserve.
For markets, even the perception of reduced independence can trigger fear around monetary stability.
At the same time, aggressive tariff strategies have created friction with major economies, including the European Union.
Legal challenges and political opposition continue to build.
Add to this the immigration situation.
Policies linked to U.S. Immigration and Customs Enforcement have sparked protests and legal disputes, further intensifying the political environment.
Now here’s the reality:
If a serious impeachment push gains traction, markets could react sharply.
Periods of political instability in the U.S. often lead to:
Delays in economic policy
Increased volatility
Investor uncertainty
This can pressure the U.S. dollar and shift capital toward traditional safe-haven assets like gold and oil.
Major indices like the S&P 500 and Nasdaq Composite could face short-term downside if uncertainty spikes.
At the same time, geopolitical tensions remain a wildcard.
Any escalation involving Strait of Hormuz would directly impact global oil supply and prices.
The bigger picture:
Markets react less to headlines and more to uncertainty.
And right now, uncertainty is building.
When I rotate money, I will post my moves here so my FOLLOWERS can SAVE their capital.
Follow me and turn NOTIFICATIONS ON as I will share my strategy soon.
Many will regret not following me earlier...
$BTC
LTF Pov
Price has breached the mid and the most important zone to me, 69.900 was the barrier, now it's breached, which means we are going to the lower support of this range, which is 65.1k.
Don't fomo long here, price will tap the below support of 65k, and then the range will continue again.
$BTC has not decided which way it wants to go. Above 70k, it floats and then comes back to range, then breaks 65k and deviates, and then goes up again; all this will vanish by one big move to either side.
#Bitcoin #cryptocoins #MarketForecasts #marketupdates
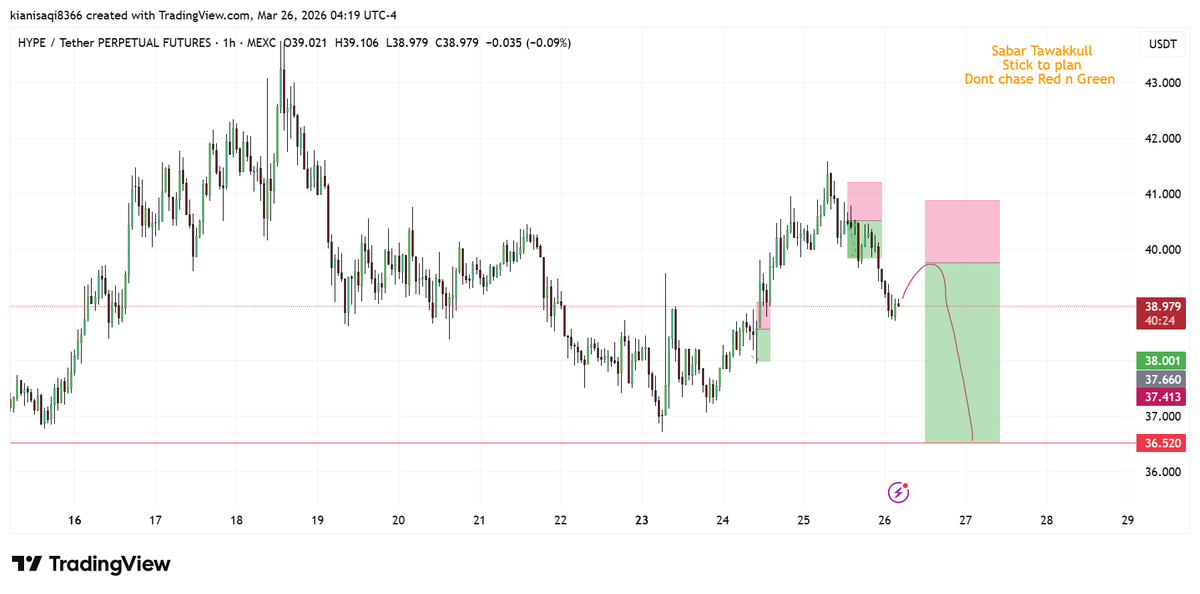
$HYPE
LTF Pov
Placing my bets here, there is good risk to reward available on the table.
Any retracements above are for selling. Don't look for buys in the market, weak market, weak buy volume, so sell everything on LTF.
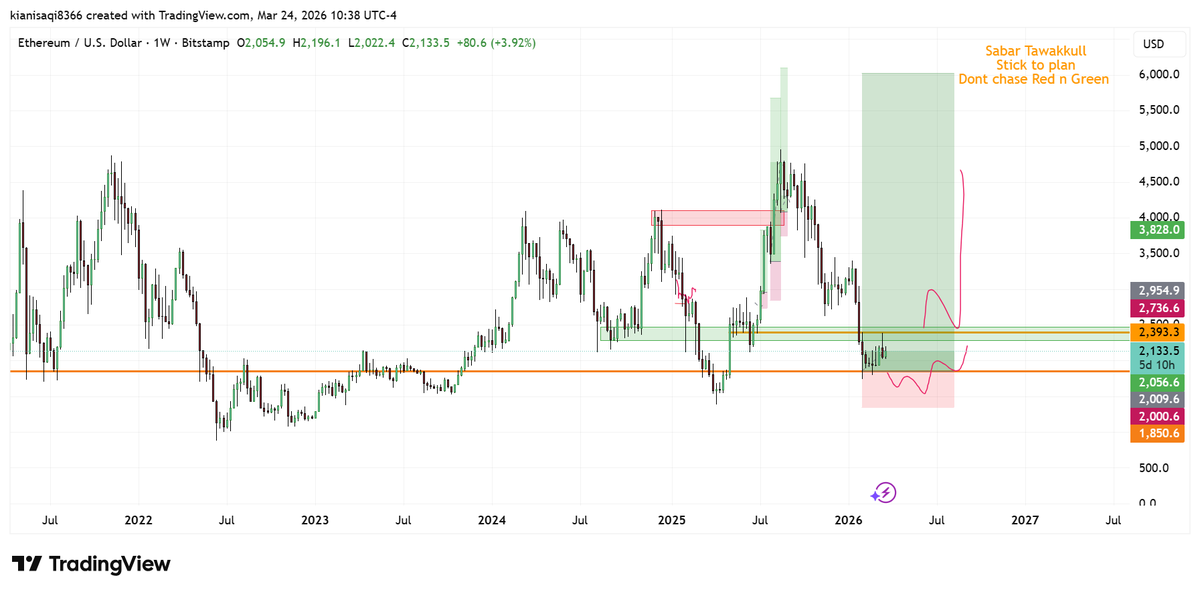
$ETH
HTF Pov
Both cases are in front og you, you can choose your pain.
Personally i would like to see the upper case, but if the price drops below 2k and closes a daily candle, then we are going to the zone of 1400.
Eth is looking weak, with no clear sign of strength at 2100, which means one thing that price wants to tap the below liquidity zone.
#ethereum #btc #cryptosignals #MarketMarket
🚨 THE U.S. HAS A BIG PROBLEM NOBODY WANTS TO TALK ABOUT
Take a look…
The U.S. debt situation is getting worse, reaching levels not seen in decades.
If you have ANY money invested, you should pay attention to this:
26% of U.S. federal debt is scheduled to mature within the next 12 months.
That sets up one of the largest refinancing cliffs in modern history.
Under normal conditions, this might be manageable.
But these are not normal conditions.
And here’s the part many are avoiding…
IT WILL DRAIN LIQUIDITY FROM THE ENTIRE SYSTEM.
For context, the previous peak was 29.1% in 2020.
Back then, the Federal Reserve had interest rates near 0%. Money was essentially free.
Now, rates are around 3.64%.
This means roughly $10 trillion in debt will need to be refinanced at much higher rates over the next year.
The U.S. Treasury is trying to ease the pressure…
It has shifted toward issuing shorter-term bonds to lower immediate interest costs.
But this only delays the problem rather than solving it.
So the question is: who will absorb all this debt?
Markets are currently expecting two rate cuts this year, but that alone does not fix the supply imbalance.
As a result, the Treasury will need to issue a large volume of bonds.
That process pulls liquidity away from other assets across global markets.
This includes:
– Crypto
– Stocks
– Essentially any asset that depends on liquidity
The likely outcome is that the heavy supply of government debt could cap upside in risk assets over the next 12 to 24 months.
I will continue tracking how this evolves.
And for context, I previously called the last three major Bitcoin market tops and bottoms, including its all-time high near $126K in October.
When I make my next move, I’ll share it publicly here, as always.
Many people may end up wishing they had paid attention earlier.
$BTC
LTF
Literlly best market for scalpers, just follow the untapp liquidity after the break of structure, then see the magic itself.
Remember that HTF suggests we are going to 78k or more, but LTF looks primed to tap below liquidity.
#Btc#CryptoAlert#Trading#MarketTrends
🚨 BREAKING: STOCK MARKET CRASH LOOMING ON MONDAY
The Federal Reserve just dropped urgent macroeconomic figures, and they’re significantly more alarming than anticipated.
US annual inflation jumped to 5.2%, the highest reading in quite some time.
Powell is now discussing potential rate INCREASES rather than reductions.
And the situation deteriorates further:
If you’re currently holding positions, you’re unlikely to welcome what’s approaching.
Just three weeks back, markets were fully expecting rate reductions.
Today? They’re swiftly adjusting toward RATE INCREASES.
That type of dramatic shift doesn’t occur during calm periods.
If your portfolio is positioned for looser policy, you’re now on the losing side of this adjustment.
What’s unfolding isn’t business as usual.
Inflation expectations rarely surge this sharply unless serious cracks are forming below the surface.
And the majority of investors aren’t prepared for what’s coming.
The Fed now finds itself in a far more constrained spot than almost anyone predicted.
Rising inflation expectations can cause financial conditions to tighten even if the Fed stays completely still.
Yields climb.
Liquidity dries up.
Risk tolerance evaporates.
All of this can happen before a single rate increase takes place.
Now take a step back.
This goes well beyond a single report.
It’s the message it sends.
Markets have flipped from “Inflation is contained” to “Inflation is picking up speed again”.
In just a matter of weeks.
A narrative reversal of this magnitude is highly hazardous.
Because current positioning was constructed on the exact opposite premise.
Rate cuts were the expectation.
Disinflation was the baseline scenario.
Soft landing was the broad agreement.
Now every one of those assumptions is under scrutiny.
And when broad consensus fractures, volatility inevitably follows.
Consider the consequences.
If inflation expectations remain high:
→ The Fed is unable to ease
→ Real interest rates stay punishing
→ Financial conditions become even more restrictive
That’s not positive for markets.
That’s a serious headwind.
And it gets uglier.
If the Fed ends up forced to contemplate rate hikes once more, their policy credibility takes a major hit.
They’ve already communicated an easing path.
A rapid U-turn undermines their forward guidance.
And nothing unsettles markets more than uncertainty.
Now add this to an already vulnerable backdrop.
Debt burdens remain elevated.
Funding markets are fragile.
Underlying growth is decelerating.
You’re now dealing with:
persistent inflation + restrictive policy + heavy debt loads
That mix rarely produces favorable outcomes.
History shows this pattern clearly.
→ Inflation surprises on the upside
→ Markets misjudge the policy response
→ Conditions tighten abruptly
→ Risk assets adjust sharply and painfully
The sequence is well-established.
Markets consistently lag behind inflation regime changes.
They dismiss it as transitory… until it proves otherwise.
By the moment they finally react, the damage is already in motion.
We’ve just transitioned from a “rate-cutting” storyline to a “higher-for-longer, maybe even hiking” environment.
Once it becomes widely recognized, the window to position ahead has already closed.
I’ve been identifying major market peaks and troughs for more than ten years.
When I decide on my next significant call, I’ll share it here first.
If you aren’t following yet, now’s the time to start.