I love the cadence of this chart
Bitcoin % of Supply in Profit/Loss
As I said previously, you start looking for major market cycle bottoms *after* they cross, not before.
They just crossed.
Such a great chart for keeping people on the right side of the market in midterm years
🚨 Anthropic just showed a 24-minute workshop on how to actually do prompts for Claude.
Taught by the people who built it.
Free. No registration. No paywall.
I've seen $500 courses that don't cover what they teach in the first 8 minutes.
Watch it and bookmark it now.
This is f*cking sauce.
This AI workflow will completely revolutionize how you trade.
If I had this years ago, I literally would've printed money.
In the right hands, this article is dangerous:
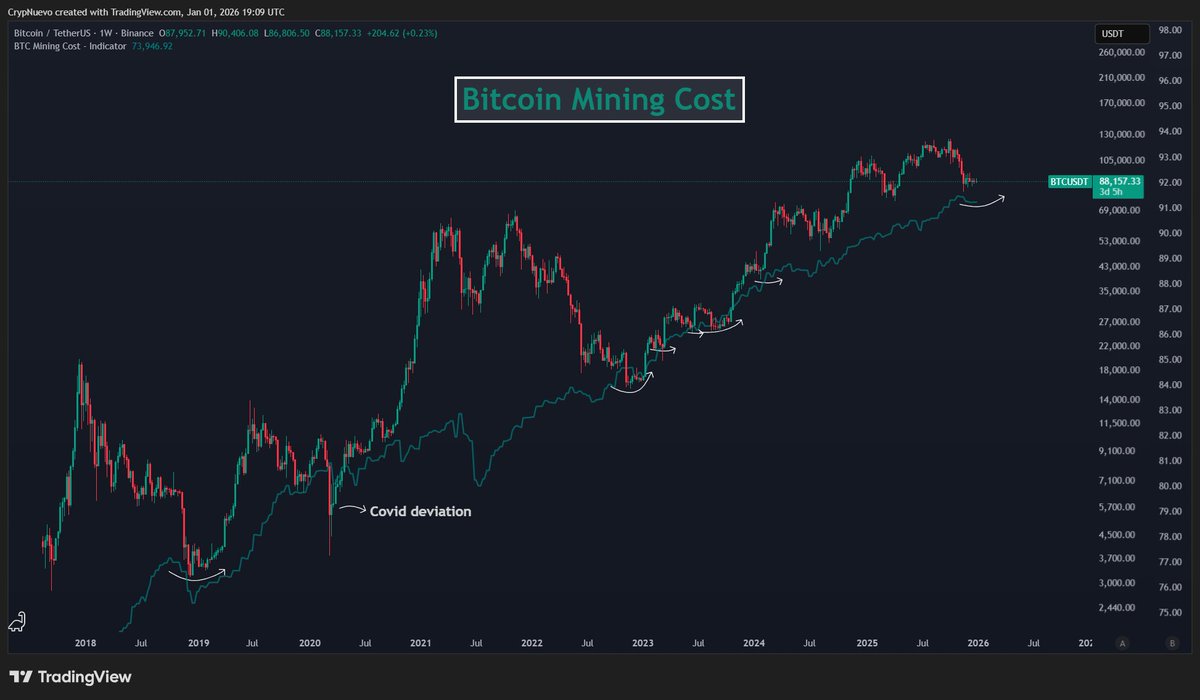
The Bitcoin mining cost has acted as a long-term support for price.
It is currently at $74k, very close to the actual price for 1 Bitcoin. Based on this metric, downside from here is very limited.
Price rarely stays below it for long.
Tax-loss harvesting is how you turn bad trades/investments into tax savings:
In many tax systems, selling investments at a loss before tax year-end (Dec 31st in many countries) can legally reduce the taxes you pay this year and in future years.
Here’s how it works 👇
🧵↓(1/5)
What have I been telling you about China.
The Oct 10–11 wipeout was “manufactured,” withdrawals were throttled, and fees plus internal P&L captured the spread.
Wintermute’s own line is that they stopped trading mid-crash because internal risk limits tripped, not to profit from it. That matters because “stood down” vs “leaned on the book” implies opposite motives.
force liquidations, slow withdrawals, book internal P&L, and harvest 8–12 bps on extreme turnover days. That’s exactly the type of play Chinese exchange + MM would do. I just need need order-book and wallet evidence to prove it.
If Washington can make domestic hash-rate and mined BTC the new collateral for Treasuries, the dollar becomes energy backed again this time by compution rather than crude.
That threatens the entire BRICS commodity clearing model China has been building with gold and the digital yuan.
China can’t easily stop American miners or ETF flows directly, but it can attack the price discovery layer.
Binance, Bybit, and Hyperliquid are offshore venues with deep liquidity but no U.S. regulatory leash. Each blaming each other like the Spider-Man meme.
Most large market makers routing through them. Wintermute. Jump, etc. operate globally.
If you control latency, liquidation engines, or synthetic funding rates, you can spike or crush BTC’s price at will.
The easiest way to discredit BTC is to make its market look chaotic and manipulated.
You see gold crash 5% two days in a row?
Exactly. That’s the counter punch. Bitcoin is a large asset class now. Beijing’s rational response is to suppress Bitcoin’s perceived reliability until the U.S. hash-standard architecture is too costly or politically risky to finish.
If the U.S. succeeds, Bitcoin becomes the backbone of a Hash-Dollar energy-reserve economy, reviving dollar hegemony.
the market behavior you’re seeing fits perfectly with a financial proxy war:
Hash-Dollar vs. BRICS-Gold.
WW3 isn’t fought with bullets.
You all act as if sovereign nations don’t know that Bitcoin is the greatest innovation the world has ever seen…
-pigeon
“If I died knowing that I did what was right or did my best to do what was right and even If in the History books They said I did wrong, I would still feel okay about that, I care about the reality of goodness and not the perception of it”
-Elon Musk
This feels like a good time to bring back our crypto rules of engagement:
✅ No leverage
��� No FOMO
✅ Top 3 to 5 assets as main bag
✅ Self-custody (or multi-sig) with good wallet hygiene
✅ Only trade a small Degen bag <10%
✅ HODL over a longer time horizon
✅ Zoom out and remove the noise
✅ Expect 20-30% pullbacks frequently
✅ BTFD if you can
We’ve had seven 20-30% corrections this cycle. Feels rough in the moment, but when you zoom out, even with the current 17% pullback, Bitcoin is still up over 620%.
Perspective and patience is everything on days like this…
Quick mental framework for looking at DATs
You can think of them as PE-style closed-end funds with perpetual life, a broad mandate, and liquid LP shares, which just happen to denominate most (or all) of their AUM in a single asset: the underlying token.
Why managers like running them:
- Easy asset raising: raising massive size is unusually easy because of the current bubble.
- No redemptions: no LPs knocking at the door to get their money back (the DAT can just trade at a discount).
- No fixed lifecycle: unlike VC or PE funds, these vehicles can run forever.
- No liquidity constraints: you can take all the liquidity risk you want, do OTC or locked deals, park funds anywhere. This is very bullish for DeFi (which happily will take all that collateral).
- Regulatory grey zone: all those laws and compliance for traditional funds? Forget them. Here, you can pretty much do whatever you want.
Are DATs some kind of dark magic? Absolutely not.
They're just a huge bubble for capital providers and some managers are seizing the opportunity...
Is the copper/gold ratio turning?
The copper/gold ratio looks like it might potentially be turning up.
It’s still early days, but the most recent low was printed on April 11.
And since then, copper has been outperforming gold, particularly in the past two weeks.
So we might be witnessing the start of a new rising phase in the copper/gold ratio, after the last rising phase ended in late 2021.
Since 2009, there have been four rising phases, and the average length of a rising phase is 643 days.
So, if we assume that:
1⃣ The copper/gold ratio did bottom on April 11
2⃣ “This time is not different”
Then, a new rising phase of an average length could be expected to peak roughly around Q4 2026 to Q1 2027 (although there is a big variance in the length of previous rising phases).
But is the copper/gold cycle ratio broken?
You might have noticed that the copper/gold ratio has been falling for more than 3.5 years.
The first part of this period coincided with the risk asset bear market in 2022.
But since then, stocks and bitcoin have been rallying, even though the copper/gold ratio has continued falling.
There are many potential reasons as to why this latest falling phase has lasted so long.
But there’s one big reason…
Let’s talk about China
China is an incredibly important part of the global economy.
China is the “manufacturing engine of the world”.
It’s integral to setting the tempo of the global economy.
China is also the country that has the biggest impact on the copper/gold ratio.
This is because the relative strength of the Chinese economy fuels both sides of the ratio.
China is by far the biggest consumer of copper in the world.
So when the Chinese economy is strong, demand for copper increases and the copper price will often rise.
On the other hand, gold holds significant cultural and economic importance in China - it is an incredibly popular investing vehicle.
Particularly when the Chinese economy is weakening, Chinese investors will often turn to gold, increasing demand and putting upward pressure on the gold price.
Below, I've plotted the Chinese Government 10-year bond yield (CN10Y) alongside the copper/gold ratio.
There’s a clear correlation between the two.
CN10Y is a very rough proxy for the relative strength of the Chinese economy.
CN10Y rising = Chinese economy strengthening, CN10Y falling = Chinese economy weakening
This may be one plausible reason as to why the copper/gold ratio has been falling for such an extended period of time.
CN10Y was basically sliding into the abyss through 2024, as the Chinese economy was weakening.
But then it abruptly stopped falling in early 2025 - and started to stabilize.
Why is this?
It hit a wall of money.
In December 2024 the People’s Bank of China (PBoC) - the central bank of China - made a rare move in officially changing its monetary policy stance from "prudent" to "moderately loose".
Since then, the PBoC has injected roughly 4.5tr RMB ($630bn) into Chinese money markets.
The chart below shows the total amount of liquidity provided through the PBoC's three main policy tools.
China looks like it’s getting serious about providing more monetary stimulus and supporting its economy.
And this can only be a good thing for the copper/gold ratio, the global economy as a whole, and potentially risk assets more broadly.
So keep an eye on the long-term cycle of the copper/gold ratio - it might just be starting to turn.
What Does Paradigm C Mean For Your Portfolio?
Today, I joined @cvpayne to break down why markets are embracing Paradigm C—a pro-growth blend of stimulus, tax cuts, deregulation, and strategic reshoring. Unlike the austerity-driven Paradigm B, which would favor Main Street but hurt Wall Street, Paradigm C expands the K-shaped economy—bullish for stocks, credit, and crypto, bearish for bonds and the dollar.
While rising rates and Treasury volatility may cause bumps along the way, geopolitical and fiscal tailwinds are fueling an economy on steroids. Stay risk-on. Use volatility to buy the dip.
If you missed the appearance, watch it here:
There is a lot of debate on what SPX will do next.
The rally that we just had was not that difficult to anticipate, as the market will often get a big bounce after 20-21% drawdowns (especially in short periods of time).
The market also will frequently bounce after sweeping lows from a year before (I showed this on youtube back in March/April).
I was also clear to expect SPX weakness from Feb OPEX to early-April (as I mentioned many times), but that renewed strength should come in Q2.
Well here we are - that all played out. So now what?
There has been a lot of debate on this platform as to what lies ahead.
Now #SPX is at a crossroads and the short-term direction becomes a little less clear.
You can see two analogs below that match 2025 pretty well so far (1980 and 2001), so it's easy if you are in either camp (bear or bull) to provide the analog as evidence that backs your bias.
The thesis for either path is actually somewhat believable:
1) The Bear Case
The bear case is fairly straightforward:
The unemployment rate has been trending up for the last couple of years. The market was looking for a reason to kick off the downturn, and uncertainty from the new administration as it relates to tariffs was the perfect event to swing momentum in the other direction.
There has been a huge bounce by SPX, seemingly following announcements of trade deals, but tariffs are still in effect and even tariff pauses do not actually mean pauses (they just mean less tariffs than previously announced). Thus, this phase could simply be the "return to normal" before we have to face the music of rising unemployment and potentially rising inflation once tariffs make their way to the consumer.
The reason this could be detrimental is because tariff uncertainty as it relates to inflation could cause the Fed to not cut rates as early as they should, which might increase the chances of a hard landing. Since we had negative GDP in Q1 2025, it would seem reasonable to get a rate cut under normal circumstances (especially with headline inflation at 2.3%). But the Fed is and will likely continue to not cut rates until it becomes more clear how tariffs will affect the inflation data. If the FFR is > r* (the neutral rate), then the economy will continue to slow down. If there is a spike in inflation, the Fed's hands could be tied to come to the rescue of rising unemployment.
If this scenario is to play out, then one would expect SPX would make a lower high in May (June at the latest) and put in a new low by Aug/Sep.
2) The bull case
The bull case is also straightforward. Markets panicked and had a tariff tantrum over higher than anticipated tariffs. But now that many have been reduced, business can continue as usual. Prices of goods and services might go up but if the consumer is not tapped out, then the economy could simply continue churning along for a while as rising costs of companies just get passed to the consumer (like they always do).
A new high by SPX would be more suggestive that the market has shrugged off the tariffs and is no longer that concerned about them. After all, the market has shrugged off plenty of things over the years. This would once again speak to the resilience of the US economy. In that case, it would also make sense for the long end of the yield curve to go higher as the implication would be that the economy is still doing ok, (the long end could also go up in the bear case though too with inflation expectations going through the roof).
So like I said, the market is at a crossroads. Buying stocks in early April was not the hard part. The hard part is what comes next.
The path for the summer is still open for debate. I think the path could be partially decided on the next macro data points (unemployment rate and inflation next month). If tariffs start to show up in the inflation data, then it would likely put the SPX rally on pause. Or if the unemployment rate trends up this summer, it could also put the rally on pause.
If both inflation and the unemployment rate remain low, then the market momentum would likely continue.
The good news is that market tops usually take a long time to play out, which is why panic selling early April was never a good idea. It's one of those things where if you look at the market in a month and SPX has still not put in a new high, then it may be time to start bracing for a pullback into Q3.
I'll probably reference this post in a few weeks and by that point it will probably be more obvious which path SPX is following. Even in the bear case, stocks would likely only slowly go lower after failing to put in a higher high, which would give people time to make decisions. The next period of major weakness in stocks is likely Aug/Sep. If SPX puts in a higher high soon then Aug/Sep weakness would likely be a higher low. If SPX puts in a lower higher here, then the weakness in Aug/Sep would likely be a lower low (or double bottom).
I do think DXY will go to 103-104 in the short-term, but I do not anticipate a big move up by DXY until 2026.
📈 Federal Reserve Liquidity set to rise in coming weeks
So what's the latest with Fed liquidity?
I haven't done an update in a while.
We are still in the middle of a "liquidity upswing" that started in early 2025.
This is due to an ongoing draining of the Treasury General Account (TGA).
The US Government cannot issue "new, additional" debt because the debt-ceiling is now binding.
So it is spending down its "savings" (TGA).
This is a liquidity injection of hundreds of billions of dollars.
It pushes up bank reserves, similar to QE.
However, in April we saw the first of two expected "speedbumps".
Tax payments filled up the TGA (liquidity drain).
Now, we're over the first speedbump.
Fed liquidity should now continue to rise over the coming weeks as the TGA balance continues to dwindle.
The TGA balance is still loosely following the arrows I drew a while ago.
I estimate the "X-date" - the day the US Government officially runs out of money - to be some time in August.
Between mid and late June, the second speedbump will involve:
1⃣ Corporate tax and estimated quarterly tax payments filling the TGA (liquidity drain)
2⃣ End-of-quarter balance sheet "window-dressing" leading to increased Reverse Repo usage (liquidity drain)
So what we'll be looking at, from a Fed liquidity point-of-view, is something similar to this:
(This is just a rough estimate and won't be exactly correct)
The path above will be followed up until the point that a new debt-ceiling agreement is reached.
The moment a new debt-ceiling arrangement is made, Fed Liquidity will start to fall.
This is because the Treasury will be flooding the market with new debt to "refill" the TGA.
A new debt-ceiling agreement could theoretically be reached at any time.
But history suggests it will occur at the last minute, as lawmakers wrangle for concessions.
Treasury Secretary Scott Bessent gave an update last week.
He said:
"There is a reasonable probability that the federal government’s cash and extraordinary measures will be exhausted in August while Congress is scheduled to be in recess."
Bessent urged Congress to “increase or suspend the debt limit by mid-July, before its scheduled break, to protect the full faith and credit of the United States.��
As we exit another recession obsession and there are still permabear economists and macro “experts” warning you about the next downturn, I thought a thread with another possibility might help.
Recessions Aren’t What They Used to Be—And Neither Is the Economy 🧵
Hurts to see many traders got rekt lately.
As promised, I'm opening my private trade group for some time to help you recover for free.
450 seats left.
To enter must like, share, comment now. GO👊