Do it for 100 days.
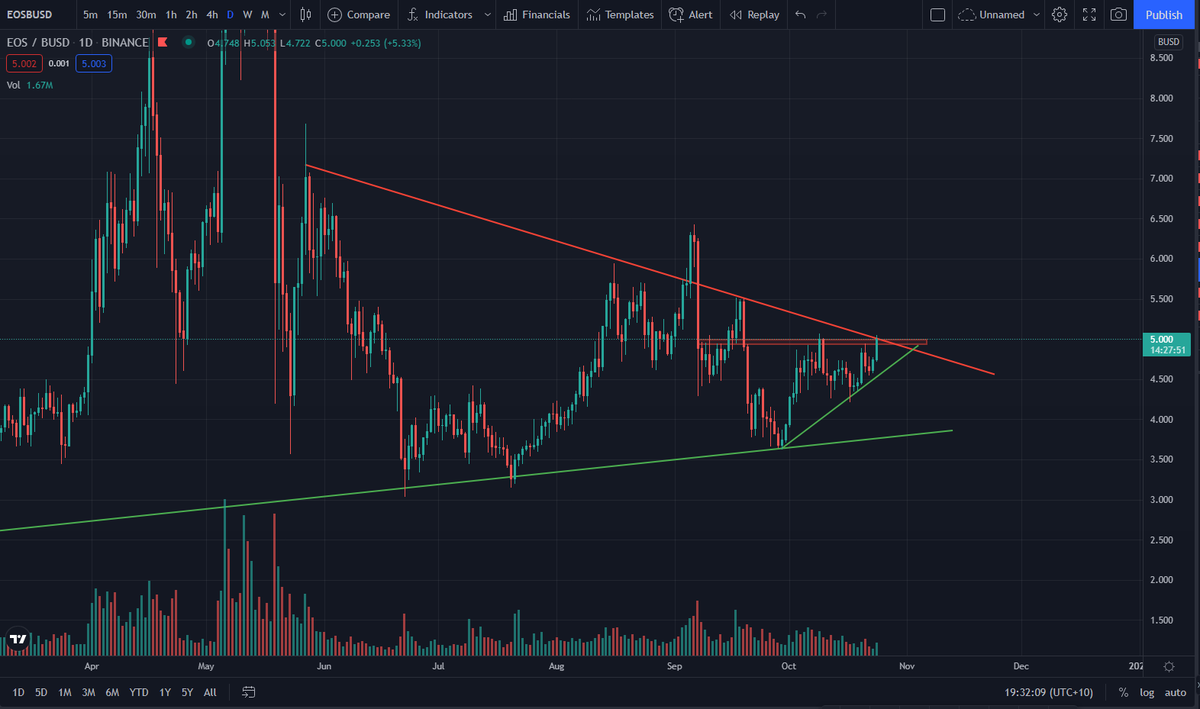
1.Draw weekly and daily levels. High and Low.
2. Mark regions of high interest and wait for those regions to get tested for entry.
3. Keep doing this for 100 days while testing Volume Profile and other Indicator confluence.
Check progress after 100 days.
I have been working on a PDF which helps traders
-Find a strategy suitable for them.
-How to identify confluence.
-Filtering high probability entries.
-High disciple re-test trades.
Putting it together but can expect it in few weeks.
Won't post much till then. Any suggestions?
Want to Learn Trading? (Updated)
1. Index of All tutorials - https://t.co/D3JySF05lA
2. When to Exit- https://t.co/2wBQqZveRk
3. Strategies- https://t.co/D3JySF05lA
4. Risk Management- https://t.co/uewiCfPGC5
5. Compilation (March 2021)- https://t.co/6JA9craDC8
All the Best
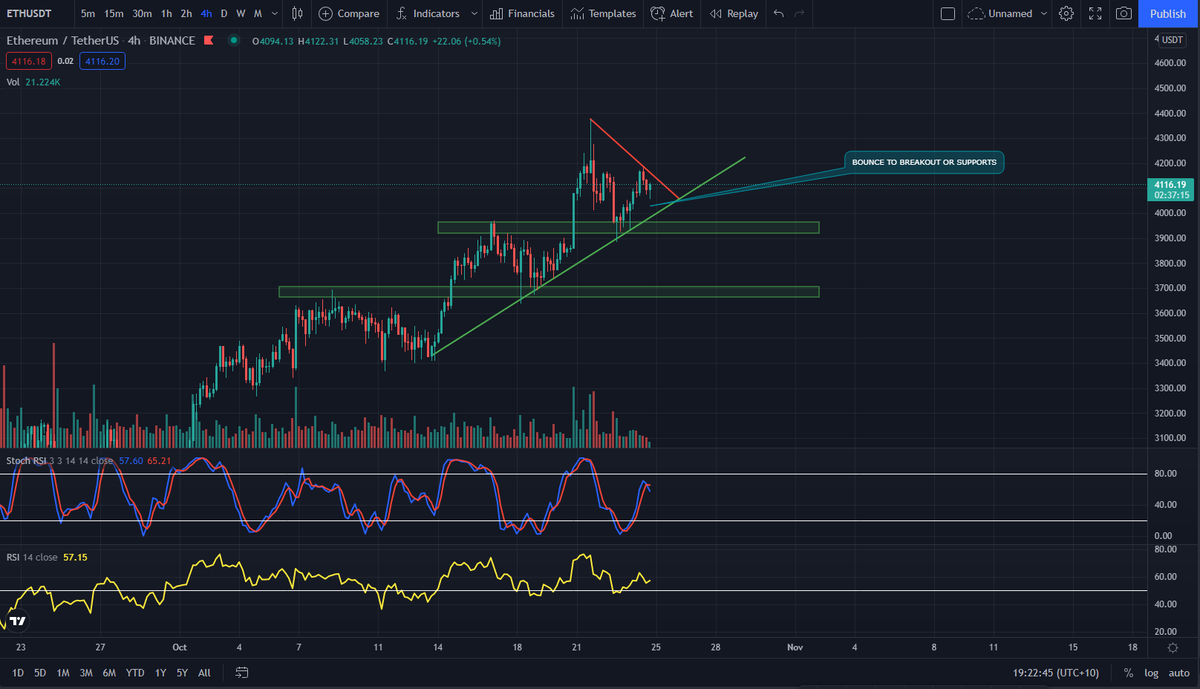
#ETH ANALYSIS - TRENDING UP (HTF)
SITTING IN A TRIANGLE ATM
WE WILL EITHER TEST TREND (4K) OR PREV SUPPORT (3.9K)
IF WE DO NOT BREAK TRIANGLE TO UPSIDE, AND LOSE SUPPORT, WE COULD SEE 3660 - 3710
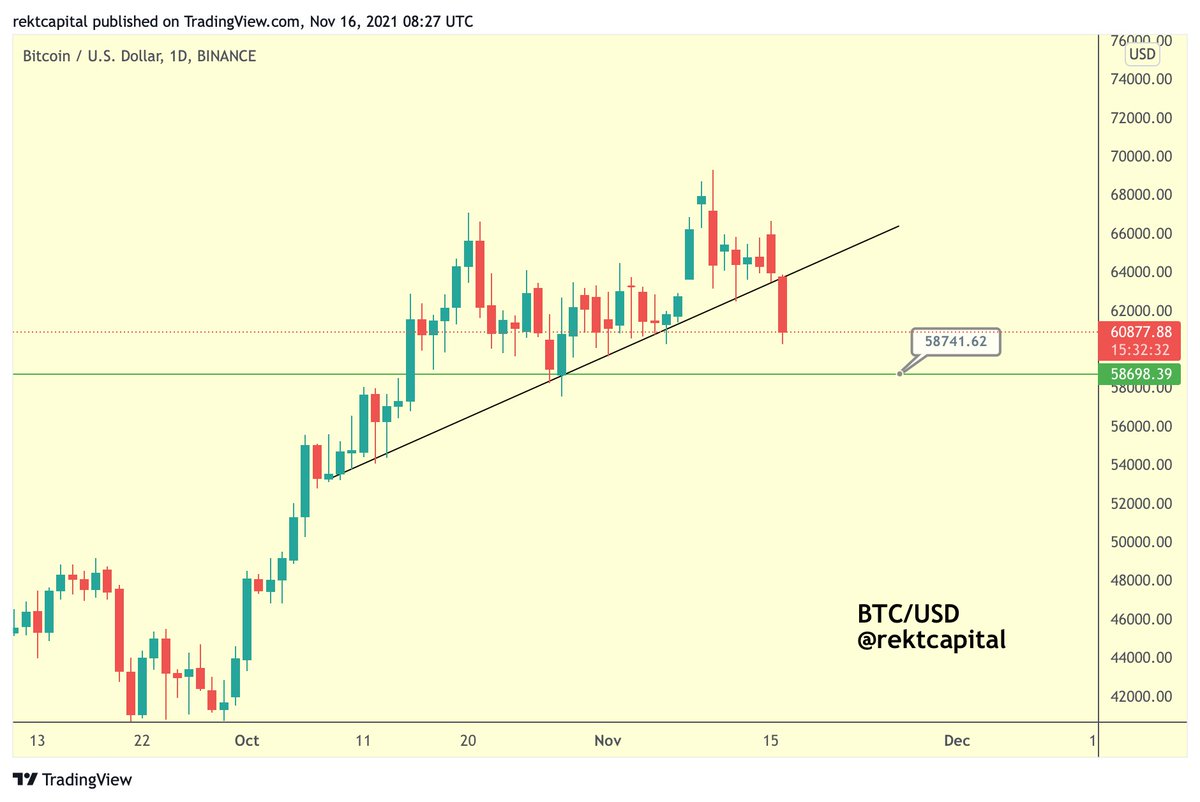
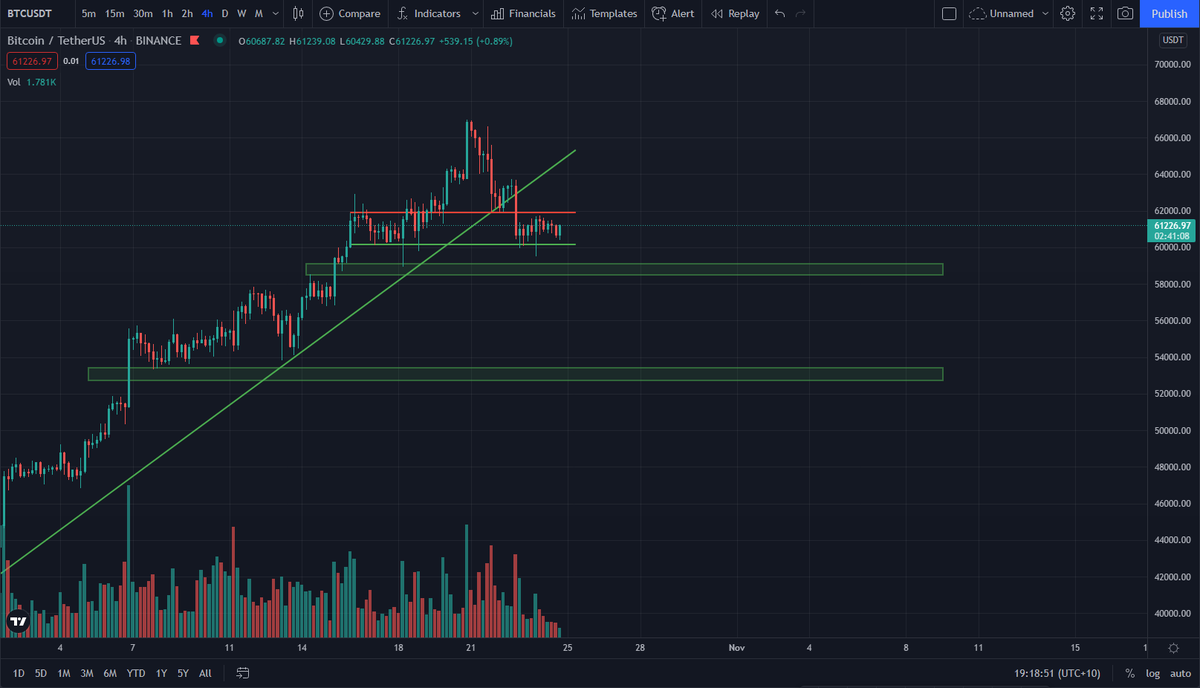
#BTC ANALYSIS - CURRENTLY CONSOLIDATING BETWEEN 60-62K
- BROKE UPTREND (BEARISH)
- STOCH RSI FLIPPING (BEARISH)
NEED TO BOUNCE FROM 60K AND REGAIN 64K OR WE WILL SEE LEVELS OF 58-59K, OR EVEN 53-54.5K
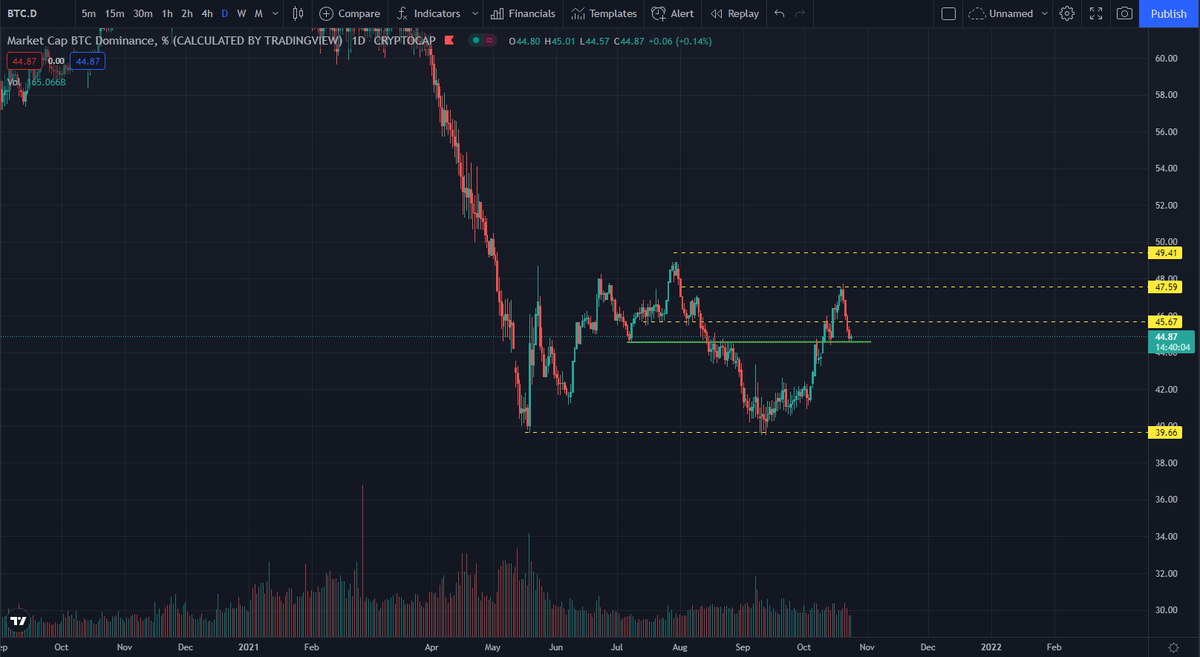
#BTCDOMINANCE IS CURRENTLY TESTING SUPPORT (44.5)