@Jamie1Coutts Love your work Jamie. So if it goes this low can we expect to reach ATH’s on the rebound later this year or early next or would this make it hard for price action to get back to $126k.
$ALB chart: down bad from ATH, but fundamentals screaming upside.
• Best rates via Epsilon aggregator
• Upcoming perps, DCAs, advanced charting
• Community-driven, transparent devs Base ecosystem heating up—$ALB positioned perfectly for memecoin frenzy. Bullish af 👽🔥
$ALB could 50-100x in the bull:
• Base TVL exploding >$4B+ DeFi dominance via @coinbase funnel
•$ALB capped supply real utility fees staking rewards governance
•Vaults + Mothership dropping soon = advanced features rivals lack Low MC $3M high conviction play. Don’t fade👽🛸
🛸Alien Base Weekly Update - January 16th, 2026
🧵💥Our first big launch of 2026 is almost here! We're in the end game for the new Vaults with a goal to have everything ready by midweek for internal testing, then launch by end of week. We're also making the Mothership repo open source this week. Here's your update into what the team has been working on:
1/6
👽 $ALB is quietly building the ultimate degen playground on @base. Limit orders, cheapest swaps, upcoming vaults/Mothership launch, and token gen tools. $AERO dominates liquidity, Alien Base is the trader’s DEX. Sub-3M MC? Massive catch-up potential in 2026 bull. 🚀 #Base#DeFi
🛸Alien Base Weekly Update - January 16th, 2026
🧵💥Our first big launch of 2026 is almost here! We're in the end game for the new Vaults with a goal to have everything ready by midweek for internal testing, then launch by end of week. We're also making the Mothership repo open source this week. Here's your update into what the team has been working on:
1/6
Admittedly, micro caps on @base have been getting absolutely destroyed the past 6 months
But it also isn't the time to get out and leave
It's time to look at the charts and see what the PA is presenting to us
$ALB is bottoming right now, no question and early signs of this are now showing up
Pretty clear to me many other micro caps on @base are going through a similar process
And with the expectation of $BTC going through at least a relief bounce these next few months
I think the speed in which $ALB and micro caps dumped can easily be reversed the other way
We've had whales exiting at the lows (1.7 million $ALB sell on 9th Jan) with the dip quickly been bought up
Seller exhaustion is in, now buyers are finally starting to claim control (if we close above 3.5m)
Slowly, then all at once
🛸Alien Base Weekly Update - January 9th, 2026
🧵👋 Welcome back from the holidays! We're kicking off 2026 with clear priorities: ship Vaults within the next 2 weeks. Once that's live, we're immediately moving to integrate Mothership into the Vaults and begin alpha testing. We're also exploring audit options for the Mothership contracts. Here's your general overview of progress:
1/6
@MerlijnTrader Value your thoughts - however, we know the Market Makers don’t look at charts… let’s be honest, BTC flies when they say it flies. Not what the TA says.
This isn't just a new contract for $AXGT - it's a massive upgrade that will allow it to scale into the AI & DeSci Powerhouse we all expect it to be.
On New Year's Day, @AxonDAO relaunched. Here is the new ca: 0x6112C3509A8a787df576028450FebB3786A2274d
With this new contract comes a number of massive benefits that weren't possible with the old contract, including:
🔹 AUTOMATIC BURNS with every transaction, making the token natively deflationary
🔹 Interoperability with zero-knowledge (zk) systems
🔹 Compatibility with AxonDAO’s Blackwell GPU infrastructure
🔹 Enhanced security and privacy
🔹 15%-35% lower gas costs
🔹 Optimized for dApps and CEXs
I'll be honest, 2025 was rough for most projects, but the team over at Axon is putting the foundation into place to ensure 2026 is the breakthrough year we've all dreamed of! 🚀
WHO CARES?!
STOP watching 15-minute Bitcoin charts.
Bitcoin is ranging between $85k–$90k.
Don’t get emotionally attached to noise.
Zoom out. Look at the bigger picture.
WHY?! 👇
Gold is at all-time highs.
Silver followed — and is now at all-time highs too.
SO WHAT?!
Gold and silver are always first to smell liquidity:
Rate cuts
Quantitative easing
Monetary debasement
They go vertical, everyone notices… and eventually they blow off the top and stall.
THEN WHAT?! 👀
Copper — a metal used in:
Manufacturing
Construction
EVs
Infrastructure
…starts to rise.
Why?
Because liquidity is no longer hiding — it’s being absorbed by the real economy.
Businesses expand.
Hiring resumes.
Risk-on conditions return.
KEY SIGNAL 🔑
COPPER / GOLD
Falls during QT (risk-off)
Rises during QE (risk-on)
That shift just happened weeks ago on the monthly chart.
NEXT DOMINO 🧠
ETHEREUM / BITCOIN
Bitcoin = store of value
Ethereum = risk asset tied to Web3 growth
ETH/BTC historically follows Copper/Gold.
And again — these are MONTHLY charts.
We have months of upside ahead driven by easing and improving liquidity…
while low-T bros spend Christmas tweeting about Bitcoin chopping sideways.
Zoom. TF. Out. I beg you. 📈
Hit the like on this and leave a comment to tell me you get it.
#crypto #bitcoin #ethereum
"Until now Aerodrome & Velodrome have operated across markets that represent about $5B in TVL.
With this expansion Aero will be able to connect more than $80B in global capital."
Aero—coming soon to @ethereum.
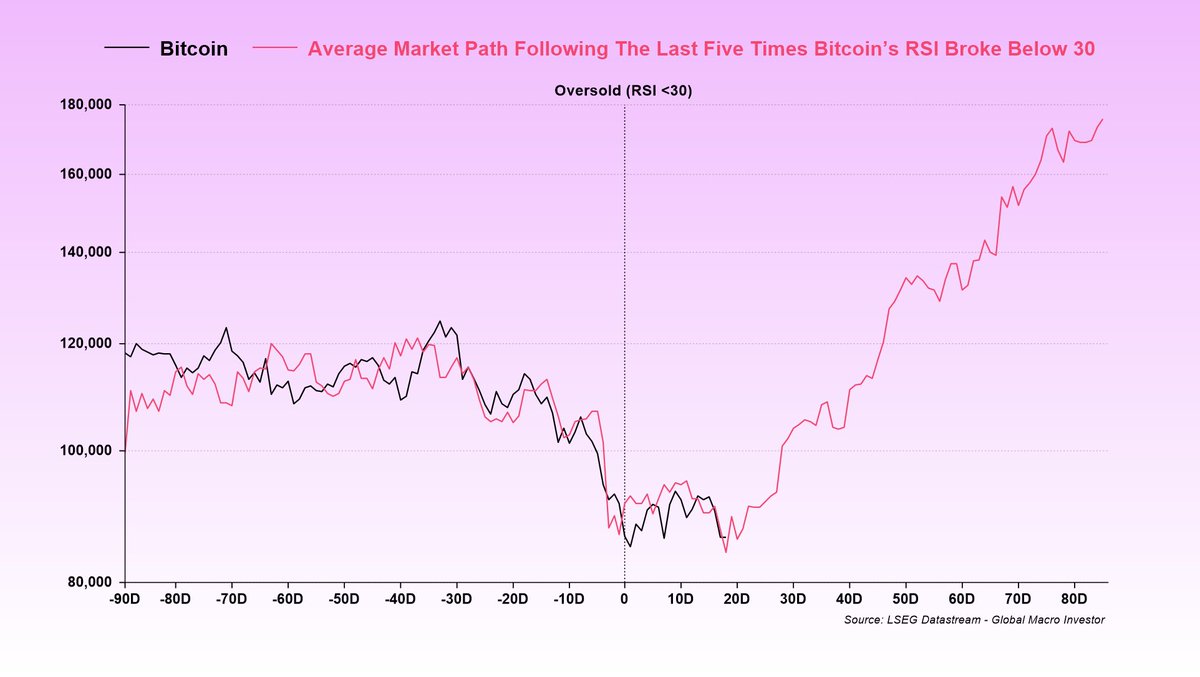
A lot of people have been asking for an update on this chart, so I’ll just leave this here for anyone who needs to see it.
This shows the average BTC trajectory following an oversold RSI reading, with RSI falling below 30 at t=0.
So far, it’s been pretty bang on.
Unless you believe the 4-year cycle is still in play, which we don’t, this chart should hold up contextually over time.
No, it won’t be perfect, but assuming the bull market isn’t already over, it’s a useful chart to keep in mind.
As we’ve outlined many times, based on our work on the business cycle, the current path of financial conditions, and our expectations for overall liquidity, the balance of probabilities is that this cycle extends well into 2026.
In that world, the 4-year cycle is dead.
Remember, the 4-year cycle was never about the halving, despite widespread belief that it is, but instead has always been driven by the public debt refinancing cycle, as outlined in our work at GMI, which post-COVID was pushed out by one year.
In our view, the 4-year cycle is now officially broken because the weighted average maturity of the debt term structure has increased.
And the bigger picture is that there is still a vast amount of interest expense that needs to be monetized, which has far exceeded GDP growth.
Another thing to keep in mind is that bases can take time to form and usually come with plenty of chop before the bigger up-move kicks in.
Finally, let me repeat what I said when I first posted this chart last month.
If you think the bull market is over and we are now facing twelve months of pain, this chart is not for you. Move along...