Chart update for everyone following my setups:
I’m refining my color coding so you can clearly see what I’m doing and why:
🔵 Blue zones = Spot accumulation areas
🟣 Purple zones = Potential futures entry areas (not yet active)
🟥 Red zones = Start of my distribution (where I begin selling spot)
If you see a clearly marked Long/Short setup with SL & TP → future trade
No more guesswork. Full transparency.
👇 Like & Follow @CryptoWaveV
if you appreciate structure over noise.
#Crypto #TradingStrategy #SpotVsFutures #ChartClarity #TA #CryptoTwitter #CryptoWaveVision
Another indicator I like to use when looking for a potential bottom is aggressive spot buy delta.
You can already see the order books starting to refill, but what I’m really watching is whether we get the same kind of spot buying pressure that appeared around previous cycle lows.
I’ve highlighted the delta readings from the historical cycle bottoms in yellow. If Bitcoin reaches the $55k–48k target zone and we see the buy delta expand to similar levels as it did in the past, that would be another very strong signal that a larger cycle bottom is likely being formed.
For now, it’s something worth monitoring closely, because strong spot demand is usually one of the clearest signs that real buyers are stepping back into the market.
$BTC HTF
Bitcoin update:
Bitcoin should now be in the final leg lower of Wave 5 and complete the entire corrective move in the $54,600–48,000 region.
This remains the primary target zone where I expect the current downtrend to find its conclusion and where the probability of a meaningful bullish reaction becomes significantly higher.
$SPX
The big elephant in the room remains the S&P 500.
Over the last several weeks, the S&P has held up remarkably well and hasn’t seen the kind of correction many were expecting. However, from my perspective, the structure has now largely completed itself and I still expect a larger pullback at some point.
Ideally, I’d like to see a flush toward the 6,000 region. Not because I’m bearish long term, but because it would remove one of the biggest remaining concerns — that the S&P could spoil the party later on.
If Bitcoin and the S&P 500 were to sell off together and find their bottoms around the same period, that would be an extremely strong signal for larger allocations. It would create a much cleaner environment to deploy capital again and position for the next major move higher.
And hopefully this time Bitcoin and the S&P can actually rally together afterwards instead of taking turns leading and lagging each other.
GM ☀️
Putting together an update shortly.
Will probably turn it into a thread this time since I only brought my laptop with me. The charts get way too small in the multi-chart layout, so it’s hard to show everything properly.
Good evening from Thailand 🇹🇭
Not at the PC, but my Bitcoin target zone remains unchanged at $55k–48k.
Ideally, I’d also like to see a simultaneous sell-off in the U.S. stock market. If we get that kind of broad capitulation, I’ll be looking to deploy every remaining reserve.
Until then, enjoy some time away from the charts and stop watching the bloodbath 24/7 😄
$BTC
Bitcoin update:
The long position got stopped out. I still believe we eventually get a bullish reaction back above $78k, but the market is showing so much weakness right now that you almost have to expect direct continuation lower.
Like I already mentioned before, that was my final long position for this week. I’m off to Thailand for a month now
Hopefully when I come back, Bitcoin is trading below $55k.
solana:rndrizKT3MK1iimdxRdWabcF7Zg7AR5T4nud4EkHBof
Moved it to break-even now. Do or die. I’m honestly getting tired of this constant pump-and-dump market.
$RENDER
Current watchlist focus: $RNDR.
Render is not only trying to reclaim the 4H trend right above price, but it’s also sitting directly below the daily 200 EMA trend level. I could definitely see a bullish breakout toward the $3 region if we manage to break above the $2 level.
The structure itself unfortunately isn’t particularly clean, but right now I’m mainly paying attention to the strength of the trend. Could be one of the few names setting up for a real breakout here.
$BTC
Bitcoin update:
The long position got stopped out. I still believe we eventually get a bullish reaction back above $78k, but the market is showing so much weakness right now that you almost have to expect direct continuation lower.
Like I already mentioned before, that was my final long position for this week. I’m off to Thailand for a month now
Hopefully when I come back, Bitcoin is trading below $55k.
$BTC
I’ll probably take one final long trade this week. After the take-profit gets reached, I’ll most likely start reducing some of my other long positions as well.
Based on the time model — although I’m generally not a huge fan of trying to call exact tops within specific time windows — there’s a basic principle that says a correction should last at least 33% of the duration of the first impulse.
That means if this really is a corrective move on Bitcoin, it likely shouldn’t peak before Thursday at the earliest.
So the party probably continues until then, but after Thursday I’d start paying very close attention.
One of the biggest mistakes traders make in strong uptrends is obsessing over catching the exact top instead of respecting the trend that’s currently in front of them.
As price keeps pushing higher, many start forcing shorts simply because the potential RR looks attractive.
A counter-trend short might offer 1:10 or even 1:20, while a continuation long may “only” offer 1:2 or 1:3.
Psychologically, the short feels smarter.
But trading is not just about RR.
Probability matters.
A beautiful RR means nothing if the setup itself has a low probability of working.
In strong trends, traders often convince themselves the market has to reverse simply because price already moved too far in their eyes — not because the chart is actually giving bearish confirmation.
That’s the difference.
There is nothing wrong with looking for a top eventually.
But there’s a major difference between preparing for a reversal and blindly shorting every new high.
In my opinion, during strong momentum phases, the smarter approach is often:
follow the trend,
take profits into strength,
and only seriously consider shorts once clear warning signs appear.
Divergences.
Structure breaks.
Momentum shifts.
Until then, fighting the strongest trend on the board just because the imagined payout is larger can become very expensive.
$BTC
Bitcoin update — overall unchanged from yesterday.
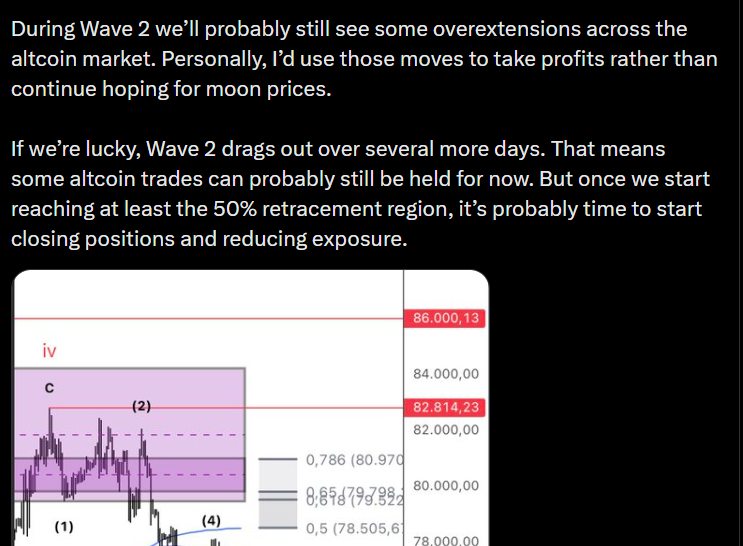
The impulse is confirmed and in my opinion the deeper sell-off is still ahead. At this point, everyone has to decide for themselves whether to place hedges in the $78,500–81,000 region or even start scaling out of spot positions.
The invalidation for the bearish setup would clearly be a break above $82,800. If that happens, we’d have to consider a much more bullish deviation scenario. But as long as we stay below $82,800, the risk of a larger sell-off remains very real.
My primary expectation is still a move into the $54k–48k region, where Bitcoin should finally build a larger bottom and complete the entire corrective structure.
Ideally, we now see another clean three-wave move higher first. It’s important to mention that Wave 2 rallies are often very aggressive and direct — usually strong enough to make people believe we’re breaking bullish again before the market eventually fully rolls over.
If we get a cleaner three-wave move upward here, the short targets can become much more precise. Until then, we still have to work with the broader resistance zone between $78,500 and $81,000.
One more important thing: the final sell-off toward the $55k region should again happen impulsively, meaning in a clear five-wave structure. However, the final Wave 5 of corrections is often extremely choppy and difficult to count properly.
So don’t focus too much on trying to perfectly count every last wave near the end. Focus more on the overall target region between roughly $54,600 and a maximum downside around $48,000.
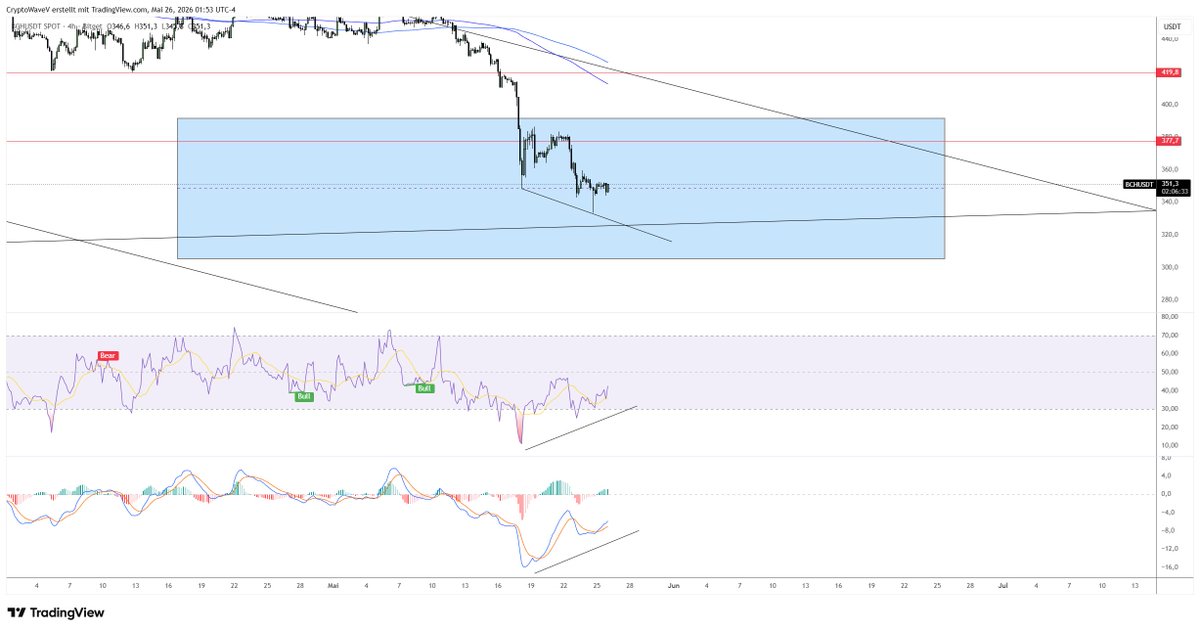
$BCH
I opened a long position with stops at $275. My target is around $1,700, which would give roughly a 1:14 risk-to-reward ratio.
The alternative scenario would be a deeper sell-off into the $200 region. In that case, I’d look to open another long there with stops below $87 and once again target the $1,600 area. That setup would still offer around 1:13 RR.
You could also approach this as a spot trade by allocating 50% at the current price level and another 50% around $200, with a final invalidation below $87.