CS Odessa Brings Business Diagramming to the Next Level with ConceptDraw OFFICE v8 CS Odessa Brings Business Diagramming to the Next Level with ConceptDraw OFFICE v8 https://t.co/e5EhEBPsPg via @CSOdessa
Example 10: Three-Dimensional Axis of Politics
The visual organization in #political groups, organizations, and parties in accordance with certain conceptual axes is accepted in the political sphere.
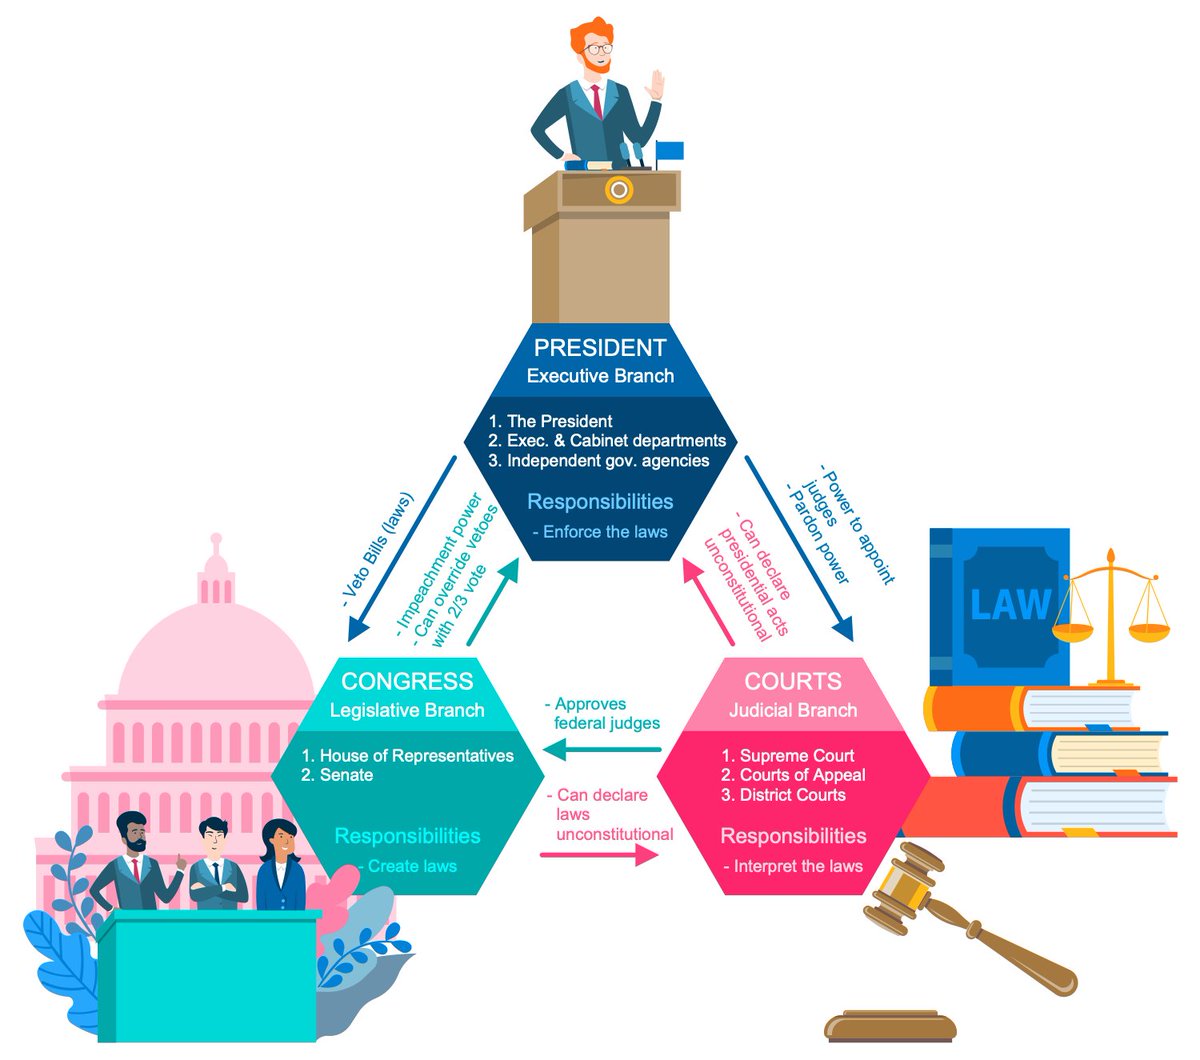
Example 9: Separation of Powers
This political infographic is dedicated to the separation of powers between authorities in France. The governance power is divided into three main branches — executive, legislative, and judicial. #ConceptDraw#PoliticsInfographics
Example 8: Public Sphere
The use of ConceptDraw #clipart allows you to make this #diagram interesting and understandable, to reflect the unification of individuals with the same goal or problem that needs to be solved.
Example 7: Politics of Japan
This sample illustrates the structure of the #political system in #Japan, which constitutes the multi-party bicameral parliamentary representative #democratic constitutional monarchy.
Example 6: Nolan Chart
This sample presents the Nolan Chart in its traditional form. It is a chart designed by American libertarian activist David Nolan in 1969 that expands political view analysis and allows you to take a broad look at libertarianism.
Example 5: E-Government Dimensions
This sample illustrates the dimensions of E-government that uses communication technologies and Internet to provide public services and information to the citizens of a certain country or region.
Example 4: Cleavages in Society
The listed conflicts appeared as the result of modernization processes and revolutions that have taken place in the countries of Western Europe. #ConceptDraw
Business Process Framework eTOM created in ConceptDraw DIAGRAM using the combination of libraries from #EconomyInfographics Solution. An experienced user spent 10 minutes creating this sample.
https://t.co/rppg0vwa26