CONTEXT!
When a spinning top appears after a falling market (often near a recognized support level), it signals that selling momentum may be slowing down. Bears pushed the price lower, but buyers stepped in to absorb the pressure and push it back up.
BULLISH SPINNING TOP 📊
A bullish spinning top is a single-candle chart pattern featuring a small real body positioned centrally, with long upper and lower wicks (shadows) of roughly equal length indicating market indecision where buyers narrowly overcome sellers.
MARKET PSYCHOLOGY!
Prices swing sharply in both directions as buyers and sellers fight for control, but the session ultimately closes right where it opened, showing a temporary stalemate.
BULLISH LONG-LEGGED DOJI📊
A bullish long-legged doji is a single-candlestick reversal pattern that forms at the end of a downtrend, signaling that sellers are losing strength and a potential upward reversal may follow.
TWEEZER BOTTOM📊
A tweezer bottom is a short-term bullish reversal candlestick pattern that appears at the end of a downtrend, It signals that selling pressure is weakening and buyers are stepping in to push the price higher.
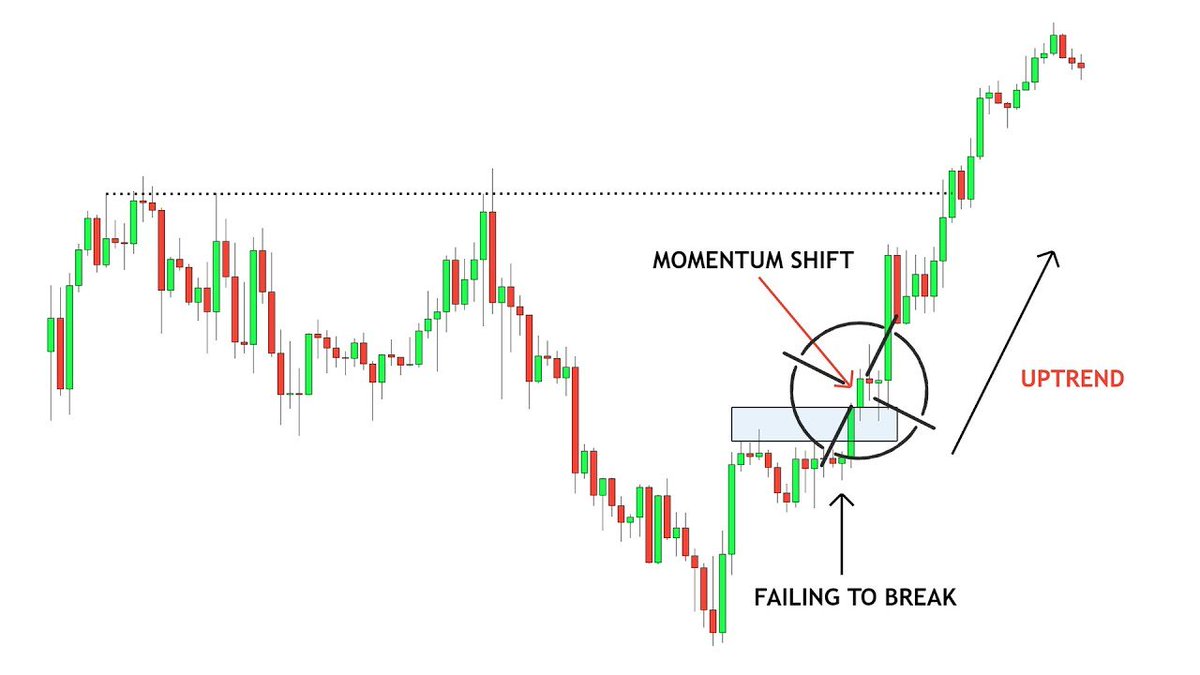
MOMENTUM 📊
Momentum in forex measures the speed, force, and rate of change behind a currency pair's price movement, helping traders see whether a trend is gathering strength or running out of steam.
WHAT LIQUIDITY MEANS!
~ High Liquidity: Means there are many active buyers and sellers.Trades fill fast and close to your expected price, with tighter bid-ask spreads.
~ Low Liquidity:Means fewer participants are trading. Prices can jump (gaps), spreads widen.
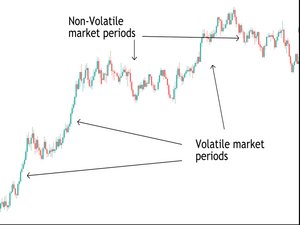
VOLATILITY📊
Volatility in the foreign exchange (forex) market measures the size, speed, and frequency of price swings in a currency pair over a given period. It describes how drastically and rapidly prices move, rather than the direction of the trend.
BULLISH HARAMI CROSS 📊
A Bullish Harami Cross is a two-candlestick reversal pattern that appears at the bottom of a downtrend, signaling that selling pressure is fading and an upward reversal may begin,The signal is more reliable when it appears near a major support level.
HOW IT WORKS & MARKET PSYCHOLOGY!
The first three green candles show strong buying pressure.The fourth large red candle strikes sharply downward, frightening long traders and making them think a trend reversal is underway!
BULLISH THREE LINE STRIKE 📊
A bullish three-line strike is a four-candlestick chart pattern that typically acts as a continuation of an established uptrend.