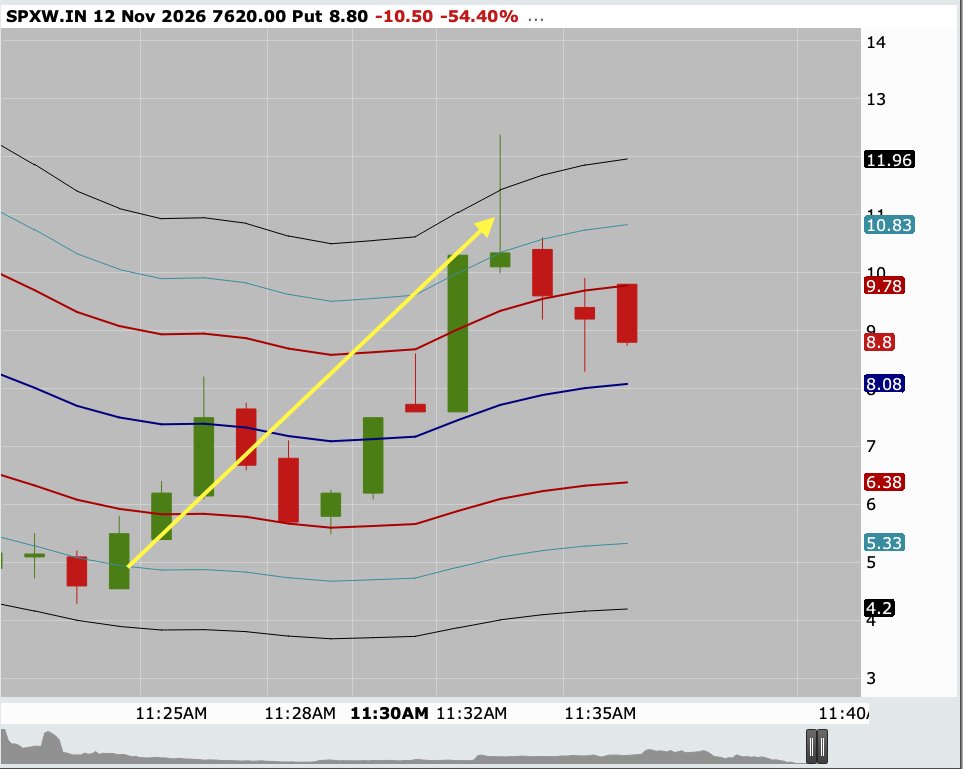
How I buy premium dips on $SPX #0DTE
I have a simple system for deciding direction first, then looking for discounted premium entries
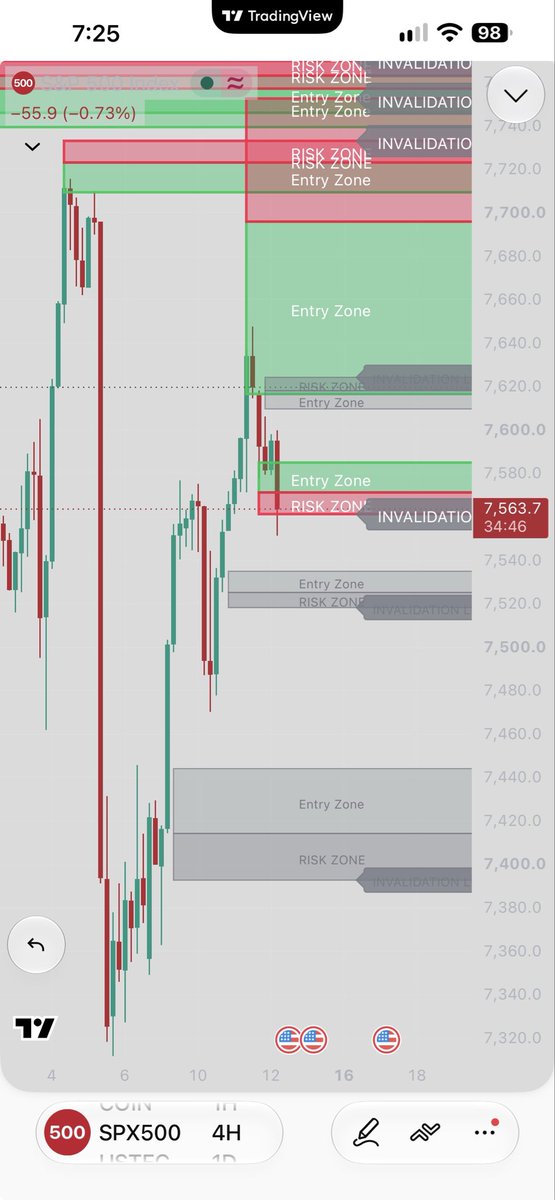
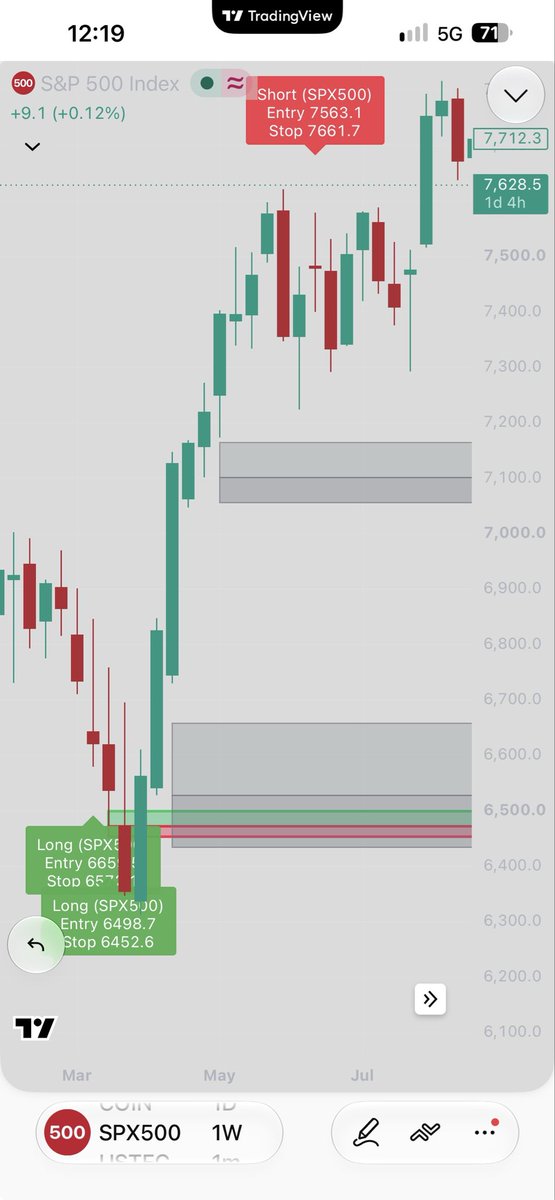
My preferred method is using Fair Value Gaps (FVGs) with my own indicator that marks green entry zones and red risk zones. A close beyond the risk zone invalidates the idea
I post these levels before and during the market if you want to follow along
$SPY $QQQ
Is your girlfriend a spy?
😂 this is my favourite so far, and LOVE that it wasn’t made with AI
If anyone knows who made this please tag them, amazing work
$NVDA
$SPX daily recap
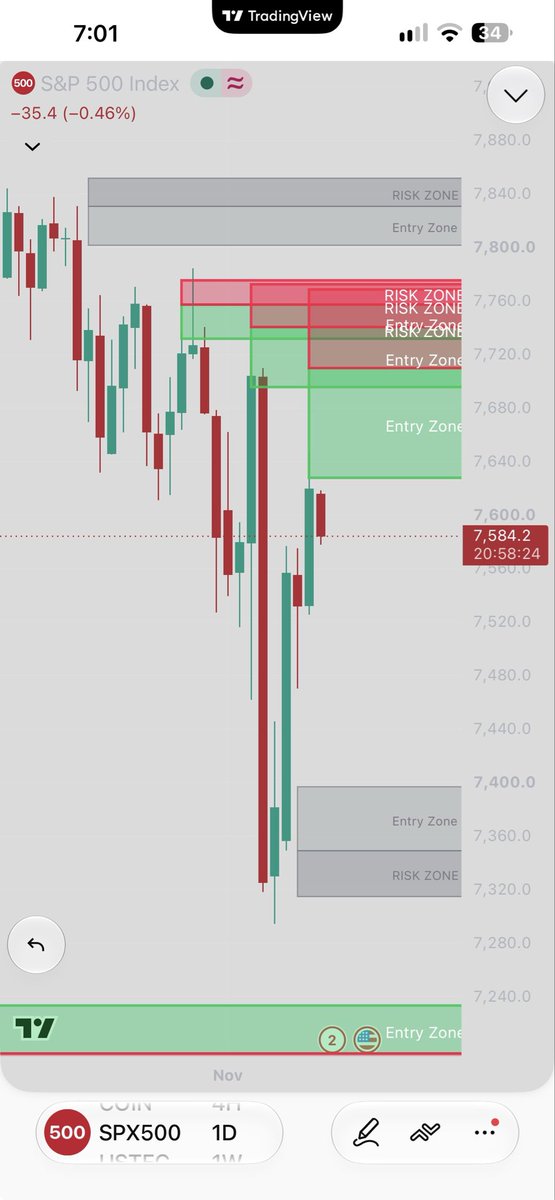
Not much changed on the daily as we wait for PPI tomorrow
We pushed a bit further into resistance and pulled back into the close
Expecting price to hang around here overnight ahead of the data
I’ll check in the morning and see if a lotto makes sense before the release
My lean is lower, but data is 50/50 so if you play, size for a full risk lotto
$SPX $SPY
$SPX daily recap
Went all according to plan today
Caught the first move down
As well as a piece back up as noted in post this morning
“my ideal look from a daily is continue grind up today into resistance, PPI rejects us back into daily support and then we take a run for a true breakout”
The funny thing is the reject may be $NVDA CEO affairs and not PPI 😂
But we got the move up and we are into daily resistance now, we will check things in the morning, but I will be much more cautious with longs now, but prepared to dip buy (low 7400’s) for a swing over the next 1-3 trading days
$SPY $SPX
$SPX 15 min chart is adamant that we are going down
Not in any position, but I prob should zero or hero on the #0DTE runner
Oh well, can’t really manage trades right now so just observing
NFA
$SPX $SPY
$SPX 15 min chart is adamant that we are going down
Not in any position, but I prob should zero or hero on the #0DTE runner
Oh well, can’t really manage trades right now so just observing
NFA
$SPX $SPY
@Gary_Sethi Haha, I know, some days I’m good about it on a runner, other days I just drop a break even stop and walk away
Gotta be good with just watching to be a successful trader
$SPX 15 min chart is adamant that we are going down
Not in any position, but I prob should zero or hero on the #0DTE runner
Oh well, can’t really manage trades right now so just observing
NFA
$SPX $SPY
Back and market has ran back up into yesterday’s highs, we are at the last 15 min resistance zone and through could unlock more upside
Having missed the first couple of hours don’t think I’m interested in trying a long here, also I am content with waiting for data tomorrow, I expect it to set us up for a significant trade
If you think a pull back is due you’d have a tight stop out per the chart below (1-2 closes above the active zone) alternatively new long grey zone below to watch
NFA
$SPY $SPX
Tomorrow, maybe early next week we find out if we dip before 🎅 shows
There is of course another scenario, I’ll get that together over the weekend
$SPY $SPX
@Mr_Derivatives I'm a bull at heart and want the bottom
But, we are triggering a short on my indicator, the last few caught significant pullbacks
my personal opinion is were are re-tracing down 1 more time and then going for ATH's
Santa is coming 🎅
$SPX $SPY
Back and market has ran back up into yesterday’s highs, we are at the last 15 min resistance zone and through could unlock more upside
Having missed the first couple of hours don’t think I’m interested in trying a long here, also I am content with waiting for data tomorrow, I expect it to set us up for a significant trade
If you think a pull back is due you’d have a tight stop out per the chart below (1-2 closes above the active zone) alternatively new long grey zone below to watch
NFA
$SPY $SPX
$SPX 15 min scalp zones into open
I’m likely tied up for the next couple hours and I’ll see if I can get a trade later today, but you can watch PA in these zones for scalps this morning
Remember you need to dip buy premium by predicting a dip price, practice this as much as possible
$SPX continues to follow the path laid out a few days ago
I noted yesterday that resistance will start at 7630 and we have sold off 80 pts since
It was a a large resistance zone so tough to short it with size or short dated cons, either way the focus is on longing a dip
4 hr chart:
It’s trying to invalidate a long (personally i would t long this zone) there is a another long zone around 7535-7515, I think this could be a good spot to try longs today we’ll see. The lower zone of 7440-7400 is what I think is possible if PPI is bad
Hourly chart:
Hourly also currently wicking out of a zone, I personally like the risk reward of lower zones today, but of course supports can create sustained bounces
7540-7520 are areas I’ll have alerts set to observe PA for potential bounces
The market has given wonderful range lately and expect that continue, but it will also be waiting on tomorrows data so not a bad idea to take it easy today
One last thing, I am going to be busy in the am today and tomorrow but will post when I can
Good luck out there today!
$SPY $SPX
$SPX daily recap
Went all according to plan today
Caught the first move down
As well as a piece back up as noted in post this morning
“my ideal look from a daily is continue grind up today into resistance, PPI rejects us back into daily support and then we take a run for a true breakout”
The funny thing is the reject may be $NVDA CEO affairs and not PPI 😂
But we got the move up and we are into daily resistance now, we will check things in the morning, but I will be much more cautious with longs now, but prepared to dip buy (low 7400’s) for a swing over the next 1-3 trading days
$SPY $SPX
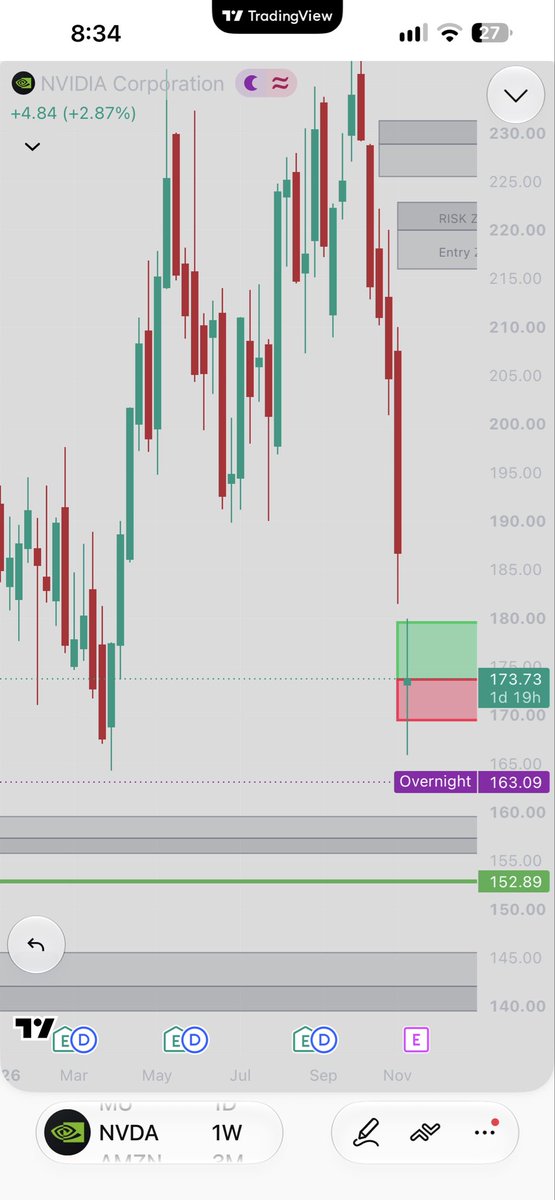
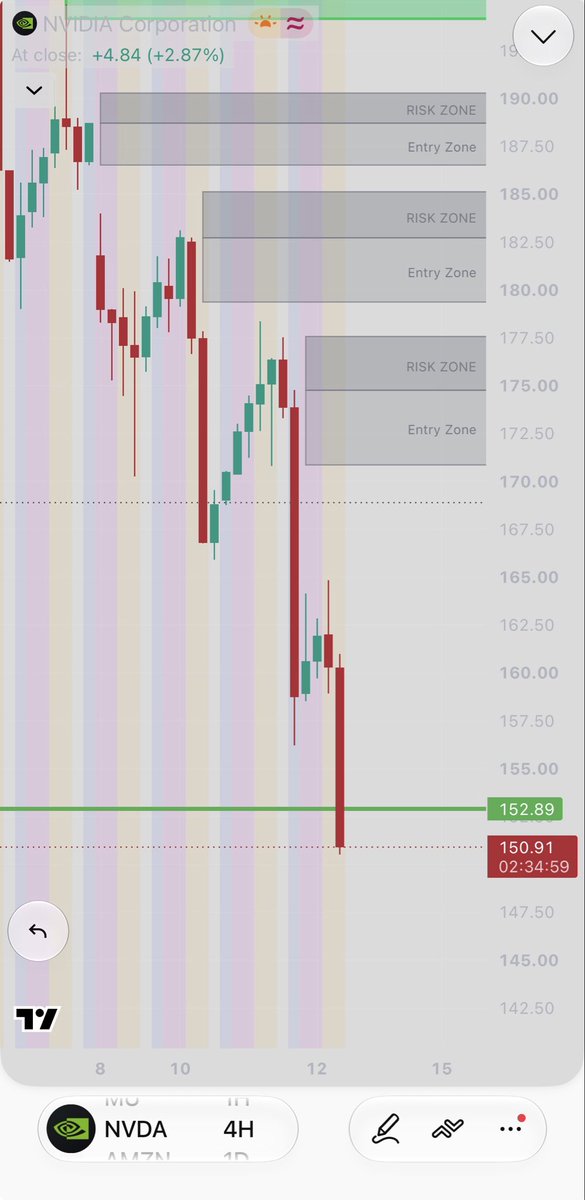
$NVDA meltdown chart
When times are turbulent your best bet is to goto higher and higher timeframes
Yearly chart:
I marked the ‘24 highs at 152.89, this is gonna be a key spot, bulls will want to hold this into year end to create another yearly imbalance to send things even higher
In theory failing to do so could send us to the lower yearly imbalances, but I am not expecting that (would need a global recession for that)
Quarterly chart:
I have an unactivated grey zone starting around 160 down to about 145
If the slide continues this is where I ultimately think we will get caught and picked back up
Weekly chart:
On the weekly chart we can see some confluence with a unactivated grey zone from about 160 down to 155
Originally I was expecting a 165 sweep and go, I’m now hunting 155-160 zone to watch for signs from the bulls
Unless Jensen has more surprises for us
🍿
$SPX 15 min scalp zones into open
I’m likely tied up for the next couple hours and I’ll see if I can get a trade later today, but you can watch PA in these zones for scalps this morning
Remember you need to dip buy premium by predicting a dip price, practice this as much as possible