Super excited to announce the funnest thing I’ve ever worked on… AI views.
Think of it as vibe coding for teamwork.
It transforms boring data into whatever your team can imagine.
And it solves the 5 biggest problems with vibe coding team tools:
Work together. Plan together. Stay ahead of the game together.
Coda is becoming Superhuman Docs: rolling out now, so your workflow can be way more efficient. Learn more about the future of working in our latest blog: https://t.co/tTDLwDPAtr
Not spooky. Better than candy.
AI is solving data analysis.
You can just chat with your data, 24/7.
"compare the number of website visitors in the last 2 halloween days from ga4 and summarize it."
🚀 𝐈𝐧𝐭𝐫𝐨𝐝𝐮𝐜𝐢𝐧𝐠 𝐀𝐈 𝐀𝐧𝐚𝐥𝐲𝐬𝐭 𝟔.𝟎
The last spreadsheet you’ll ever need.
We’ve rebuilt Rows’ AI Analyst to be the smartest and most versatile spreadsheet in the world.
Here’s what’s new:
🔎 𝐄𝐱𝐭𝐫𝐚𝐜𝐭 𝐝𝐚𝐭𝐚 𝐟𝐫𝐨𝐦 𝐏𝐃𝐅𝐬 & 𝐈𝐦𝐚𝐠𝐞𝐬 → Drop in invoices, contracts, or screenshots, and get structured data.
🔗 𝐒𝐦𝐚𝐫𝐭 𝐝𝐚𝐭𝐚 𝐜𝐨𝐧𝐧𝐞𝐜𝐭𝐨𝐫𝐬 → Build reports from GA4, Search Console, and ad platforms — all with AI.
⚡ 𝐅𝐚𝐬𝐭𝐞𝐫 & 𝐬𝐡𝐚𝐫𝐩𝐞𝐫 → Whether it’s a quick column insert or a full forecasting model, Analyst now feels instant on the small stuff and thoughtful on the big stuff.
From a simple VLOOKUP to an executive dashboard, it just works.
✨ Available today. For everyone. On all plans.
After more than a million AI tasks executed, and 2 years of continuous improvements, we're releasing a Benchmark that stacks Rows against other spreadsheets
Rows is the smartest of them all.
The best spreadsheet for You is an AI Spreadsheet.
🚀 The AI Spreadsheet Benchmark is here!
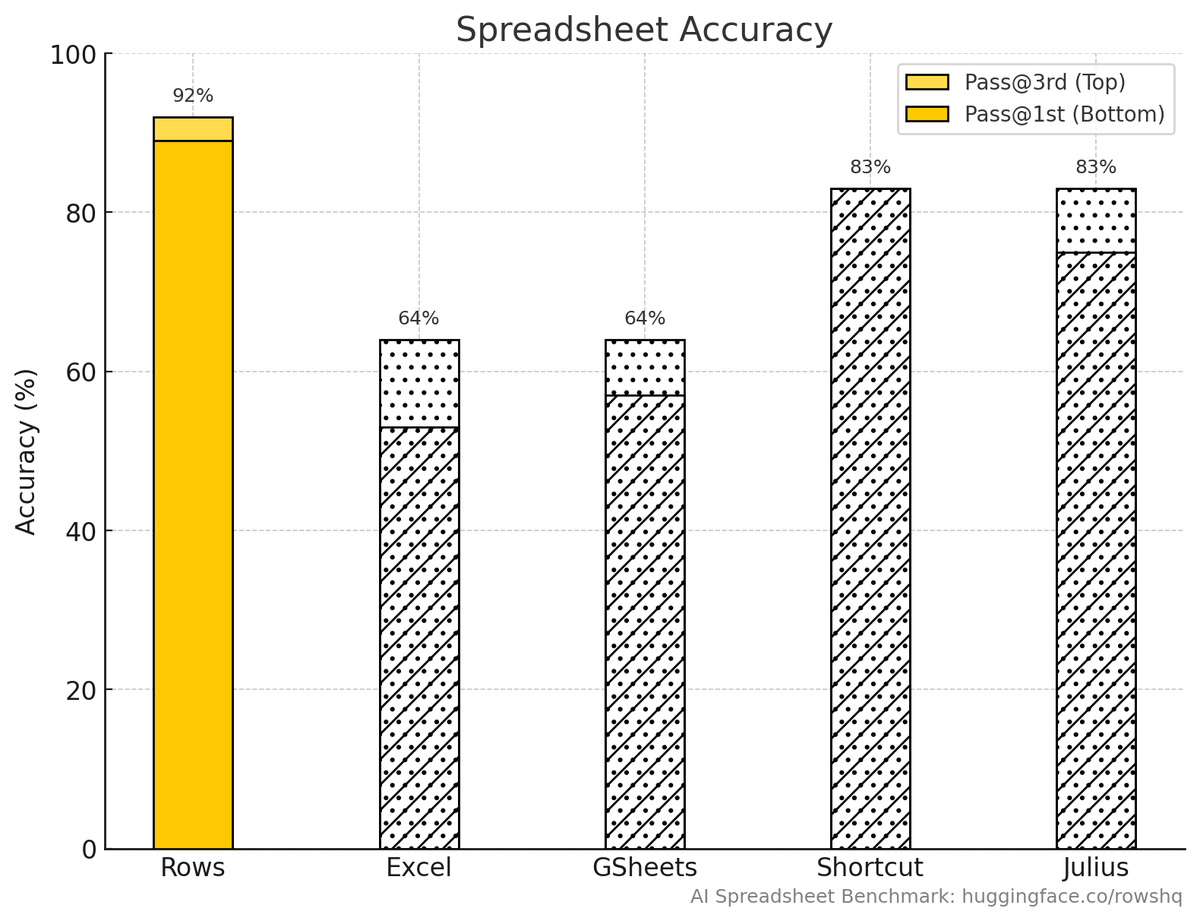
We worked on a 53-task benchmark to evaluate 5 AI spreadsheets. Rows AI Analyst leads with 89% accuracy and 74% adaptive outputs.
It's all public. Feel free to challenge it with your own spreadsheet tasks!
Full results & dataset👇
Announcing 𝗧𝗵𝗲 𝗔𝗜 𝗦𝗽𝗿𝗲𝗮𝗱𝘀𝗵𝗲𝗲𝘁 𝗕𝗲𝗻𝗰𝗵𝗺𝗮𝗿𝗸
We compared Rows with Excel Copilot, Google Sheets + Gemini, and two AI newcomers across a series of data analysis tasks using real-world datasets.
This is a public, recurring benchmark, available on @huggingface for anyone to see, download, and replicate.
1/n
Data stuck in PDFs and screenshots? That ends now.
We just launched Rows Vision. Upload a file, and it turns into a spreadsheet.
No copy-paste. No manual entry.
Try it → https://t.co/7i3IU5Vhk5
Python in Rows #4: The Attrition Prediction 🔍
Rows 🥊 Google Sheets (w/ Gemini)
Task: Predict the likelihood of an employee leaving the company using historical HR data.
🎥 Watch the match unfold.
Discover more at: https://t.co/Kvp9Lo2O30
Python in Rows #1: The Forecast Showdown 🔮
Rows 🥊 Excel (w/ Copilot)
Task: Forecast the next 3 days of revenue from raw daily order data.
🎥 Watch the match unfold.
Discover more at: https://t.co/Kvp9Lo2O30
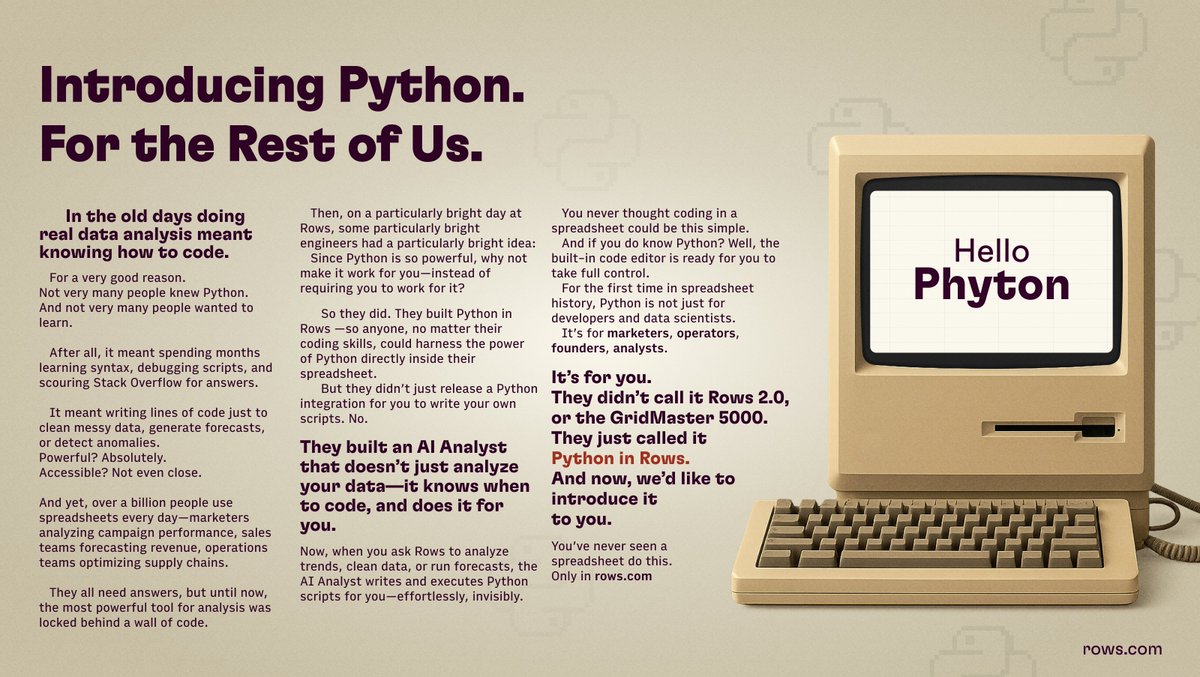
In the old days doing real data analysis meant knowing how to code.
For a very good reason.
Not very many people knew Python. And not very many people wanted to learn.
After all, it meant spending months learning syntax, debugging scripts, and scouring Stack Overflow for answers. It meant writing lines of code just to clean messy data, generate forecasts, or detect anomalies.
Powerful? Absolutely.
Accessible? Not even close.
And yet, over a billion people use spreadsheets every day—marketers analyzing campaign performance, sales teams forecasting revenue, operations teams optimizing supply chains. They all need answers, but until now, the most powerful tool for analysis was locked behind a wall of code.
Then, on a particularly bright day at Rows, some particularly bright engineers had a particularly bright idea: since Python is so powerful, why not make it work for you—instead of requiring you to work for it?
So they did. They built Python in Rows —so anyone, no matter their coding skills, could harness the power of Python directly inside their spreadsheet.
But they didn’t just release a Python integration for you to write your own scripts. No.
They built an AI Analyst that doesn’t just analyze your data—it knows when to code, and does it for you.
Now, when you ask Rows to analyze trends, clean data, or run forecasts, the AI Analyst writes and executes Python scripts for you—effortlessly, invisibly.
You never thought coding in a spreadsheet could be this simple.
And if you do know Python? Well, the built-in code editor is ready for you to take full control.
For the first time in spreadsheet history, Python is not just for developers and data scientists. It’s for marketers, operators, founders, analysts.
It’s for you.
They didn’t call it Rows 2.0, or the GridMaster 5000.
They just called it Python in Rows.
And now, we’d like to introduce it to you.
🚨 New AI feature drop: The AI Cell.
The cell is the prompt. Just type "=" and
✅ Say what you want
✅ Ask for edits
✅ Get charts
No syntax. Just talk to your spreadsheet.
Demo by my co-founder @patife 👇
2nd launch of the day!
After launching our AI for mobile, i'm now announcing our next-gen AI 🤖
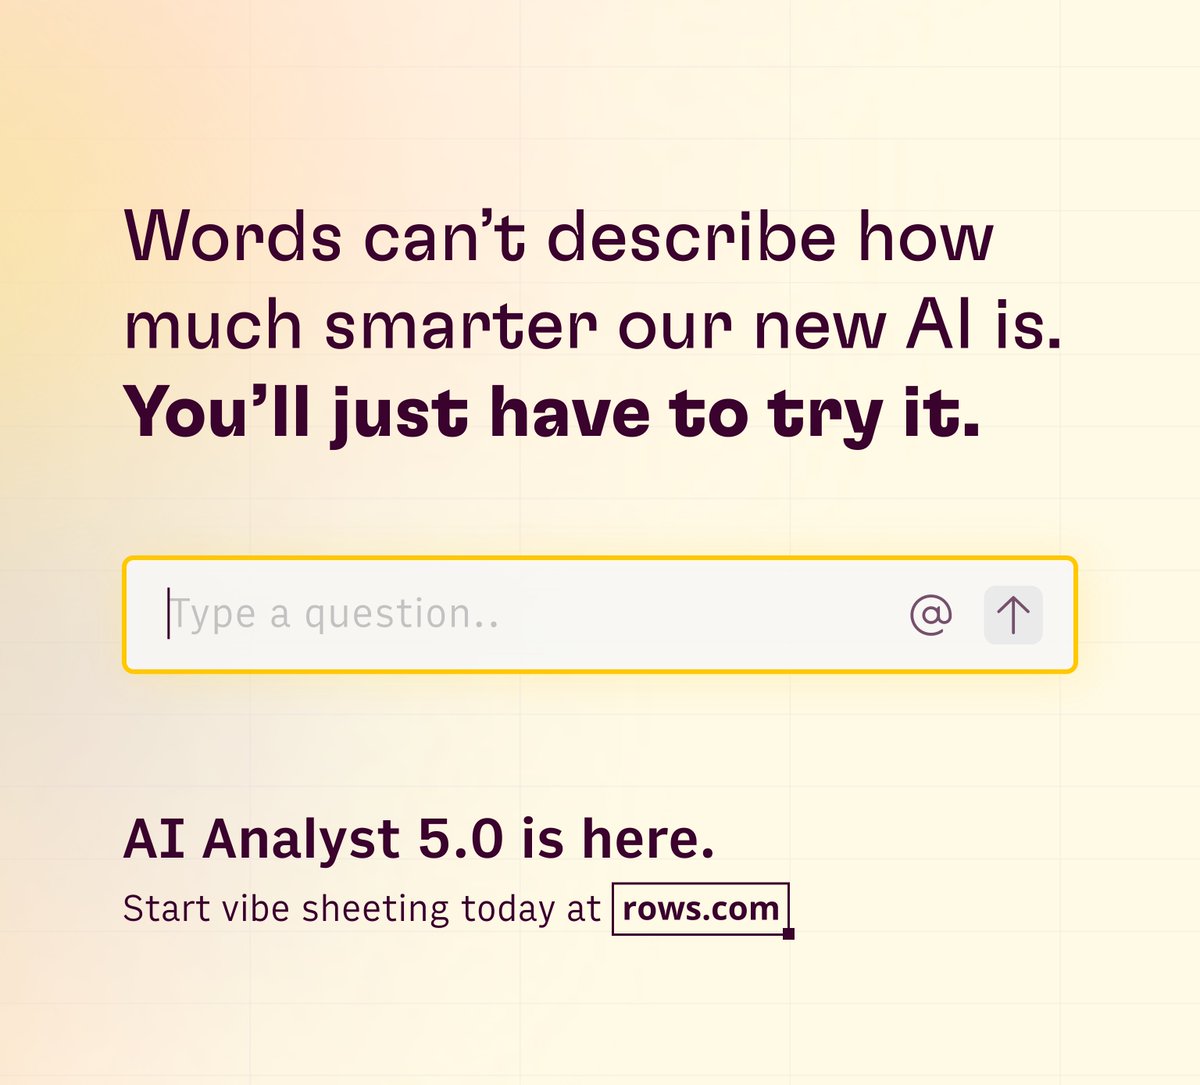
Welcome AI Analyst 5.0!
It's a new AI built from the ground up to take on the hardest spreadsheet tasks.
It can create charts, slice data, create-complex-analysis-in-one-shot-like-cohorts, it can use python (dynamically) to solve your requests, it can beautify your tables too.
Here's me doing a Cohort analysis (or rather, the AI doing it for me).
Start vibe sheeting today!!
What if you never had to write a VLOOKUP again?
Starting today, you don’t.
Say hello to the AI Analyst 4.0 ✨ with Multi-Table Intelligence.
Now, you can put the analyst to work across your entire spreadsheet.
Use the '@' symbol to reference any table in your spreadsheet and trigger Multi-Table Intelligence.
You’ll never have to write a VLOOKUP again.
Multi-Table Intelligence is available today—for everyone, on every plan.
Ṱhis is the story of the Marketer who finished his work on time
A story that’s only possible with a spreadsheet that does more.
That’s connected to your business data.
That crunches numbers with you.
That build your reports for you.
That looks the par.
You’ve never seen a spreadsheet do this.