#BTC Update
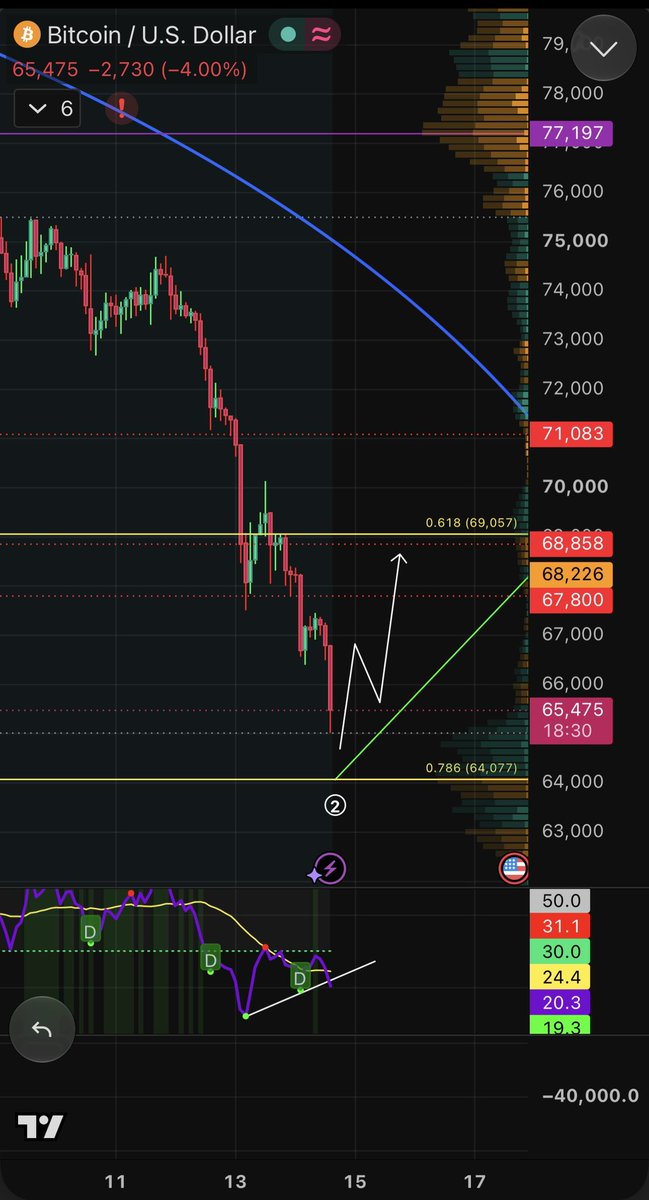
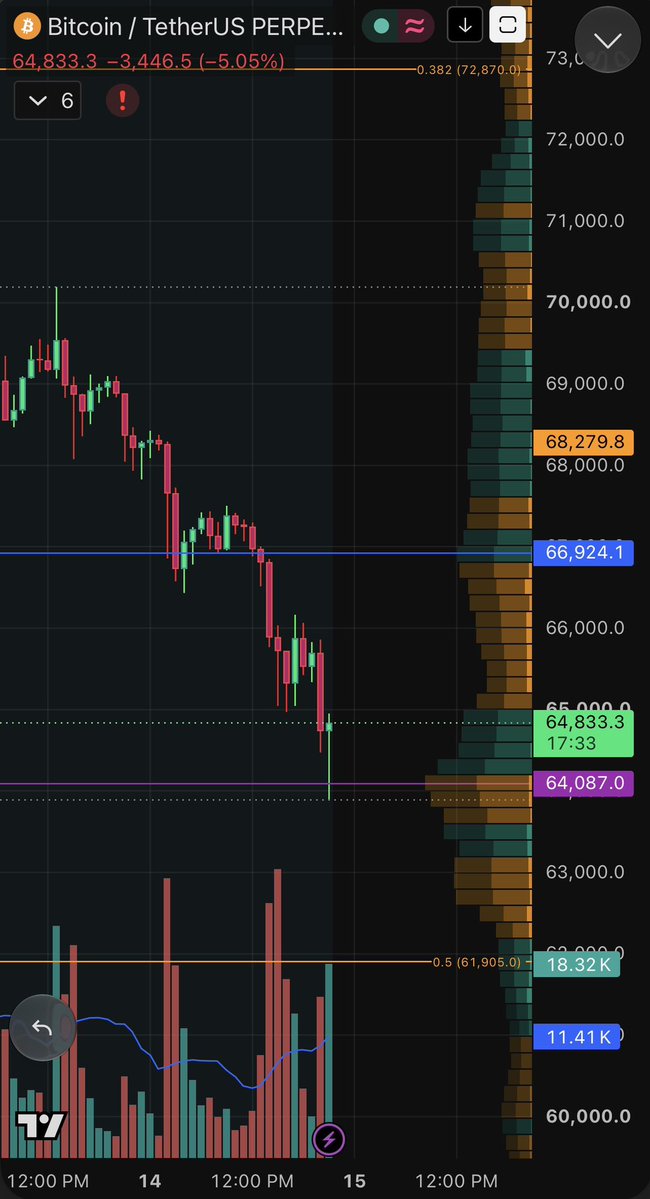
#BTC almost hit my dip price ✅
Exactly as predicted! 🎯
Bitcoin bounce from our zone and playing out the same Elliott Wave pattern from my previous analysis.
Price respecting key levels perfectly. This is why TA matters! 📈
#BTCUSD#ElliottWave#Crypto
#Bitcoin
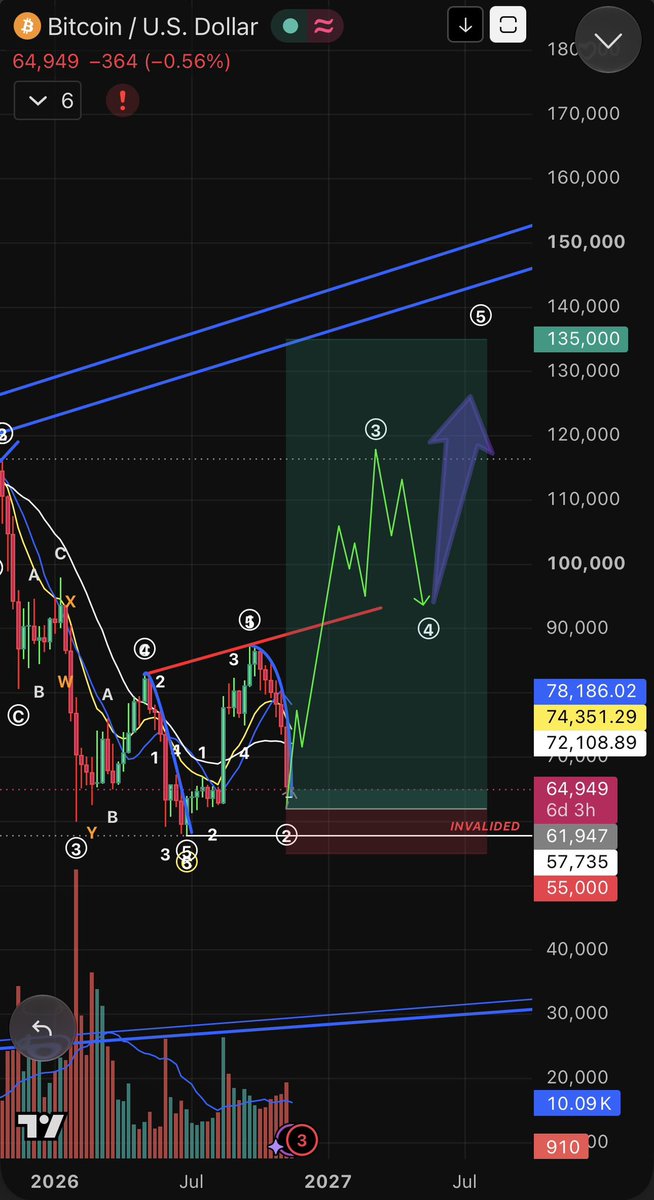
BTC is forming a bullish structure. If rising support holds, Wave 3 could target $115K–$120K, followed by Wave 5 towards 130k- $135k
Invalidation 57k
Key support is everything. 📈
#BTC#Bitcoin#ElliottWave#trend
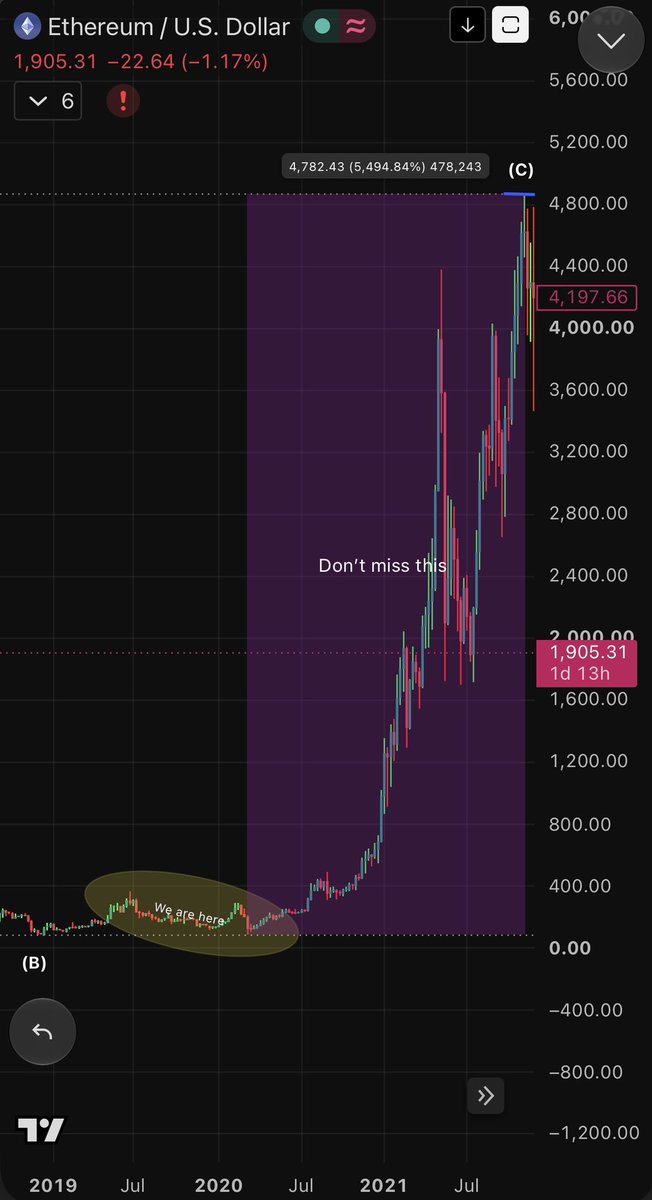
#ETH REPEATING ITS 2020 BULL RUN
The same pattern that preceded ETH’s 2020 bull run appears to be forming again in the current market.
History doesn’t repeat perfectly, but these similarities are hard to ignore.
Could another massive bull run be ahead? 🚀
#BullRun#Ethereum
ethereum:native
2018–2020 WE ARE HERE 👀
The market may look boring, uncertain, and frustrating right now, but this is exactly where long-term opportunities are built.
History doesn’t repeat perfectly, but it often rhymes
Don’t miss this phase. 🚀
#ETH@DrProfitCrypto
ETHEREUM BIGGER MOVE AHEAD? 👀
$1,860 is the key support. If it holds, ETH could target $2,434 → $3,009 → $3,520
Patience is key. The bigger picture matters. 🚀
#ETH#Ethereum#Crypto#ElliottWave
ethereum:native
2018–2020 WE ARE HERE 👀
The market may look boring, uncertain, and frustrating right now, but this is exactly where long-term opportunities are built.
History doesn’t repeat perfectly, but it often rhymes
Don’t miss this phase. 🚀
#ETH@DrProfitCrypto
ethereum:native
2018–2020 WE ARE HERE 👀
The market may look boring, uncertain, and frustrating right now, but this is exactly where long-term opportunities are built.
History doesn’t repeat perfectly, but it often rhymes
Don’t miss this phase. 🚀
#ETH@DrProfitCrypto
#Bitcoin
BTC is forming a bullish structure. If rising support holds, Wave 3 could target $115K–$120K, followed by Wave 5 towards 130k- $135k
Invalidation 57k
Key support is everything. 📈
#BTC#Bitcoin#ElliottWave#trend
bitcoin:native 1D Analysis
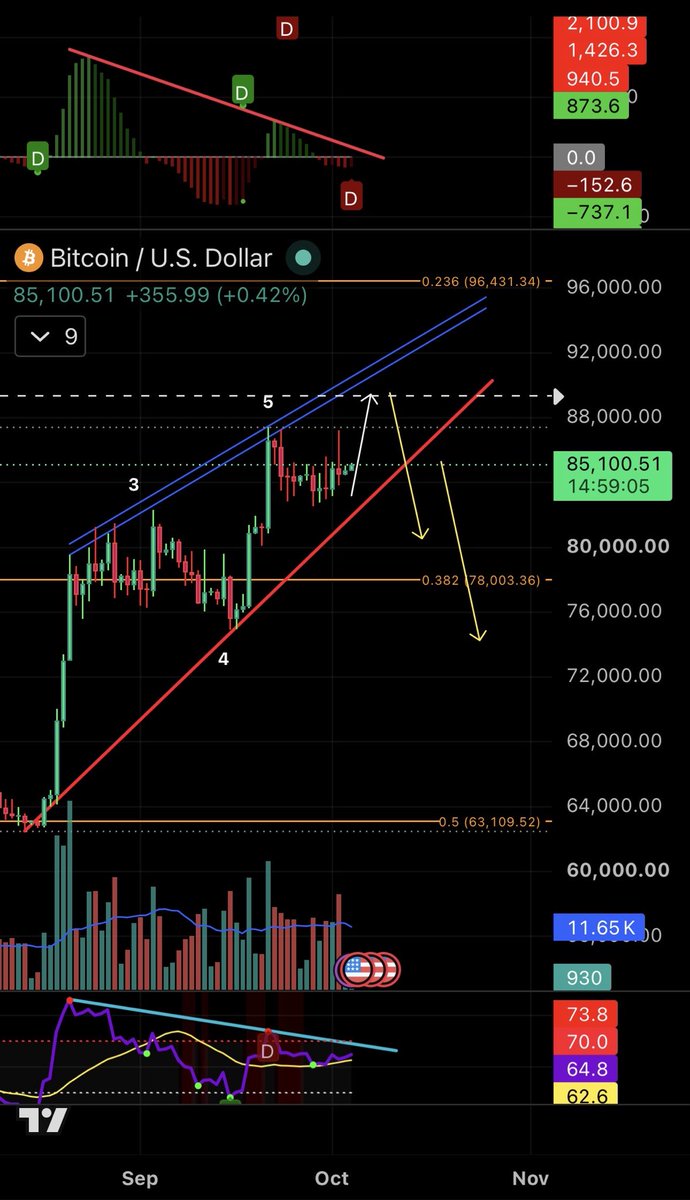
Rising Wedge forming on the daily.
Volume, MACD and RSI are all showing bearish divergence.
Local High expected around 6 Oct
Everyone will FOMO into longs at the top.
Then a hard dump: weak hands panic sell at the lows.
NFA
#Bitcoin#BTC#Crypto #BTCUSDT #BitcoinPrice #Bear #CryptoTrading #RANADANI #Charts
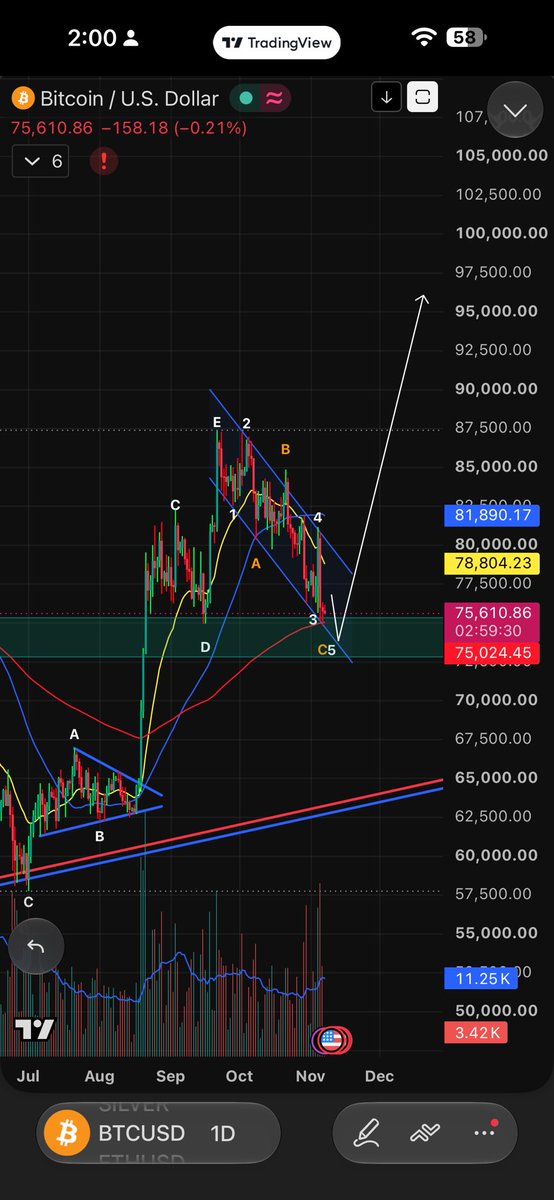
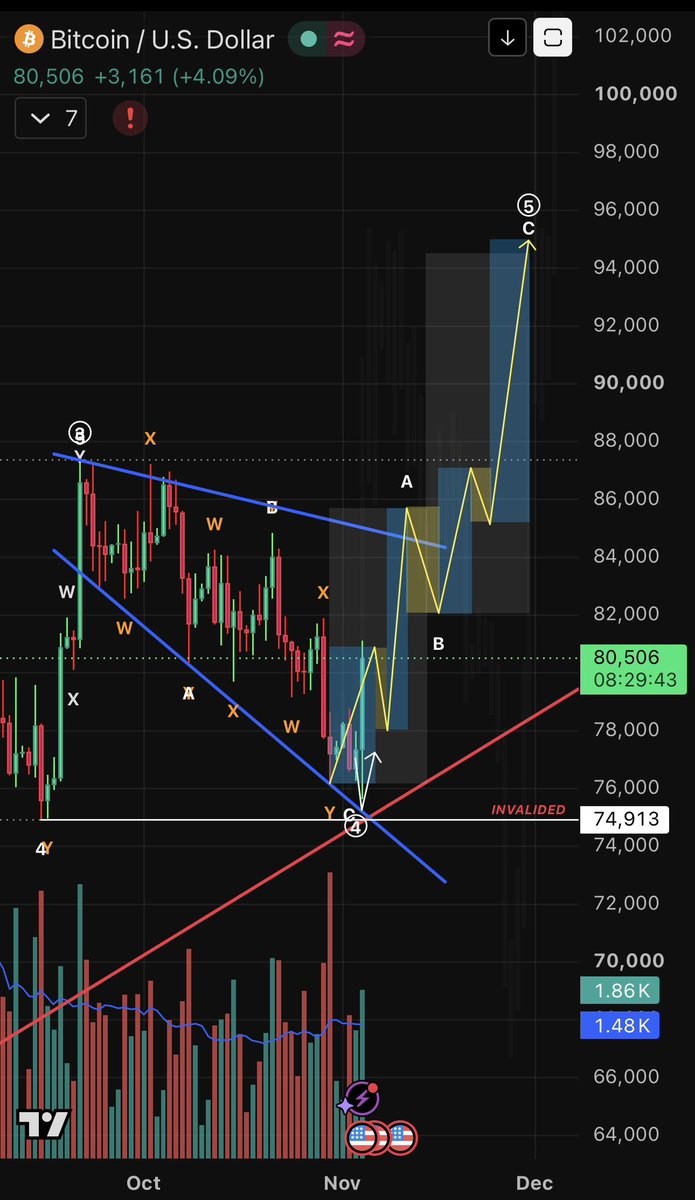
₿TCUSD – Elliott Wave Analysis 1D
Bullish Scenario – Wave 4 Correction Nearing Completion
Bitcoin appears to be forming a complex corrective structure (W-X-Y) within a larger Elliott Wave sequence.
After completing the previous impulsive advance toward the $87K region, BTC entered a corrective phase, trading inside a descending channel.
Wave Count: The current decline is being interpreted as a potential Wave 4 correction.
Corrective Pattern: A complex W-X-Y structure may be developing.
Key Support: $75,000–$76,000 is an important support and potential reversal zone.
Trendline Support: The long-term ascending trendline adds confluence to this area.
Resistance: The descending blue trendline is the key resistance to watch.
⏳Bullish
If Bitcoin successfully holds the $75K–$76K support zone and confirms a breakout above the descending resistance, the next potential upside targets are:
1.$80,000–$82,000
2.$85,000–$87,000
3.$90,000
4.$95,000 – Major upside target
I am watching this structure closely for a potential completion of Wave 4 and the beginning of the next bullish impulsive move (Wave 5).
#BTC #Bitcoin #BTCUSD #ElliottWave #TechnicalAnalysis #CryptoTrading #BitcoinAnalysis #predictions @DrProfitCrypto
₿TCUSD – Elliott Wave Analysis 1D
Bullish Scenario – Wave 4 Correction Nearing Completion
Bitcoin appears to be forming a complex corrective structure (W-X-Y) within a larger Elliott Wave sequence.
After completing the previous impulsive advance toward the $87K region, BTC entered a corrective phase, trading inside a descending channel.
Wave Count: The current decline is being interpreted as a potential Wave 4 correction.
Corrective Pattern: A complex W-X-Y structure may be developing.
Key Support: $75,000–$76,000 is an important support and potential reversal zone.
Trendline Support: The long-term ascending trendline adds confluence to this area.
Resistance: The descending blue trendline is the key resistance to watch.
⏳Bullish
If Bitcoin successfully holds the $75K–$76K support zone and confirms a breakout above the descending resistance, the next potential upside targets are:
1.$80,000–$82,000
2.$85,000–$87,000
3.$90,000
4.$95,000 – Major upside target
I am watching this structure closely for a potential completion of Wave 4 and the beginning of the next bullish impulsive move (Wave 5).
#BTC #Bitcoin #BTCUSD #ElliottWave #TechnicalAnalysis #CryptoTrading #BitcoinAnalysis #predictions @DrProfitCrypto
₿TCUSD – Elliott Wave Analysis 1D
Bullish Scenario – Wave 4 Correction Nearing Completion
Bitcoin appears to be forming a complex corrective structure (W-X-Y) within a larger Elliott Wave sequence.
After completing the previous impulsive advance toward the $87K region, BTC entered a corrective phase, trading inside a descending channel.
Wave Count: The current decline is being interpreted as a potential Wave 4 correction.
Corrective Pattern: A complex W-X-Y structure may be developing.
Key Support: $75,000–$76,000 is an important support and potential reversal zone.
Trendline Support: The long-term ascending trendline adds confluence to this area.
Resistance: The descending blue trendline is the key resistance to watch.
⏳Bullish
If Bitcoin successfully holds the $75K–$76K support zone and confirms a breakout above the descending resistance, the next potential upside targets are:
1.$80,000–$82,000
2.$85,000–$87,000
3.$90,000
4.$95,000 – Major upside target
I am watching this structure closely for a potential completion of Wave 4 and the beginning of the next bullish impulsive move (Wave 5).
#BTC #Bitcoin #BTCUSD #ElliottWave #TechnicalAnalysis #CryptoTrading #BitcoinAnalysis #predictions @DrProfitCrypto