why do clients keep challenging your weekly paid media report?
usually not because the analysis is wrong
it’s because the report shows the conclusion…
but not enough of the evidence behind it
so you end up reopening Looker Studio and defending every insight again
we think a better report should do more of that work for you:
insight → evidence → implication → action
less “trust me.”
more “here’s why”
#buildinpublic #dataanalytics #mediaagency #datareport
After I shared our small data reporting pilot, a few teams reached out with the same question:
“What do we actually need to send you?”
The answer is simple:
one existing data report + the data behind it.
Within 5 business days, we’ll build a reusable AI data reporting workflow around it and add the first version to your https://t.co/mDUyAKANzU account.
The first custom workflow is free.
If your team is still spending hours every week putting together data reports for client after client, we’re testing a better way.
We’re running a small pilot at ExcelDashboard AI.
Send us one data report you already use, plus the data behind it. We’ll help turn it into a reusable AI data reporting workflow.
So next time, you don’t start from zero.
Upload the new data, let AI prepare the first draft, then review, make a few changes, and send it out.
The first template is completely free.
If repetitive data reporting is eating up your team’s time, tell us about it here:
👉https://t.co/ihfcNXVYKe
Do research reports really need to take days to create?
Most of the time isn’t spent thinking.
It’s spent searching for information, organizing data, formatting slides, and turning scattered insights into a professional report.
That’s why we built AI Research Report in https://t.co/mDUyAKANzU
Just tell AI what you want to research, and it will search the web, analyze information, organize key insights, and create a professional research report in minutes.
And it doesn’t stop there.
You can keep improving your report:
Change the structure
Add more data
Refine the insights
Then export it as a fully editable PowerPoint.
From a research idea to a presentation-ready report.
ExcelDashboard AI is your AI Reporting Agent, helping you spend less time building reports and more time thinking about what matters.
We’re still improving every day.
If you try it, we’d love to hear your feedback.
AI-generated reports look impressive—until you need to change something.
And in real work, you always need to change something.
The direction changes. The key message changes. Your boss changes their mind.
That’s why everything created by https://t.co/mDUyAKANzU stays editable.
Charts, text, and the full report.
Just tell the AI what to change, and it updates the report for you.
No rebuilding. No manual page-by-page edits.
Because generating a report is easy.
Making it useful is the whole point.
#AIReport #ExcelDashboard #DataAnalysis #AITools #Productivity
Most AI tools can generate a report.
But now, the report can also review and edit itself.
Just give one instruction, like:
“Focus only on sales data. Do not analyze membership data.”
https://t.co/mDUyAKANzU checks every page and updates the titles, charts, and analysis automatically.
No rebuilding. No page-by-page editing.
One prompt changes the whole report.
#AIReport #ExcelDashboard #DataAnalysis #AITools #Productivity
You’re not bad at data analysis.
You’re just wasting too much time building Excel dashboards.
Cleaning data. Searching for formulas. Fixing charts.
Now, upload your Excel file to https://t.co/mDUyAKANzU, and let AI build a complete, editable dashboard in minutes.
Stop fighting with spreadsheets. Start using the data.
#Excel #ExcelTips #ExcelDashboard #DataAnalysis #AITools #Productivity
Some clustered bar charts can be easier to understand as radar charts.
Radar charts work especially well when you’re comparing several things across the same dimensions, such as products by price, features, ratings, and growth.
With https://t.co/mDUyAKANzU, you can switch to a radar chart with one click.
Or simply tell AI:
“Turn this chart into a radar chart.”
No rebuilding. No manual setup.
Just try a different view and see which chart tells the story better.
Sometimes an AI-generated report gets the content right, but one page still feels messy.
Too much text.
The layout feels off.
The key point is hard to see.
With https://t.co/mDUyAKANzU, you don’t need to delete the page and start again.
Just open AI Edit and type:
“Make this page cleaner and highlight the three most important findings.”
Our AI will reorganize the page, clean up the layout, and make the key insights easier to see.
Generated reports are rarely perfect on the first try. The important part is being able to improve them quickly.
If your manager has to do the math, your chart has already failed.
Don't just show two bars. Show the answer.
Difference Markers help your charts explain what changed, not just display the data.
In https://t.co/TKPYWBCgrn, AI can add difference labels in one click.
Your chart may not need more data.
It may just need one clear benchmark.
With https://t.co/TKPYWBCgrn, AI Edit can automatically calculate the average and add an average line to your chart in one click.
Now your audience can instantly see what’s above average, what’s below it.
AI reports are no longer just generated.
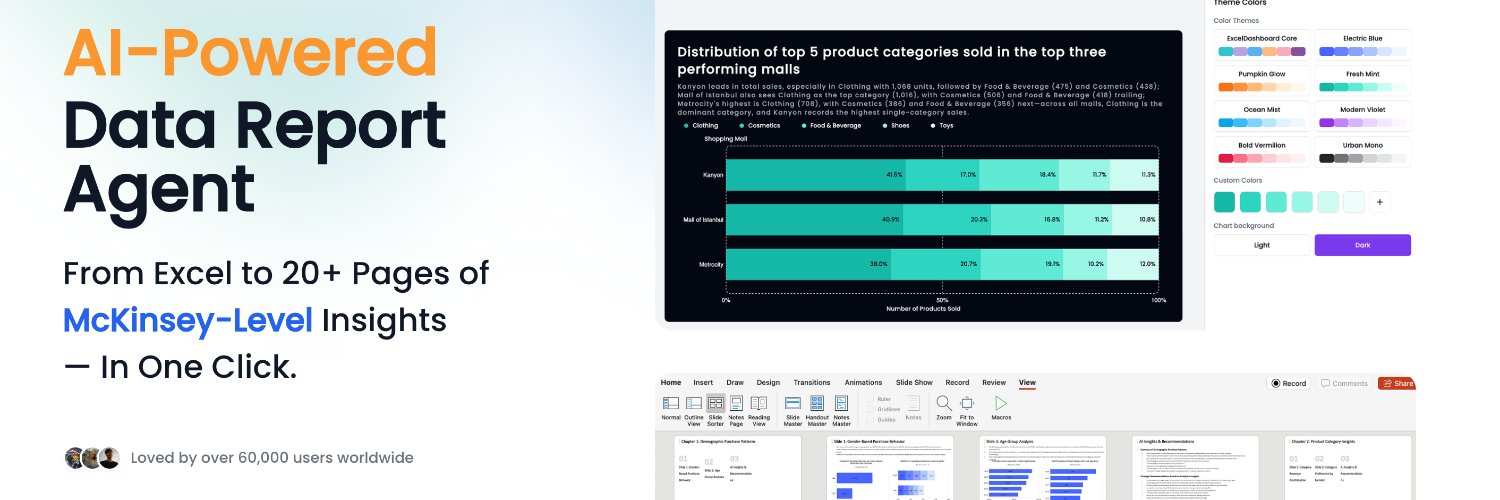
With https://t.co/TKPYWBCgrn 4.0, your data report can now be built, edited, refined, and improved with an AI Agent.
From raw data to insights, charts, visuals, and presentation-ready reports — all in one workflow.
New to data reports? Don’t just dump charts. Use https://t.co/TKPYWBBIBP to turn Excel data into clear insights, charts, and presentation-ready reports.
The worst part of any report? Going from raw data to done. The worse part? Your boss wants it in 20 min 😮💨 Here's how I cheat the deadline with https://t.co/TKPYWBCgrn 👇#excel#dataanalysis#spreadsheets#productivity#aitool
Deleting blank rows, fixing date formats, rebuilding the same report every month — that's not analysis, that's grunt work. Hand the repetitive stuff to https://t.co/TKPYWBCgrn: upload your Excel, get a full draft report, tweak it with AI, export an editable PowerPoint.
73,000 rows of store data → a finished, editable report in 3 steps. Upload → Generate → Download. That's the whole thing 👇 #ExcelTips#DataAnalysis#RetailOps#AItools
Everyone's panicking about AI replacing them. Mine just deleted the most tedious part of my finance job — turning raw Excel into a real analysis report. Here's how. #ai#finance#excel#futureofwork