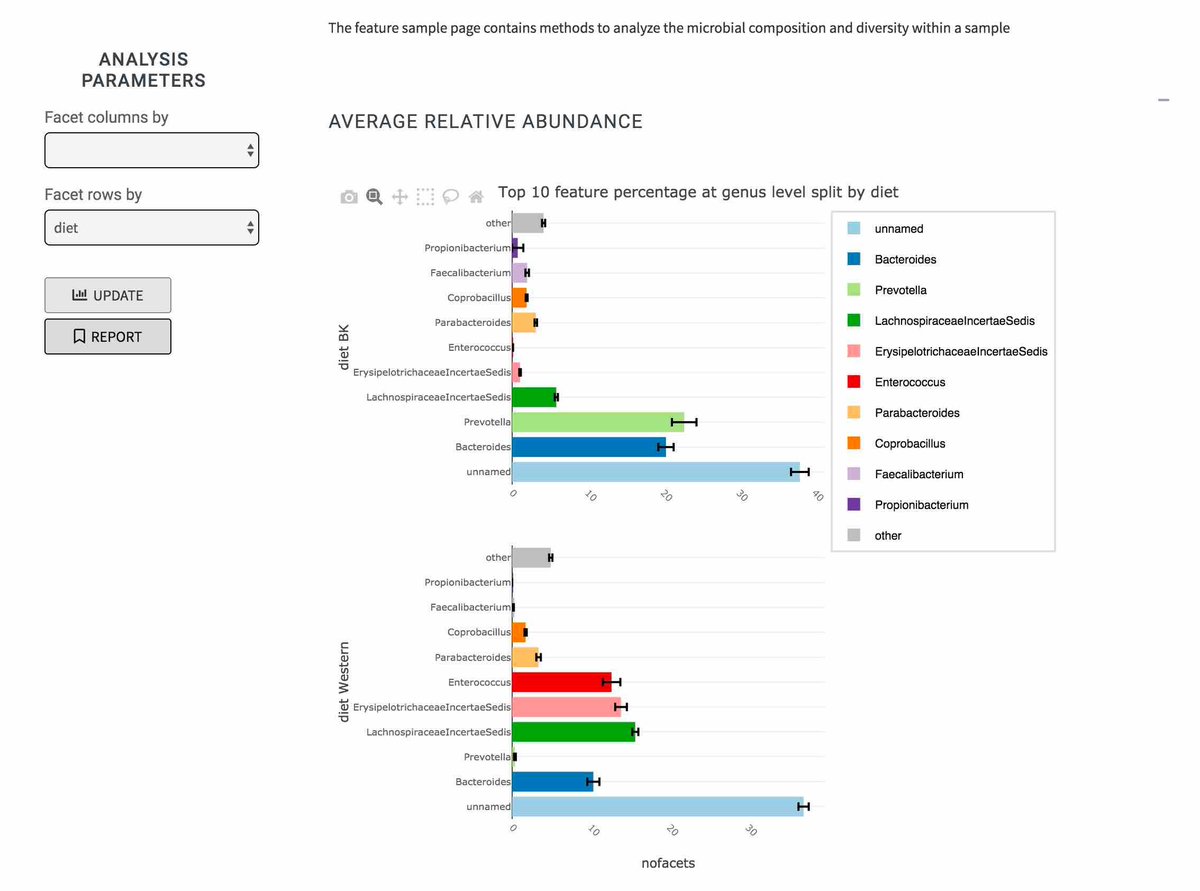
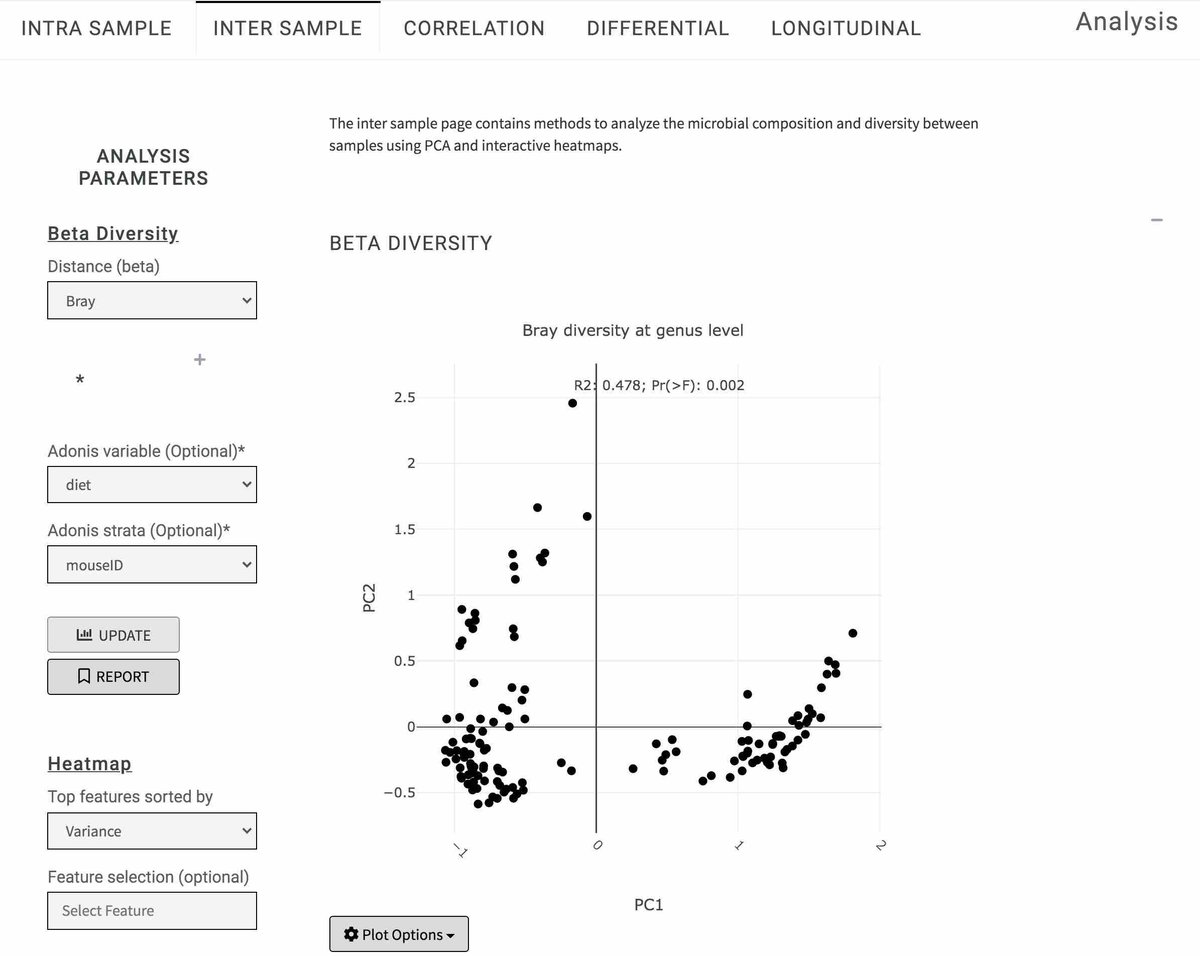
lipidr is a novel open-source R/Bioconductor package for data mining and analysis of lipidomics datasets. lipidr allows thorough data inspection, normalization, and uni- and multivariate analysis, displaying results as interactive visualizations https://t.co/Enbo0UJjYL
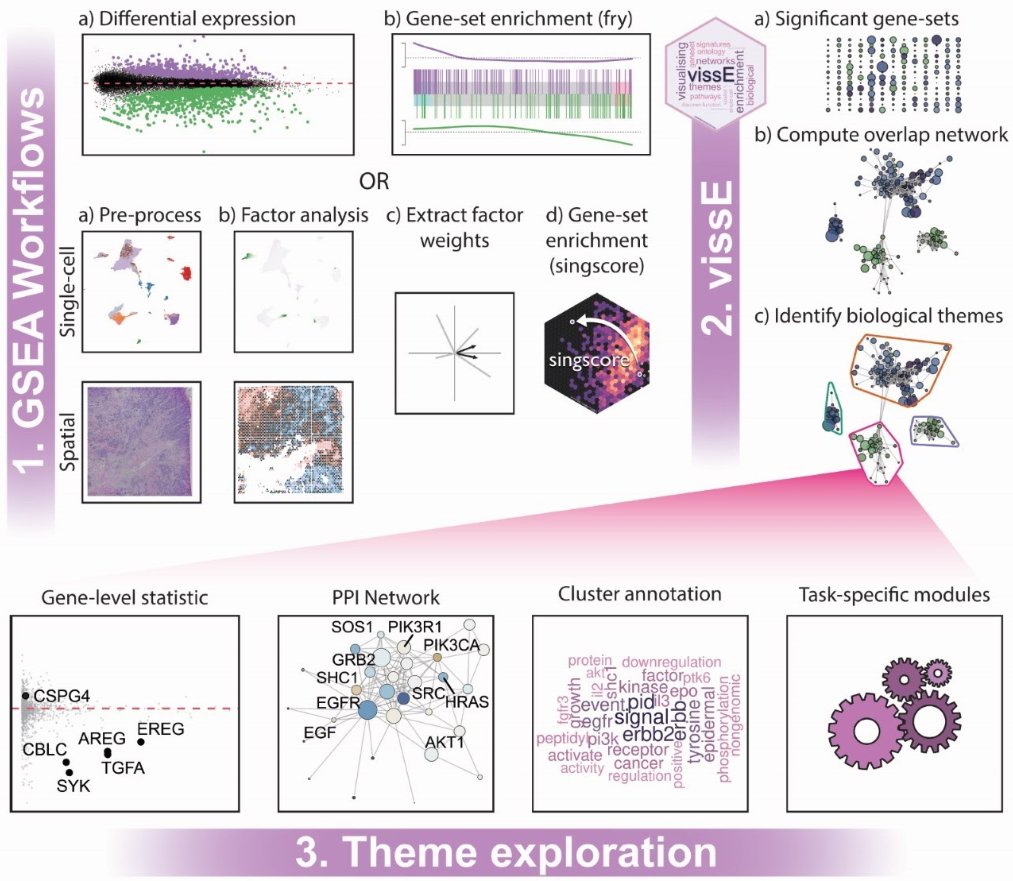
If you hate scrolling through results of GSEA to understand biological function, you’ll love our new webapp https://t.co/45RryK0eZI that offers summarisation and interactive #visualisation, driving hypothesis generation. #GSEA#scRNAseq#proteomics@10xGenomics @nanostringtech🧵
If you have some GeoMX DSP data and have no clue how to QC/normalize/BatchCorrection. Please checkout our new package standR!
Very excited to have my package standR out with the new 3.15 release of @Bioconductor .
https://t.co/rp1lT6K1ld
Our new tool, vissE, allows you to summarise pathway enrichment results from 1000s of pathways to a few biological themes that can aid in a holistic interpretation of biological systems. We also present a novel workflow to apply it to single-cell and spatial transcriptomics data.
Congratulations to our 2020 Honorary Senior Fellow (and 2019 Open Source/Open Science award winner) - well deserved recognition for all that you have done (and will continue to do) for the bioinformatics community!
Our paper describing a new tidy interface for differential gene expression analysis has just been published https://t.co/F8v4H6NC1o @steman_research@GenomeBiology@WEHI_research
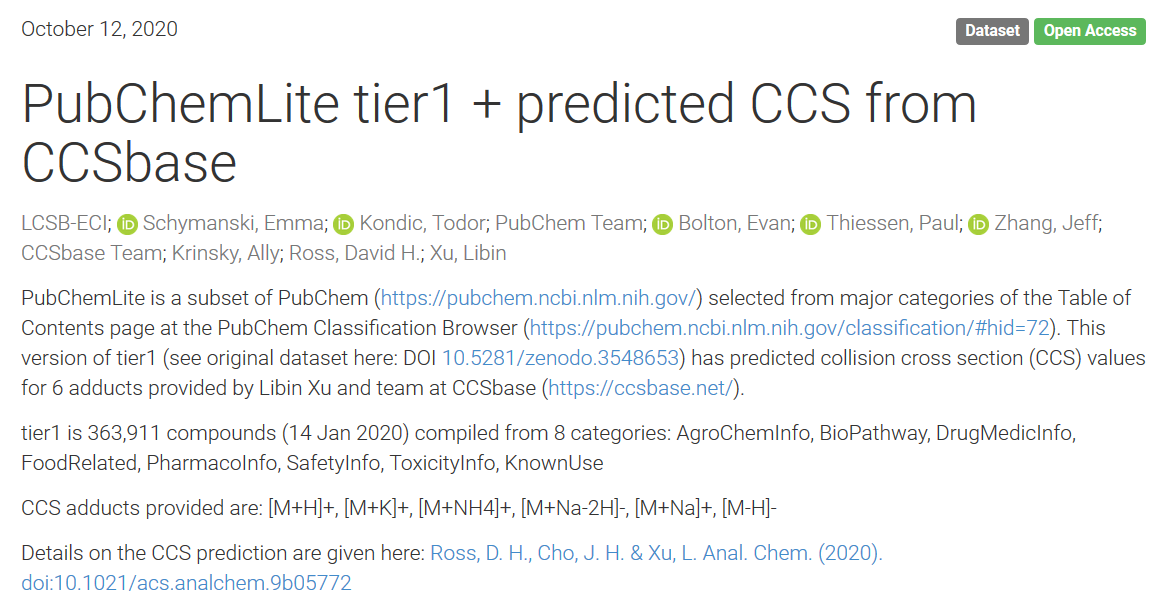
Delighted to present our first #MetFrag database with predicted CCS values for 6 adducts for >300K compounds thanks to ECI-LCSB, CCSbase @UwXulab and @pubchem - download here; coming soon to MetFrag Web!
PubChemLite tier1 + predicted CCS from CCSbase https://t.co/2ZSaOKTYa3
The Abstract submission is OPEN📢📢📢for #metabolomics2020 !!! The deadline to submit an oral abstract is September 13 and for a poster is September 20. Click here for more info https://t.co/SzAJhRZ66C
@MetabolomicsSoc@EMN_MetSoc
#rstats friends please let me finally properly introduce {flow} !
Visualize as flow diagrams the logic and the execution of your code or browse through it as the diagram updates in real time.
https://t.co/gz06HbY5Xu
Feedback and visibility as always greatly appreciated!
#Rstats people: What package (CRAN, Github, whatever) is under-appreciated and also incredibly life-changing for you?
For me it’s Glue. I do a ton of SQL from boilerplate and Glue::glue_sql saves me hours a week.
@mbeisen@ramencult@matias_kaplan experimentalists need to process their data, so they become computational biologists. computational biologists need to understand their simulations and algorithms, so they become theorists. theorists get upset at the shitty quality data they have, so they become experimentalists
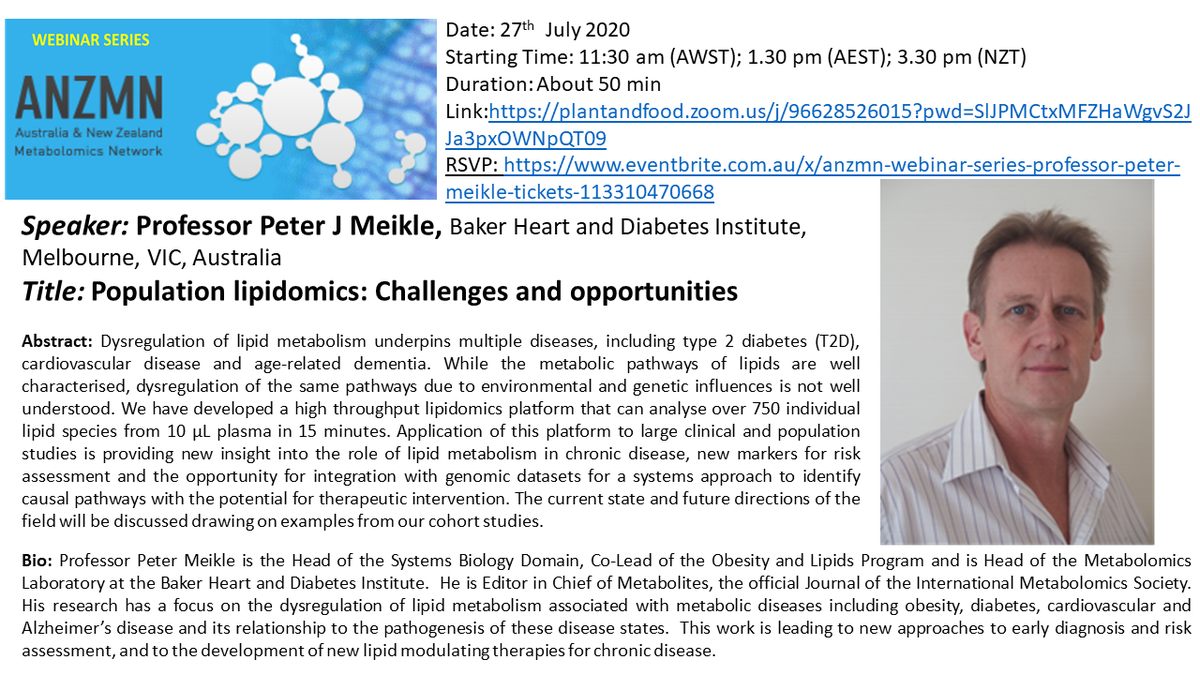
Next ANZMN webinar is on Monday 27th July, 2020 by Prof Peter Meikle. Looking forward to seeing you there
#lipidomics#metabolomics#anzmn
https://t.co/S7CxfyXKNd
Let's be real, teaching remotely is essentially a form of live streaming/video creation. As such, a number of teachers and profs have reached out to ask about the setup behind the lockdown math live streams, so I wanted to share the answer in one place.
https://t.co/F2CRcJufhy
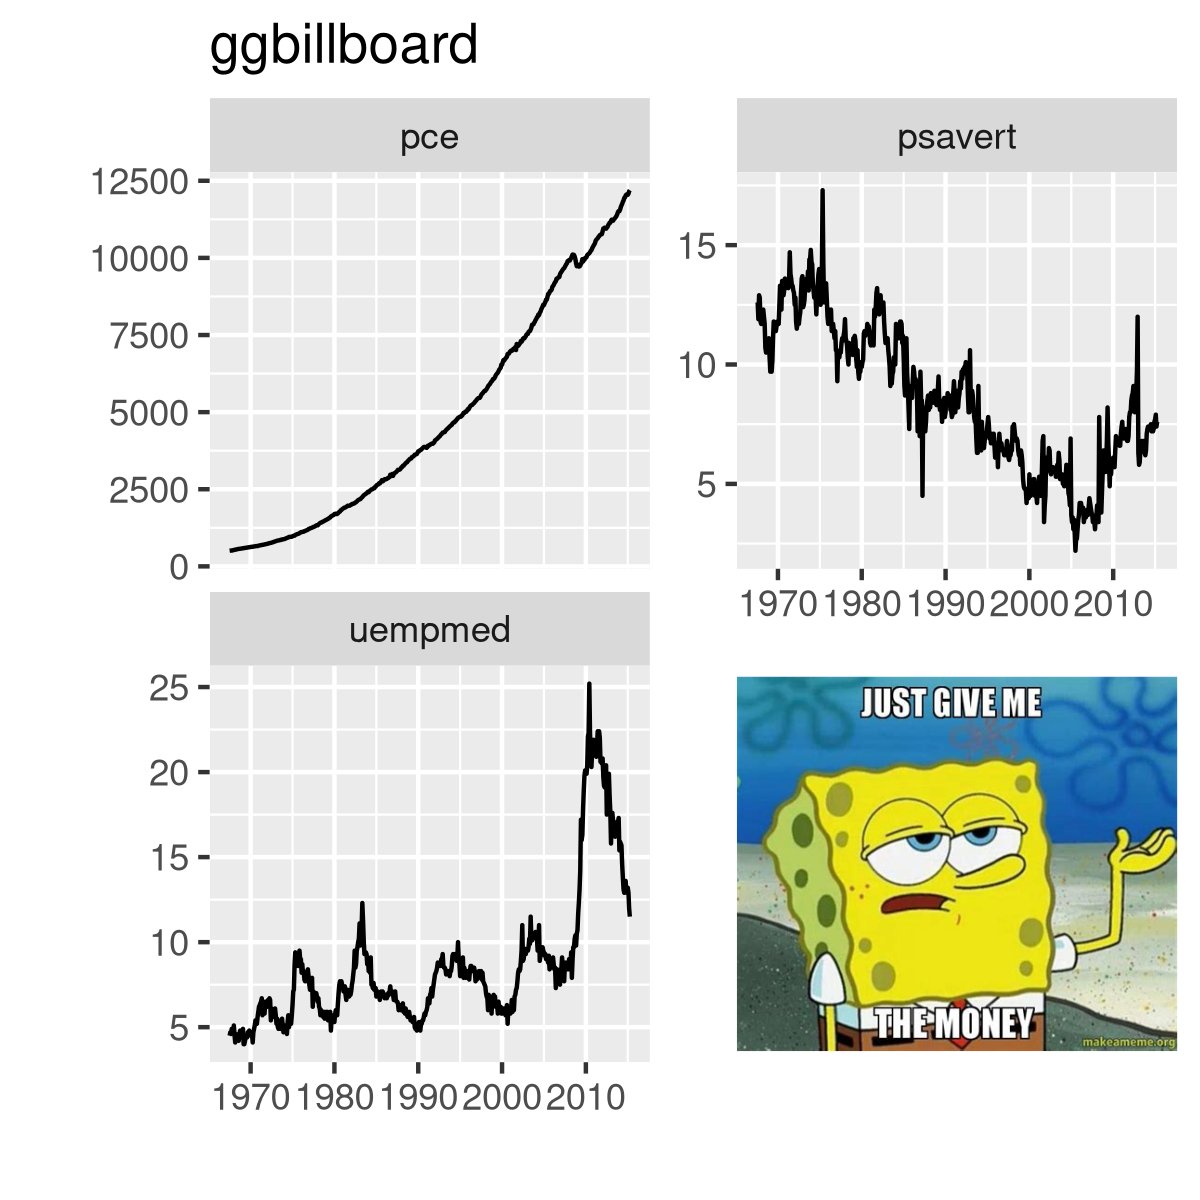
Use vacant ggplot2 facets for advertising with {ggbillboard}
p <- ggplot(blah, blah)
img <- grid::rasterGrob(readPNG("whatever.png"),
interpolate=TRUE)
billboard(p, img)
https://t.co/MNwiHZ7vt6 #rstats
I wrote 3 demo packages to help me store what I've learned (so far!) on using C in #RStats packages.
* {simplec} using ".C()" https://t.co/0BdPhNxqds
* {simplecall} using ".Call()" https://t.co/oUNuXXAVxg
* {simplercpp} using {Rcpp} https://t.co/mAWFUfd8VQ