First post on here 😅
I worked on a video game sales dataset and turned it into this dashboard in Excel.
Here’s a quick walkthrough 👇
#DataAnalytics#HNGDataAnalytics
@PrinzAna@hnginternship I got that dataset from an internship task.
But for personal projects, I get from Kaggle or I use AI prompts to generate real world datasets
First post on here 😅
I worked on a video game sales dataset and turned it into this dashboard in Excel.
Here’s a quick walkthrough 👇
#DataAnalytics#HNGDataAnalytics
@Lnsmuriuki@officialladi_T Most people use Kaggle and because of that we see different analyzing the same dataset everyday.
I would suggest prompting AI to create a real world dataset, that you can practice with and of course you can still use Kaggle.
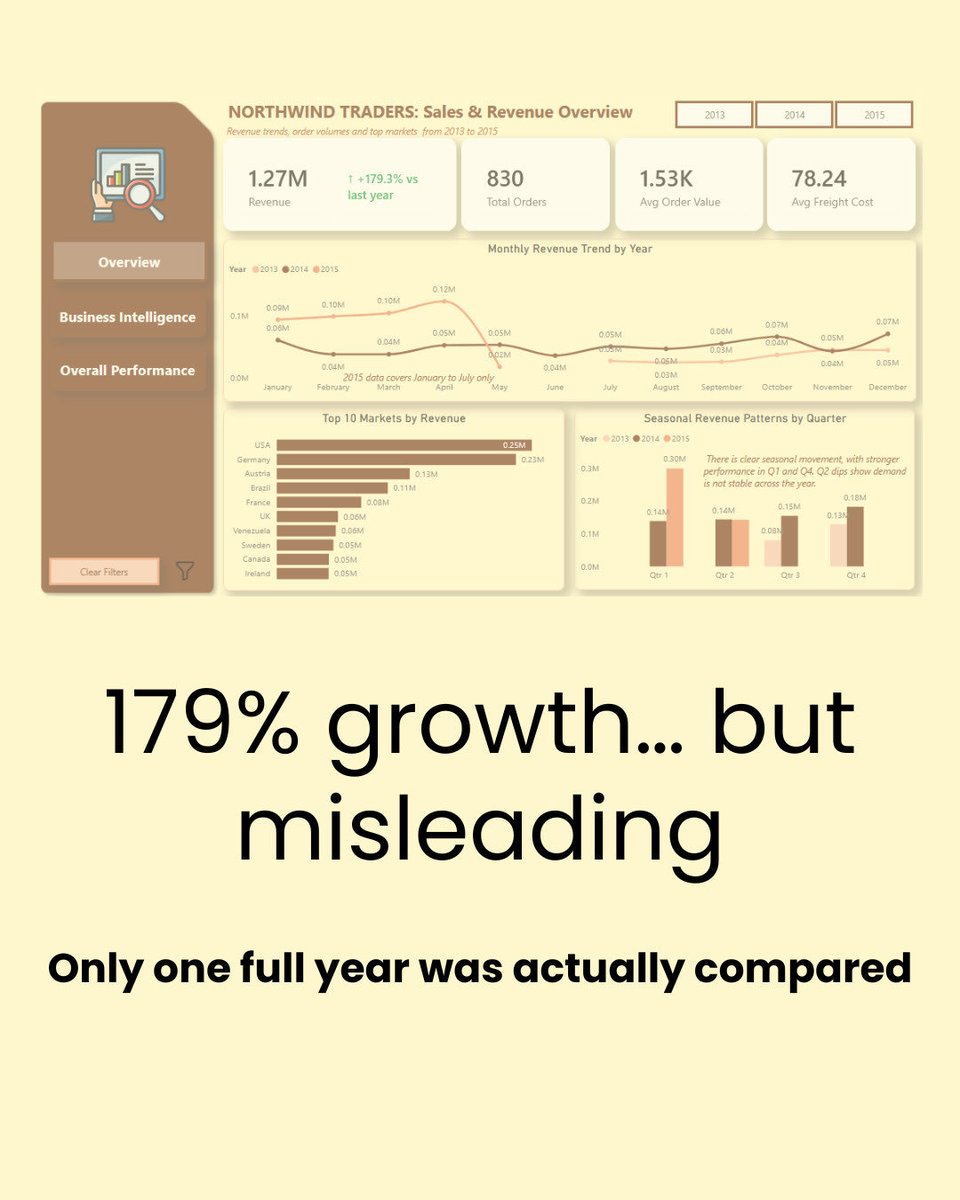
This project reminded me of something simple:
Numbers can look right and still be misleading.
You always have to check what’s behind them.
Live interactive dashboard: https://t.co/e5ZVQoi2sU
Full project:
https://t.co/WGeb9Z4QJW
Some other things I found:
• 14% of revenue came from discontinued products
• Discounts didn’t consistently drive more revenue
• Some regions had higher shipping costs without better returns
@styleschelss@hnginternship Ahh I see what you mean, you’re right. I formatted the region from wide to long after cleaning my data, so the duplication likely came from that and I didn’t recheck.
Thanks for pointing that out, I’ll revisit that part and correct it 🤗
@officialladi_T Practicing is what takes you from a 4/10 dashboard to a 9/10. Trust me everybody started from the same level you did, so don’t feel intimidated because one day you may even create better dashboards😊