How long are we likely to live? 👴 👵 Our developer Linus answers this question with the help of an unusual chart type: the beeswarm plot! 🐝
Read more and find out how to make your own on the Datawrapper blog: 👇
https://t.co/7SgwXJfT8T
@rpethe Hi Rhishi! Thanks for using Datawrapper — and yes, you're right, that price is too high for most individual users. We're planning to make changes to our pricing.
📊 Today! Our intro webinar "Getting started with Datawrapper" begins at 12pm EST / 6pm CET. Not too late to register and join the live Q&A: https://t.co/DfrUoAMZim
This week's Data Vis Dispatch covers topics including melting glaciers in the Swiss Alps 🗻🧊, rising cancer survival rates in Hong Kong 📈, and a boom in the autism therapy industry. Discover these and much more on the Datawrapper blog. 👇
https://t.co/1I7lolzDhD
📊 Coming up this Thursday:
Getting started with Datawrapper on June 4 at 12pm EDT / 6pm CET.
Perfect for newcomers! And we'll save time for a live Q&A. You can register here: https://t.co/DfrUoAMZim
Donated blood saves lives every day, but Germany barely has enough. In his first Weekly Chart, our designer Moritz looks at the current status of blood reserves and the changing pool of donors. 🏥 📊 🩸
https://t.co/TI8s8ubqL4
In this week's Data Vis Dispatch, you'll find maps of the Ebola outbreak, but also visualizations on politics, caregiving, taxing the rich, K-pop, and the lifespans of dogs. 🗺️ 🗳️ 🐾
All and more on the Datawrapper blog: 👇
https://t.co/95BXgNryox
📊 Our June webinars are open for registration! Both at 12pm EST / 6pm CET:
➡️ June 4: Getting started with Datawrapper
➡️ June 18: Datawrapper's API with R
Insights + live Q&A. Join us: https://t.co/O0Ib4sYCyD
How many twilights are there? What is a true night? Which places go without it, and for how long? Ceren from our support team answers these questions with some very cool maps! 🌃 🌐 🗺️
https://t.co/pTXULb86rX
Do you know someone who'd be great at office management, lives in Berlin, and speaks German? We're hiring, so send them our way!
🇩🇪 Office-Manager:in | 30-40 Stunden/Woche | Berlin-Friedrichshain
Mehr Infos hier: https://t.co/fjACvHI6Jr
👨💻 Excited to share our June webinars lineup (all at 12pm EST/6pm CET):
June 04 ➡️ Getting started with Datawrapper
June 10 ➡️ Datawrapper's API with R
Join us for useful Datawrapper insights and a real-time Q&A! You can register here 👉️
https://t.co/O0Ib4sYCyD
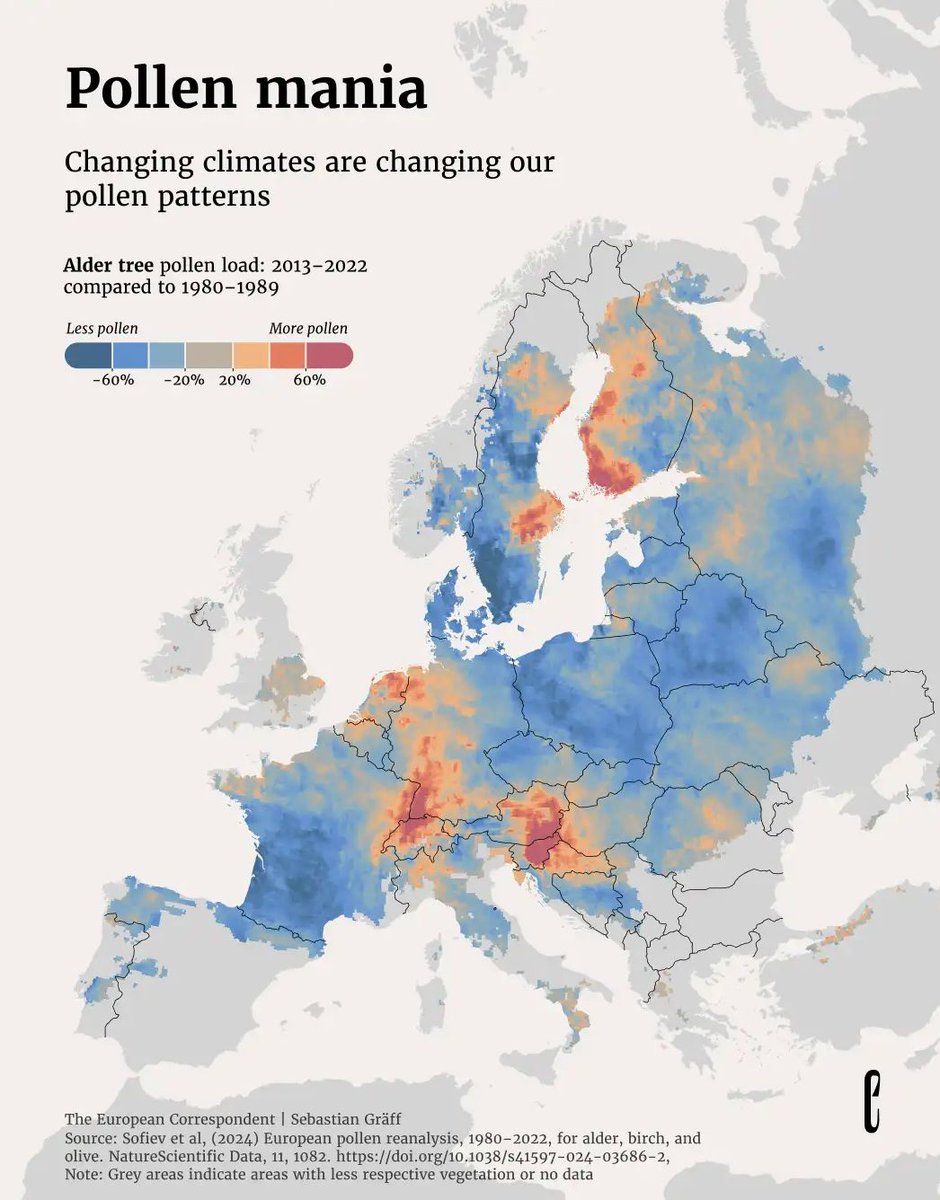
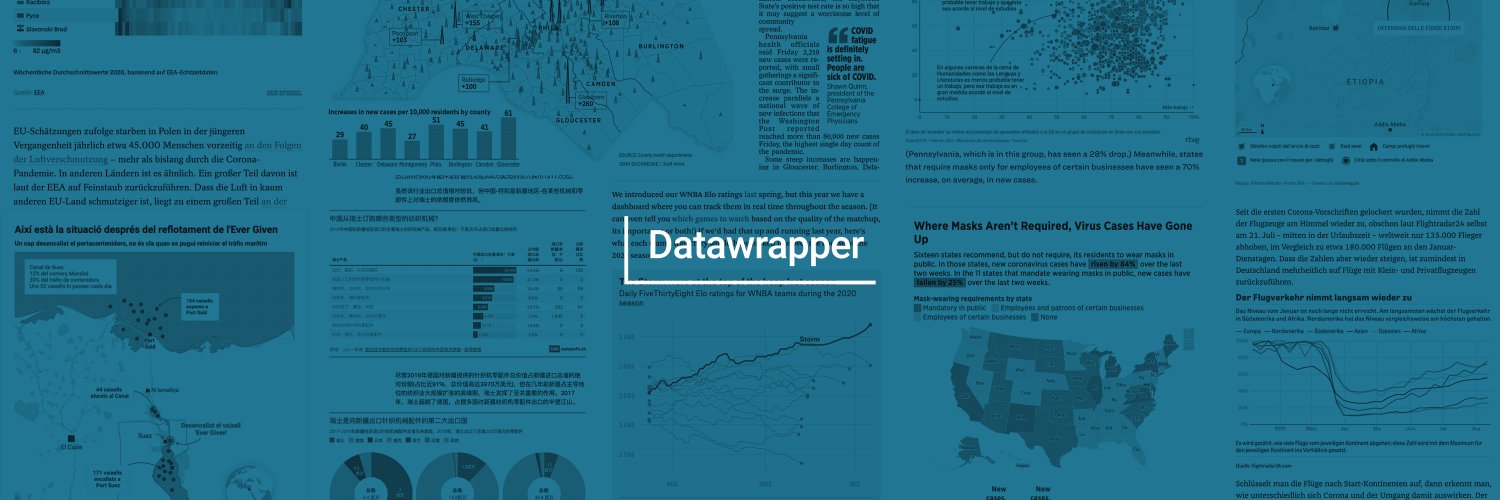
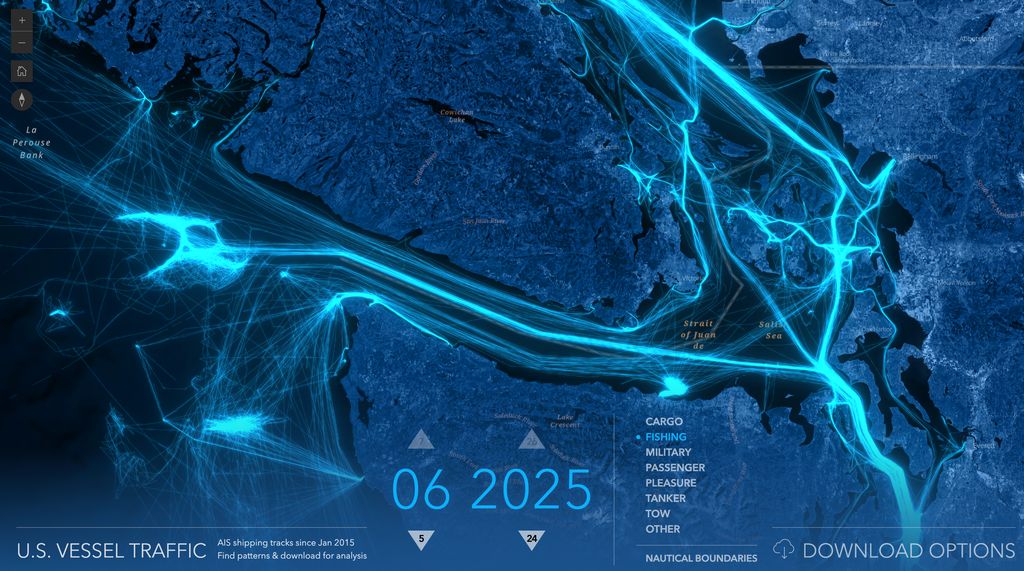
From tracking global earthquakes 🌎, to monitoring vessel traffic 🚢, and on to observing changes in pollen patterns 🌳, maps are useful for visualizing various topics. Explore these and more in the Data Vis Dispatch. 👇
https://t.co/B6BRv5BLoq
🎉 New: You can now use a passkey to sign in to your Datawrapper account! It’s more convenient *and* more secure than a password.
Learn more about this and other new account security features here: https://t.co/fCEEkpEMuT
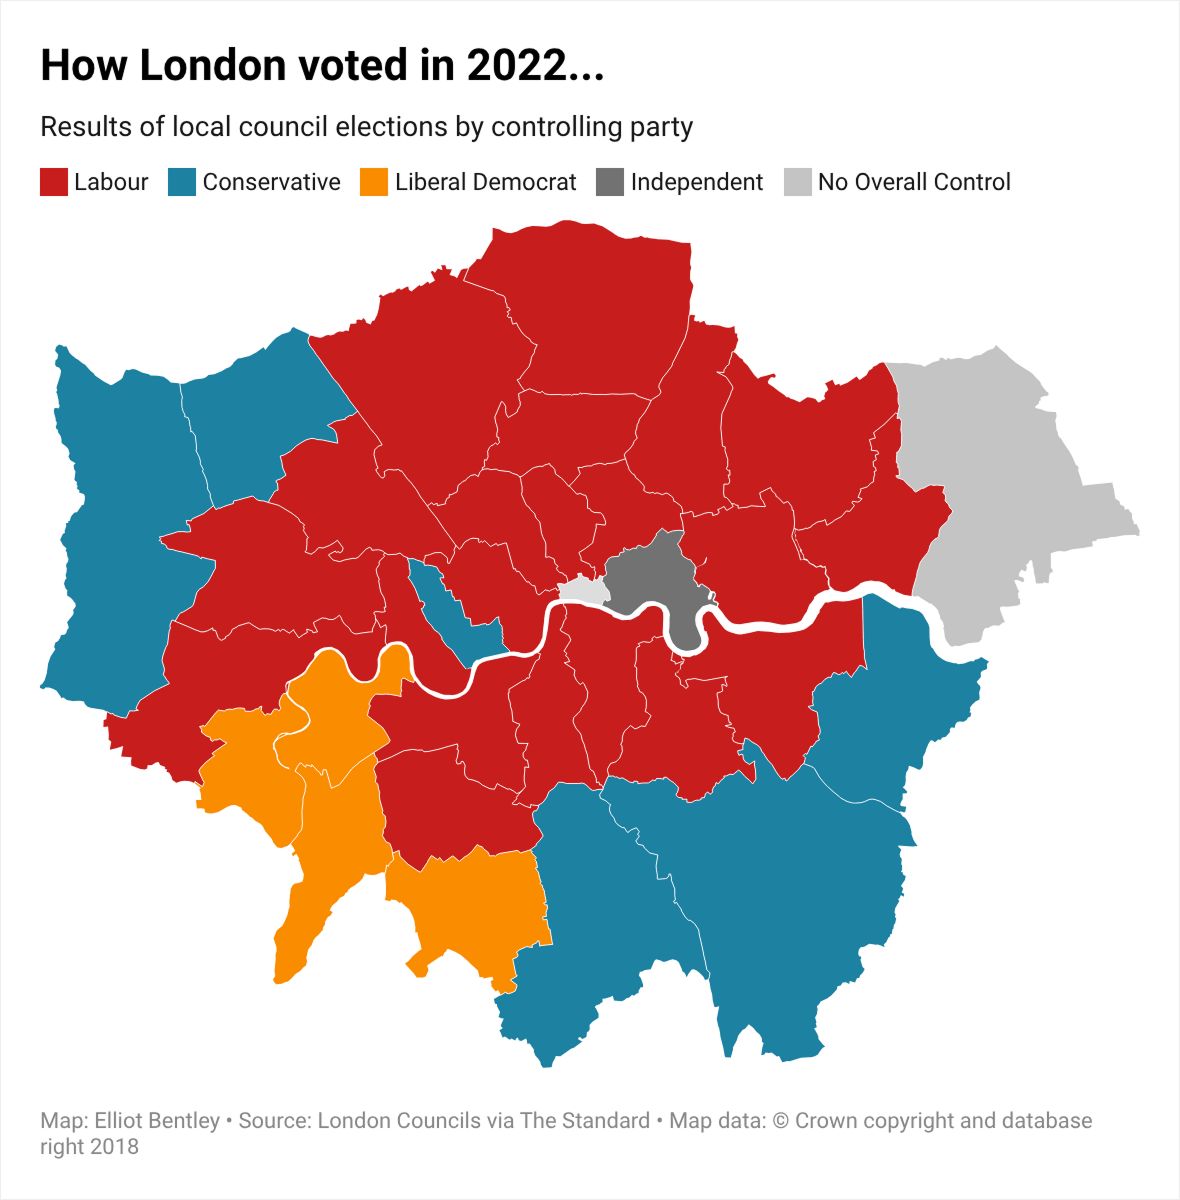
Last week, Londoners voted in local elections. What was different this time around, and how does London compare to the rest of the U.K.? 🗳️
Our vis developer Elliot walks us through the results. 📊 👇
https://t.co/MhDEUkuUHE
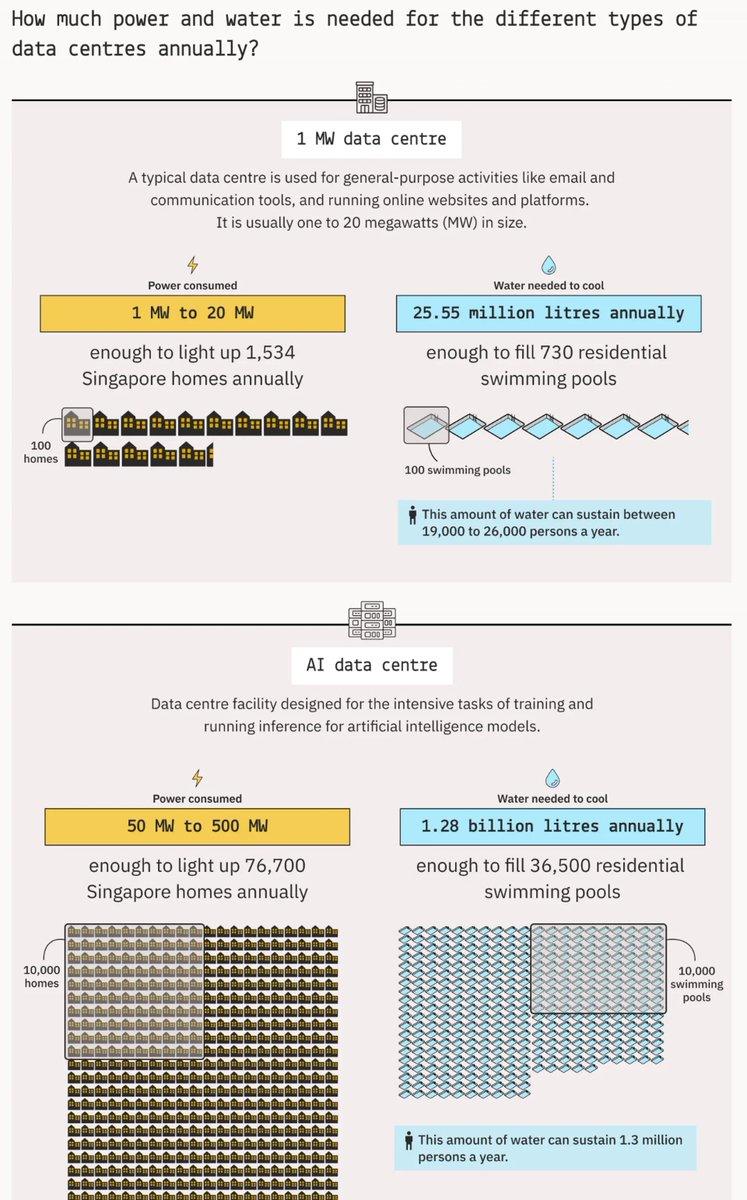
Data plays a big role in the boom of AI, from data centers 🏢, to security concerns, and onto AI chatbots promoting stereotypes 🤖. Data has also been logged to create the 2025 Burning Man MOOP map! Check out these topics and more in the Data Vis Dispatch. 👇
https://t.co/lwFNgu7aWg
🚀 Curious to learn the basics of Datawrapper? Join our "Getting started" webinar *tomorrow*, May 12 (6pm CET/12pm EDT)! Shaylee from our support team will walk you through the #dataviz tool: https://t.co/LAaPm0spw6
Is it protecting children's safety or putting our privacy at risk? Today, our app developer Toni takes stock of the latest developments in online age verification and discusses its shortcomings. 🔞 📱 📈
https://t.co/EVjS5lEqug
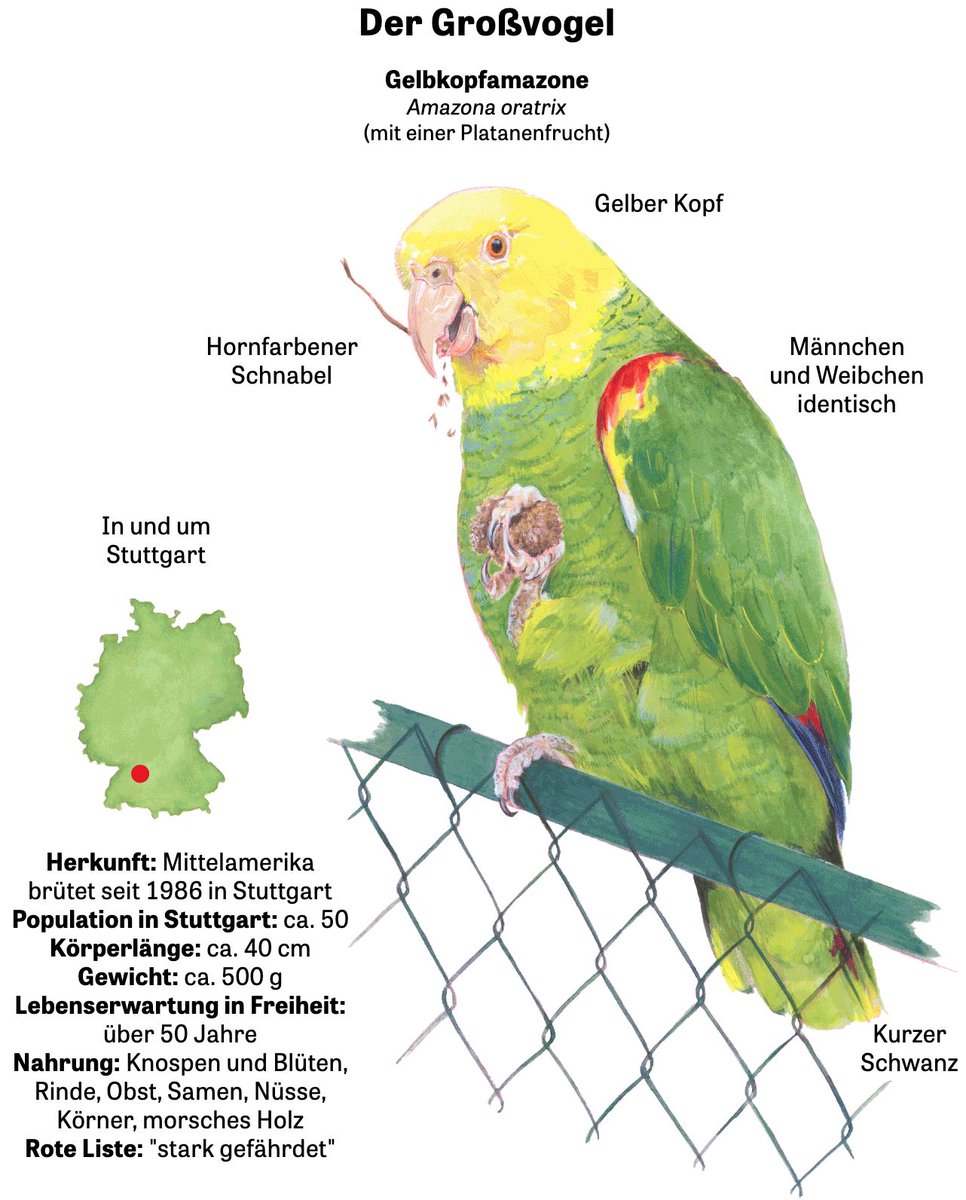
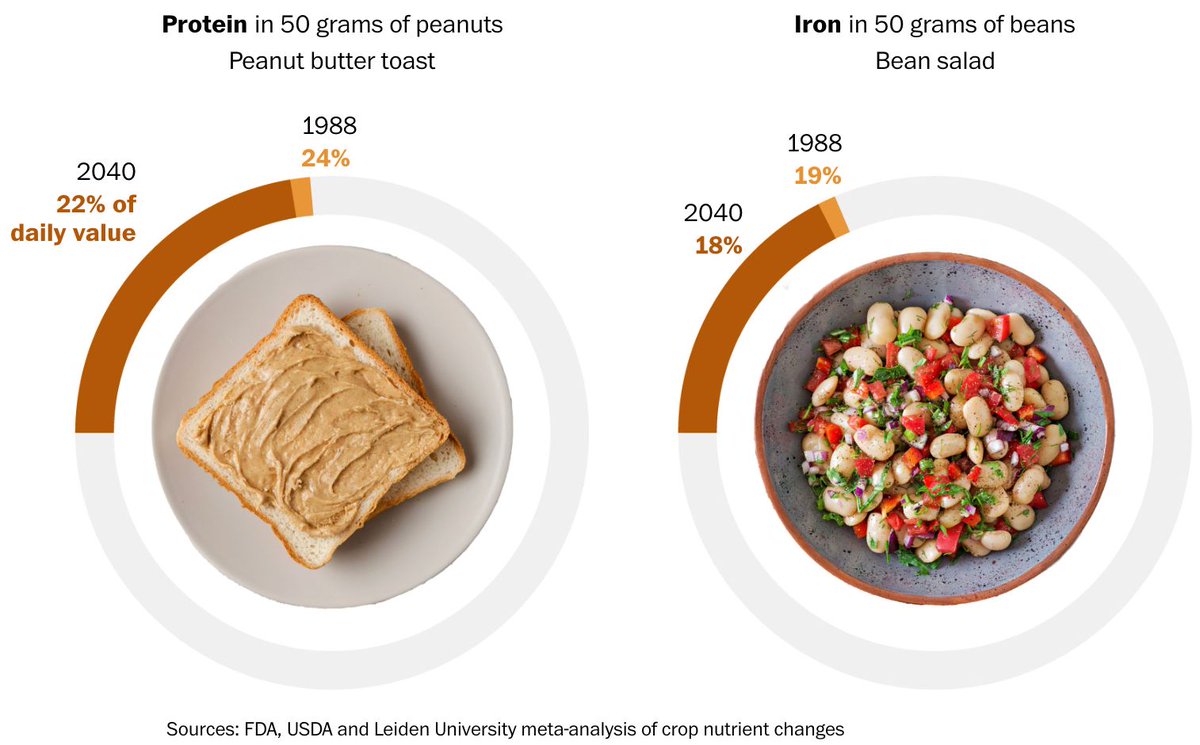
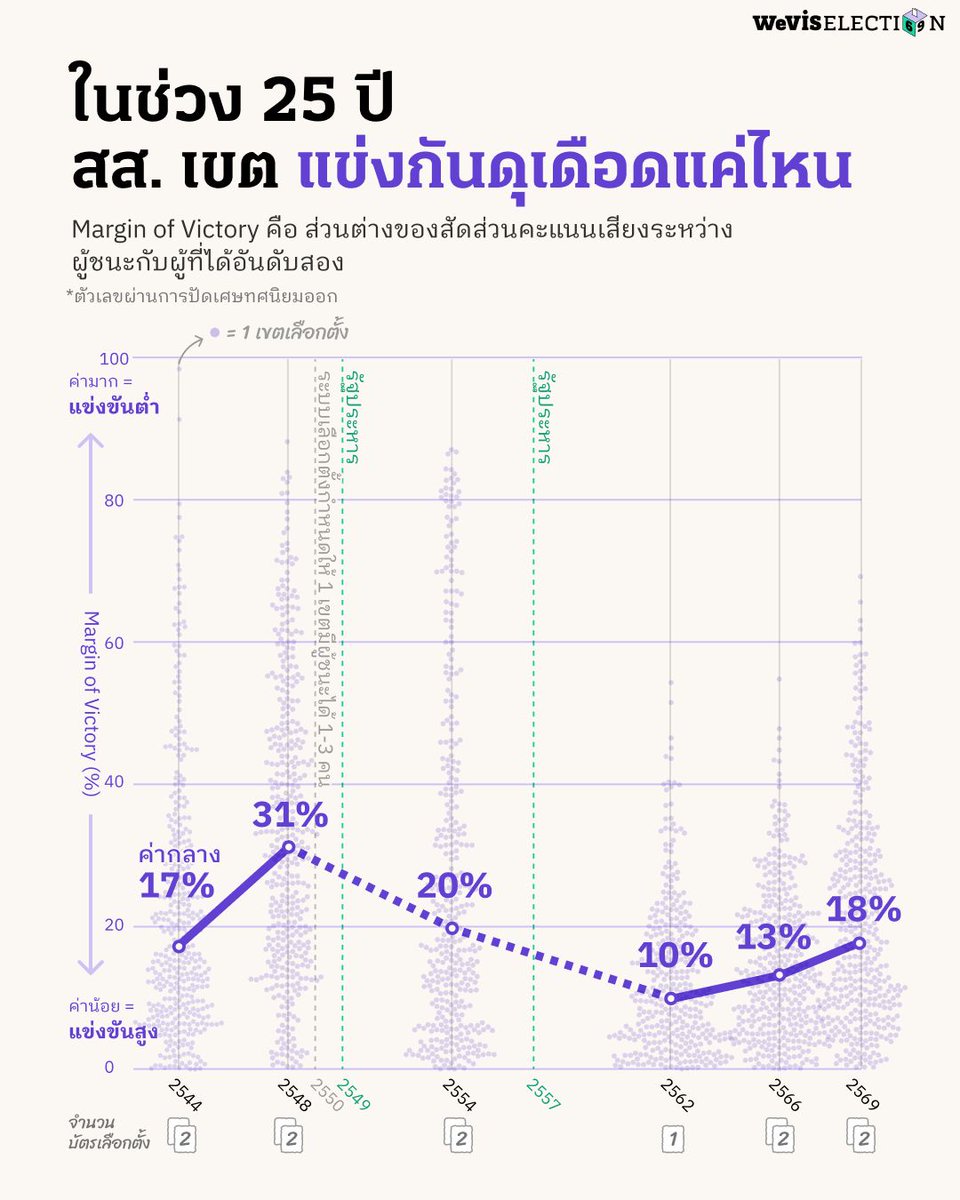
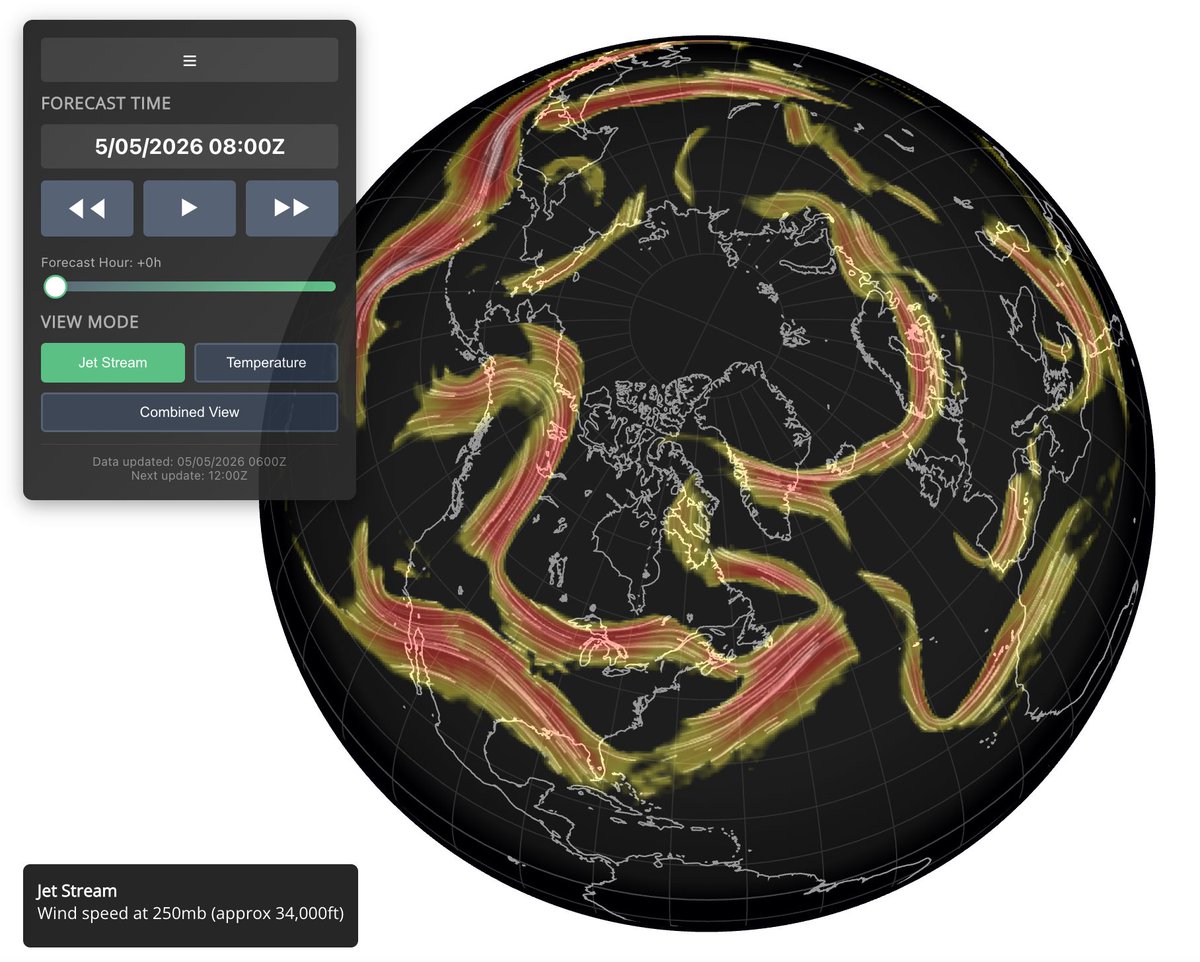
Changes can be found in a variety of areas, ranging from nutrients in crops and the flow of jet streams to Thai democracy and even the habitats of parrots. Explore these topics and more in the Data Vis Dispatch. 👇
https://t.co/E1FmyWptZB
🌎 Join us *tomorrow*, May 5th at 6pm CET/12pm EDT for a deep dive on Datawrapper maps: What types are there? What can you do with them?
There are still spots left: https://t.co/0iW29tnnOx
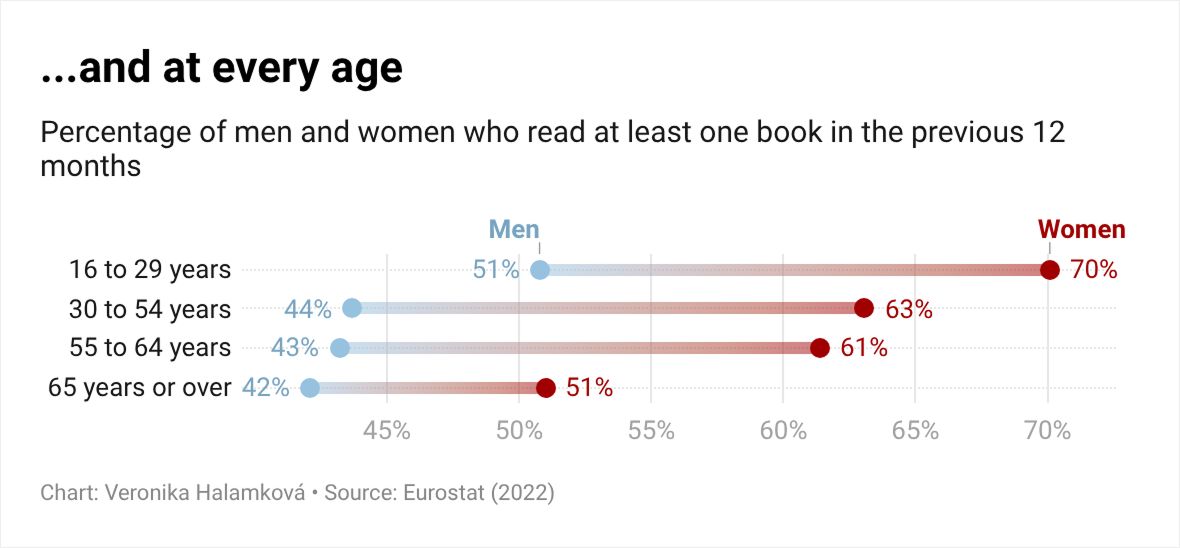
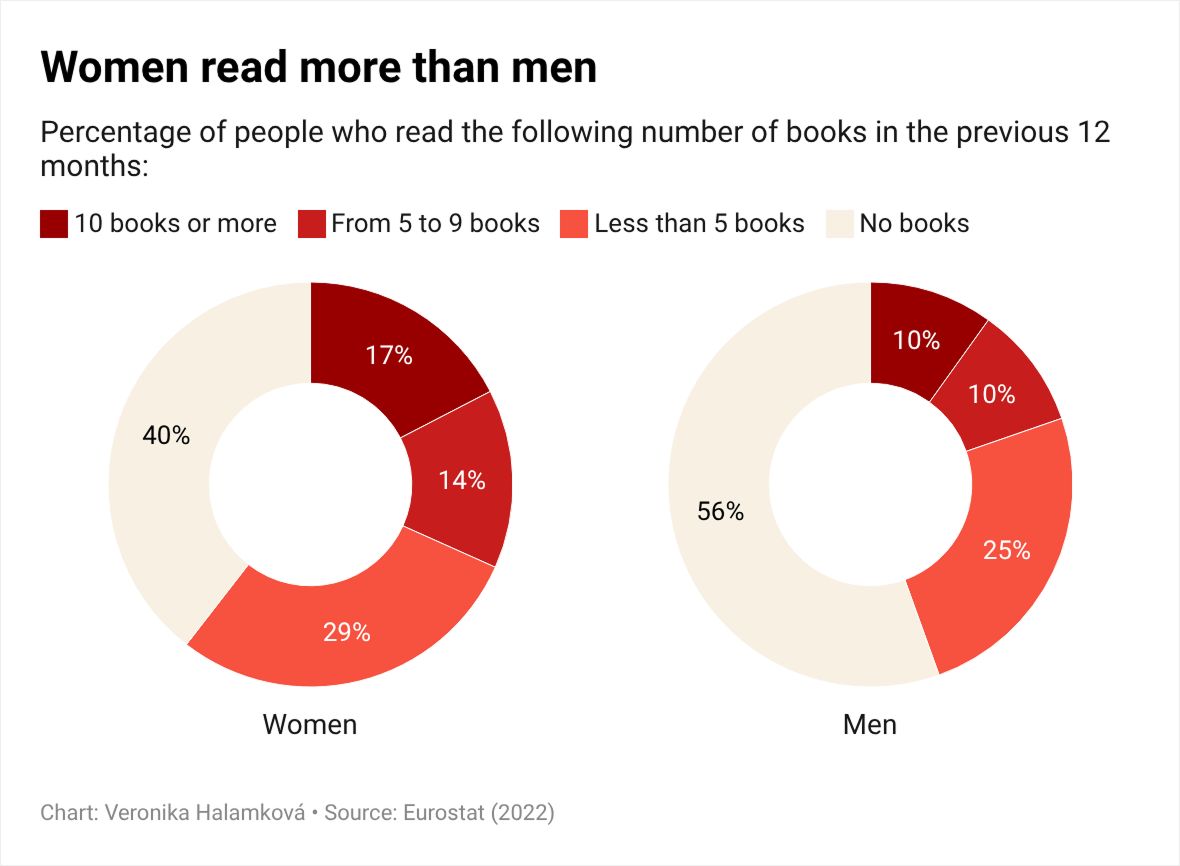
As a late celebration of World Book Day, our writer Veronika examined Europeans' reading habits and found something unexpected: a gender reading gap! 📊 📚 👀
Read more about our (lack of) reading on the Datawrapper blog: 👇
https://t.co/K4KSugeLwX