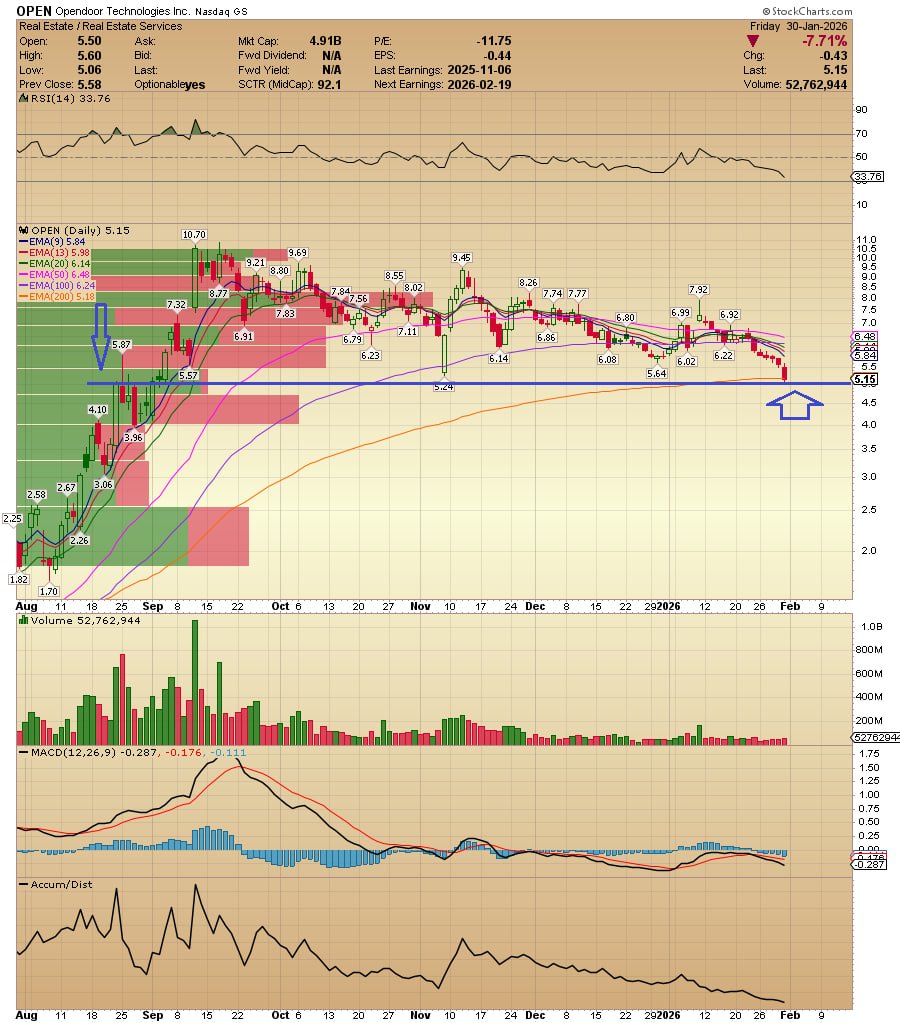
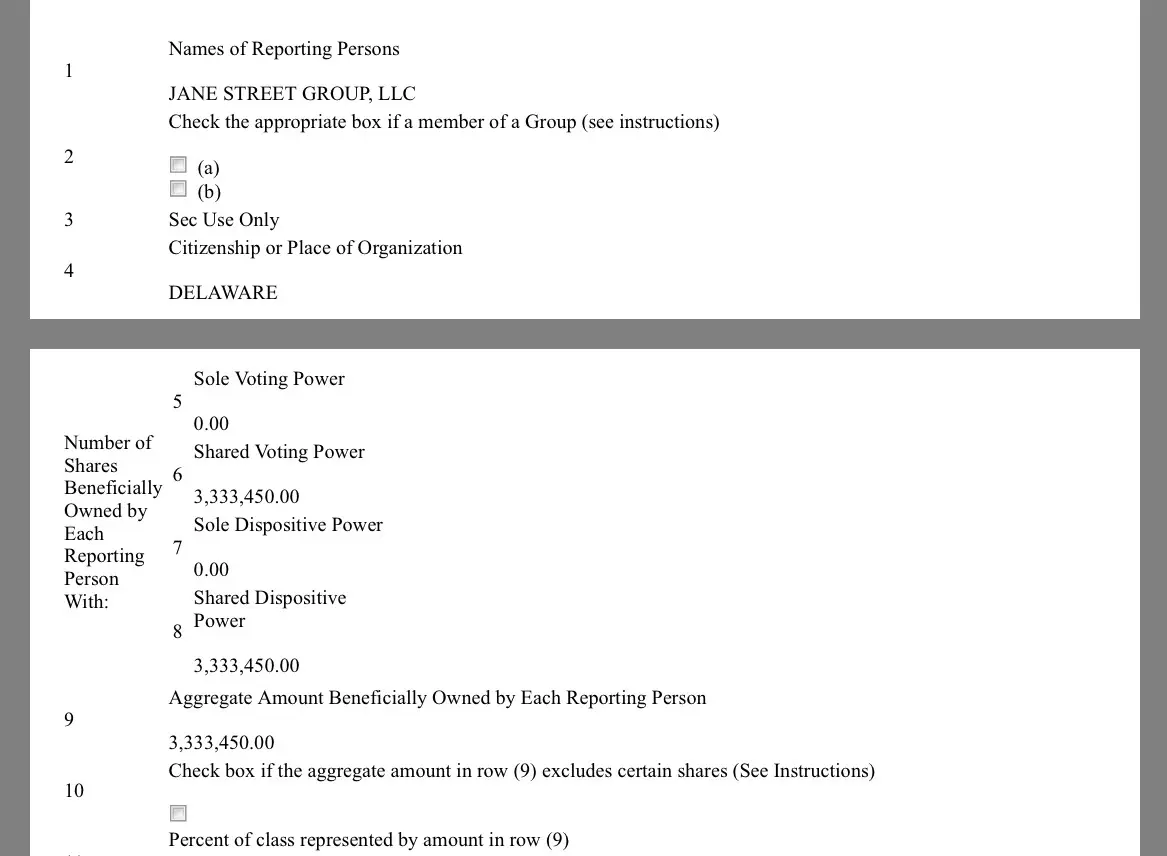
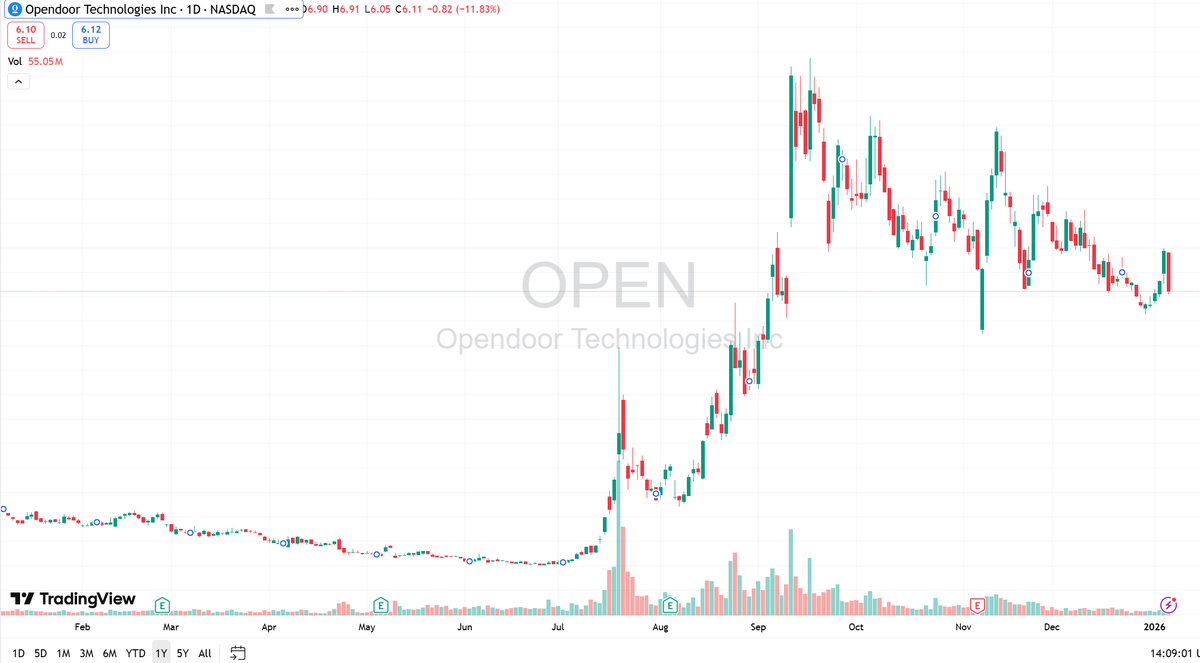
$OPEN Bulls must defend this key support level next week to sustain the bullish momentum. Major players are still holding significant positions in the stock.
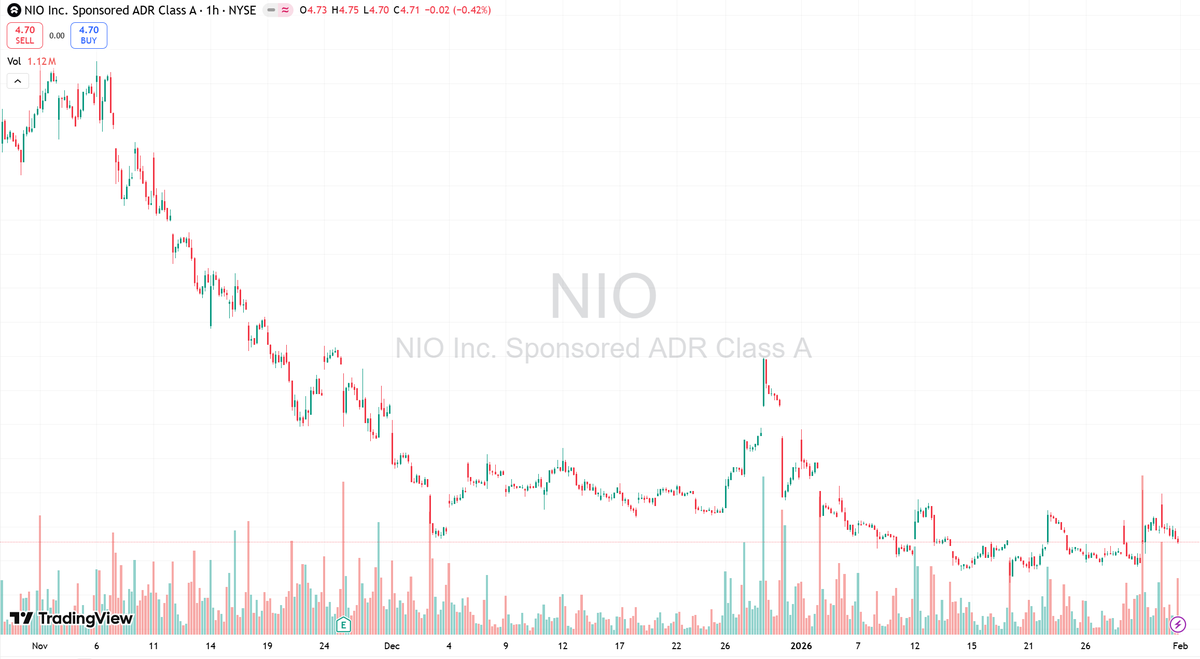
🚗💡 $NIO has shown some pullback recently, but there are signs of a potential rebound. With new quarterly data and product updates, can NIO make a comeback? 🤔 #Stocks#Investing#NIO#EVs#MarketTrends
The market is getting nervous again. $SPY is pulling back, tech stocks and $QQQ are under pressure, and sentiment is shifting fast.
But I don’t see fear. I see digestion.
Real fear doesn’t show up at a VIX of 17.
It lives at 30+.
A little $VIX noise is normal.
Relax.
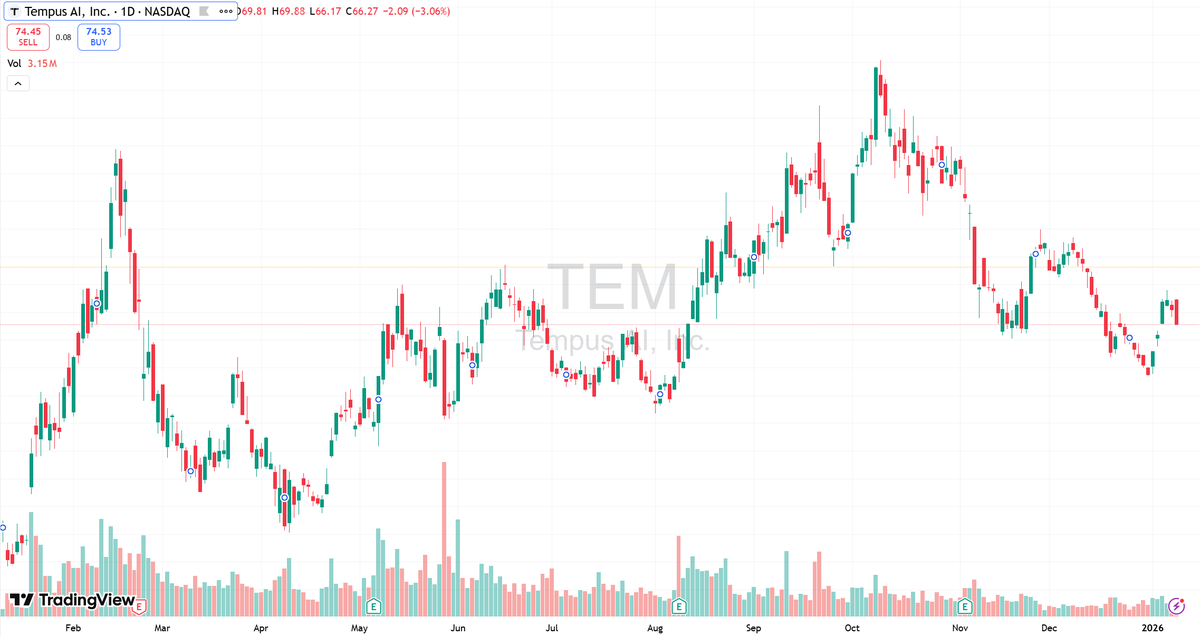
TEM (Tempus AI) – Daily chart breakdown 📊
After pulling back from prior highs, price has moved into a choppy downward structure, with recent weakness showing cautious short-term sentiment.
Key levels to watch:
📉 Lower support zone: a break could lead to a retest of prior lows
📈 Upper resistance: a rebound needs strong volume to signal a trend shift
🔊 Volume: no clear expansion yet, suggesting consolidation or continued weakness
Bottom line:
This is a wait-for-confirmation setup. Short term favors defense; safer entries come with right-side signals.
#TEM #TempusAI #Stocks #TechnicalAnalysis #NASDAQ
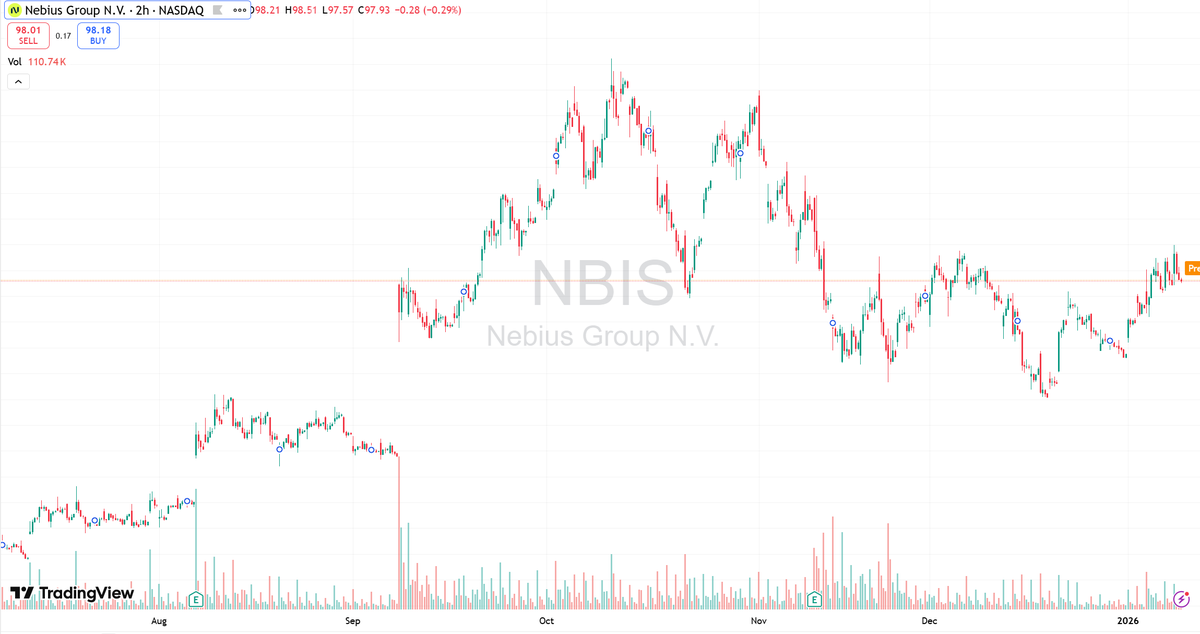
NBIS (Nebius Group) – 2H chart view 📈
After pulling back from the highs, price is consolidating in a range, currently battling around the $98 level.
Key short-term levels to watch:
⬆️ Breakout: potential move to retest the previous highs
⬇️ Breakdown: possible pullback to lower demand/support zones
Volume remains healthy. A directional move may be near — patience for confirmation.
#NBIS #Stocks #TechnicalAnalysis #Trading #NASDAQ
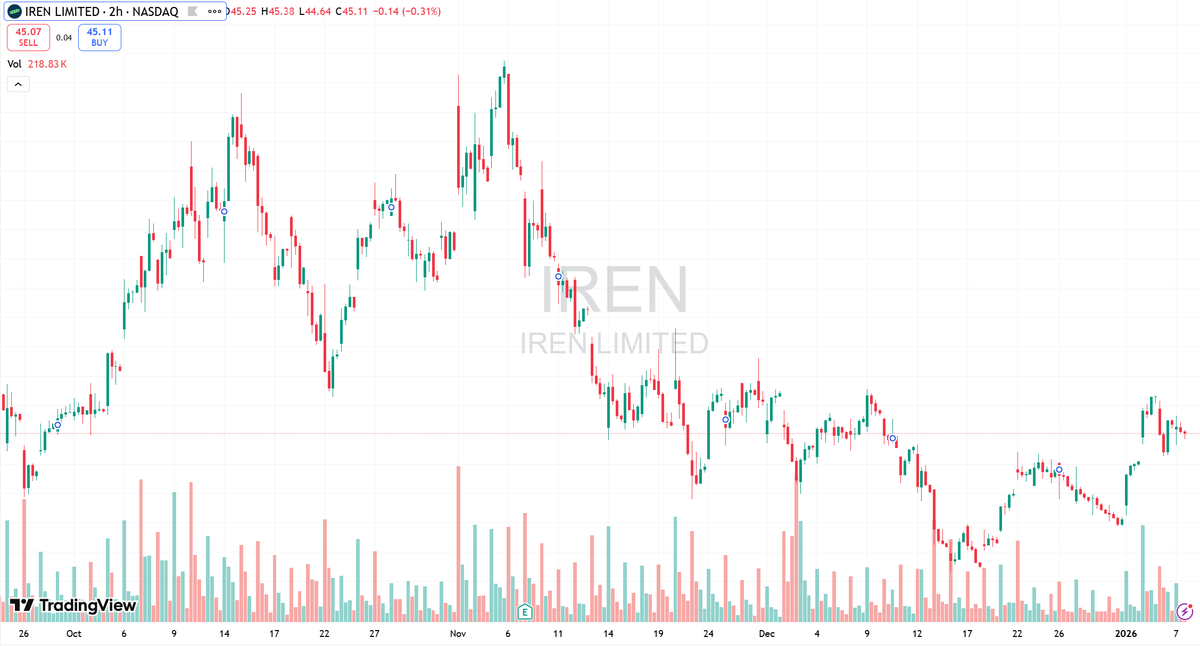
📉 $IREN
A steady decline after the initial spike.
The stock is now in a consolidation phase, bouncing between recent lows and highs.
Notice the lower highs — a sign of continued selling pressure.
Volume spikes during drops, not a sign of accumulation.
It’s either a base forming or further downside risk.
Waiting for confirmation of a solid support level before making a move.
📉 $OPEN
Parabolic move is over.
Now it’s about digestion and risk control.
Lower highs starting to form, rallies are getting sold.
Volume spikes on down days — not what you want to see.
This needs time, not opinions.
Either it builds a new base, or price keeps bleeding lower.
No rush. Capital preservation comes first.
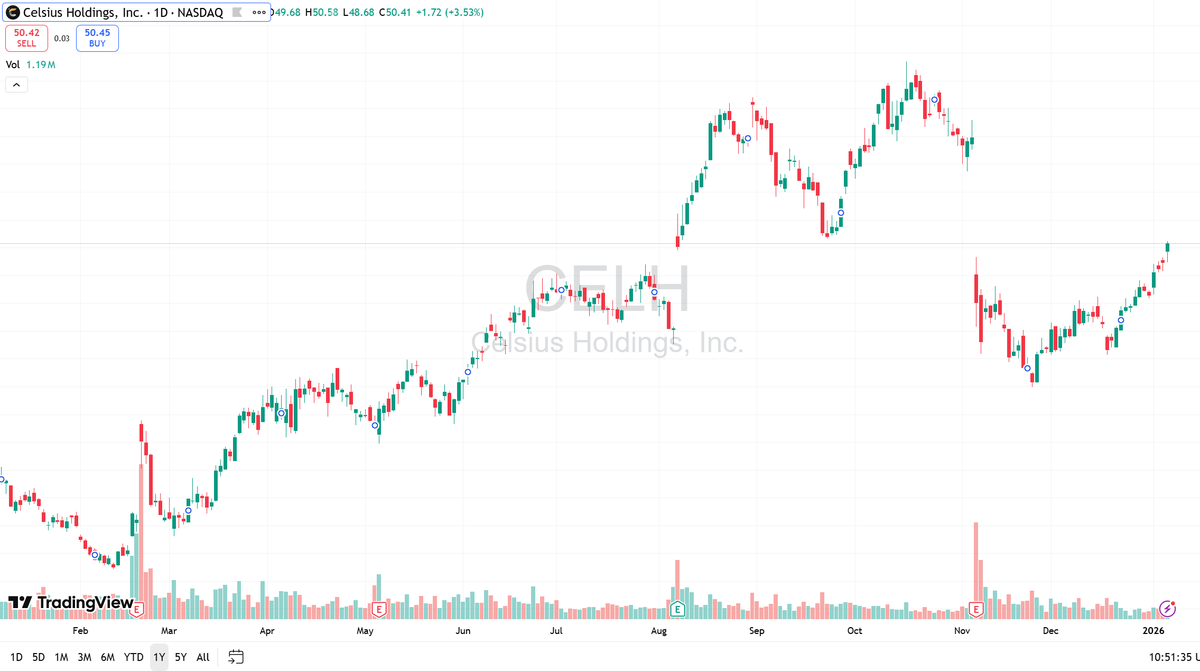
📊 $CELH
Trend is still constructive.
Pullbacks are being bought, structure remains higher lows.
Recent dip found support and price is pushing back toward prior resistance.
As long as it holds above the last higher low, bias stays neutral-to-bullish.
No need to chase strength.
Let the levels decide.
📉 $NIO
Failed bounce.
Lower highs continue to press price lower.
Recent pop was sold into — volume shows distribution, not accumulation.
Momentum remains to the downside until proven otherwise.
No rush to be a hero here.
Patience matters more than opinions.
Let price reclaim levels before changing bias.
Not financial advice.
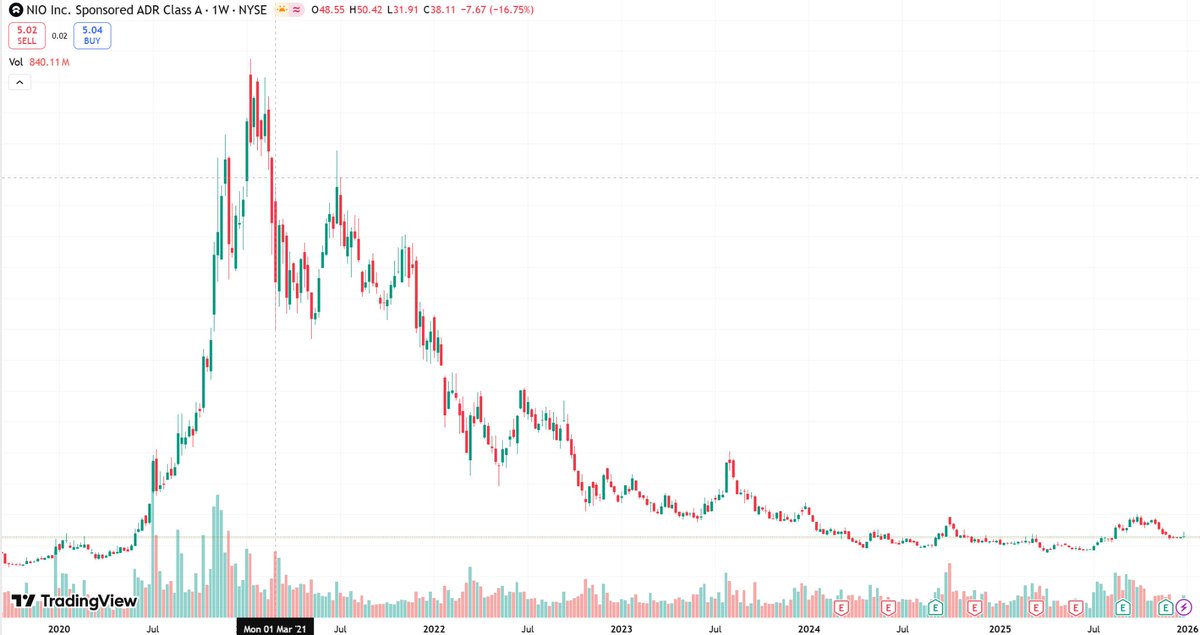
$NIO
📉 Weekly Chart Reality Check
From a 2021 parabolic top to years of lower highs and lower lows — the trend has been relentless. What you’re seeing now isn’t a breakout… it’s a long base forming at historic lows.
🔍 What the chart is telling us:
• Major distribution after the 2021 peak
• Persistent downtrend with failed rebounds
• Volatility + volume compression = late-stage basing behavior
• Sellers are losing momentum, but buyers haven’t taken control yet
🧱 Key levels to watch:
• Support: current multi-year base zone (must hold)
• Resistance: prior breakdown area — trend only changes above it
🧠 Trade mindset:
This is not a momentum name right now.
It’s a patience play.
📌 Bottoms are built, not called.
📌 Trends don’t reverse quietly.
$NIO won’t move when everyone expects it — it will move when the chart confirms it.
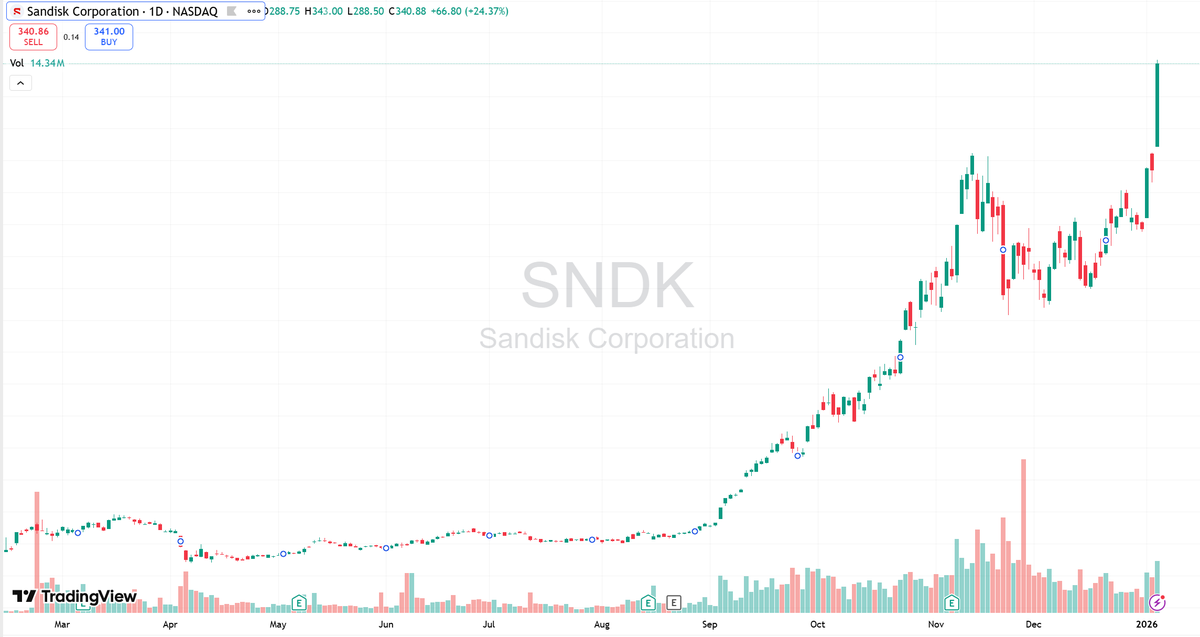
📊 $SNDK
Base → breakout → continuation.
Structure remains intact.
Price is making higher highs and holding above prior resistance.
Volume expanded on the move — that’s what matters.
No prediction. No excitement.
Just managing risk and respecting the trend.
Let the chart do the talking.
Not financial advice.
$ZETA
📈 This chart has been quietly telling a story — and now people are starting to listen.
Early in the year, $ZETA gave traders a classic lesson in volatility: sharp run-up, fast selloff, weak hands flushed. Since then? The stock has been building itself back up piece by piece.
Here’s how to read it without the noise:
• Big spike → hype phase
• Deep pullback → reality check
• Long sideways grind → accumulation
• Recent push higher → momentum waking up
🧠 What’s interesting now:
Price is making higher lows, volume is showing up on green days, and sellers are no longer in full control. That’s usually how trend shifts begin, not how they end.
🧱 Simple takeaway:
As long as this structure holds, dips look more like opportunities, not danger zones. A clean push above recent highs could change the pace fast.
📌 Translation for normal traders:
This isn’t a “buy the top” chart — it’s a patience finally paying off chart.
$ZETA doesn’t look loud… and that’s usually when it gets dangerous (to shorts).
$OKLO📉➡️📈 From hype to reality — now comes the real test.This chart tells a full story. $OKLO went from a quiet base, to a vertical breakout, to a sharp pullback that shook out late buyers. Now? Price is trying to stand back https://t.co/vgfiXUVFD8’s how to read it without overthinking:• Massive momentum run = strong narrative + hot money
• Deep pullback = profit taking, not the end of the story
• Recent bounce = buyers defending a key zone
• Volatility is still high → this is not a “sleepy” stock🧠 What matters now:
$OKLO doesn’t need another moon candle.
It needs higher lows and clean follow-through.🧱 Simple levels:
• If this base holds → upside attempts stay alive
• Lose it → more chop and patience required📌 Translation for normal traders:
The easy money already happened.
The next move will reward discipline, not FOMO.$OKLO is no longer about speed — it’s about structure.
$NVO
📊 Daily Chart Breakdown
After a prolonged correction, $NVO is showing signs of stabilization and a potential trend shift. Recent price action suggests buyers are beginning to defend the current zone, with momentum attempting to turn back up.
🔍 What stands out on the chart:
• Downtrend from prior highs has slowed significantly
• Higher low forming after the recent selloff
• Strong green candle signals short-term demand
• Volume expansion hints at accumulation, not panic selling
🧱 Key levels to watch:
• Support: recent base area — must hold
• Resistance: prior lower-high zone — reclaiming it would confirm a reversal
🧠 Trade perspective:
This looks like a repair phase rather than a breakout — patience is key.
Trend confirmation comes only with follow-through and higher highs.
📌 $NVO doesn’t need to move fast — it needs to move right.
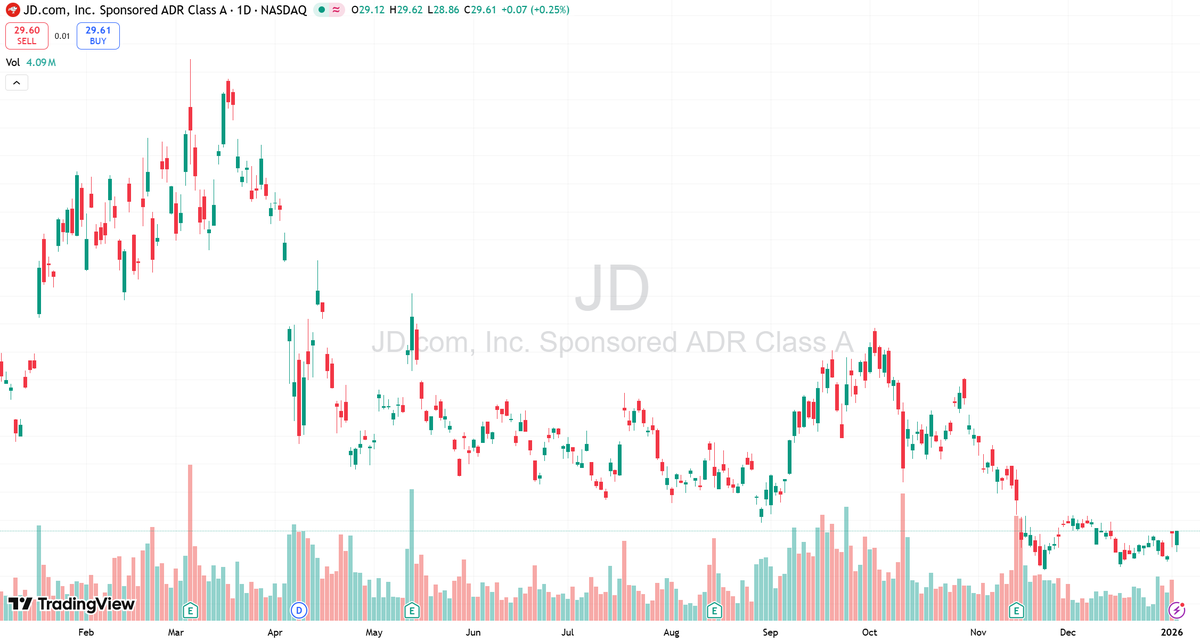
$JD closed at $29.59 today, posting a modest 0.19% gain (+$0.05) on volume of 4.08M shares. Session ranges: $28.86 (low) to $29.60 (high).
The stock’s narrow intraday movement reflects muted near-term momentum, consistent with recent sideways price action. Investors will likely monitor upcoming retail sector catalysts and operational updates for directional cues.
#JD #Equities #MarketUpdate
$TSLA closed today at $456.69, marking a 4.02% intraday gain (+$17.62) amid moderate trading volume of 25.4M shares. Session ranges: $444.57 (low) to $456.65 (high).
The stock’s recent price action reflects continued volatility in its near-term trajectory, aligning with broader sector momentum. Investors will likely monitor upcoming operational updates to gauge directional bias.
#TSLA #Equities #MarketAnalysis