Mark Minervini Setup
How to find stocks
Screen stocks that are within 25% of their 52-week high
Eliminate the following stocks
Eliminate stocks trading below 30
200 MA is rising for at least 3 months
50 MA is above 200 MA
Current price is above 200 SMA and preferably above 50 too
Current price is at least above 100% from 52-week low
The stock should have made a 52-week high at least once every 4 to 6 months
Buying Pattern
Make stock list every week after weekly closing
Use weekly charts
Use Volatility Contraction Pattern (VCP)
Use only Price and Volume
Stocks moving up with good volume and then falling with lower volume (consolidating) is good
Use weekly charts
AMO daily charts are good for seeing setting of the stock
Look for volatility contraction in daily charts (just for looking entry)
You don’t need to find new candidates every day, try to add to existing position
Breakouts should happen between 4–8 weeks
Win rate is only 50%, so be prepared
Post Buying Monitoring
Follow up buying
Green days vs Red days
Up Volume vs Down Volume
Tennis Ball Action
Shallow Pullback
VCP Pattern
Volatility Contraction Pattern (VCP)
To calculate volatility contraction, divide swing low by swing high then -1 gives the % drop in volatility
There should be ideally 3 VCP
Each time volatility should decrease by ideally 50% (not a hard rule)
Buy when the previous swing high is taken out
With volatility, there is also time contraction which is very similar to price contraction
Take a stock for 2 VCP only if the second contraction is more than 70%
Stop Loss Calculation
Plot 20-period ATR on daily chart
Calculate 2× of the above value
Use this value as your stop loss
Use maximum of 10% as stop loss
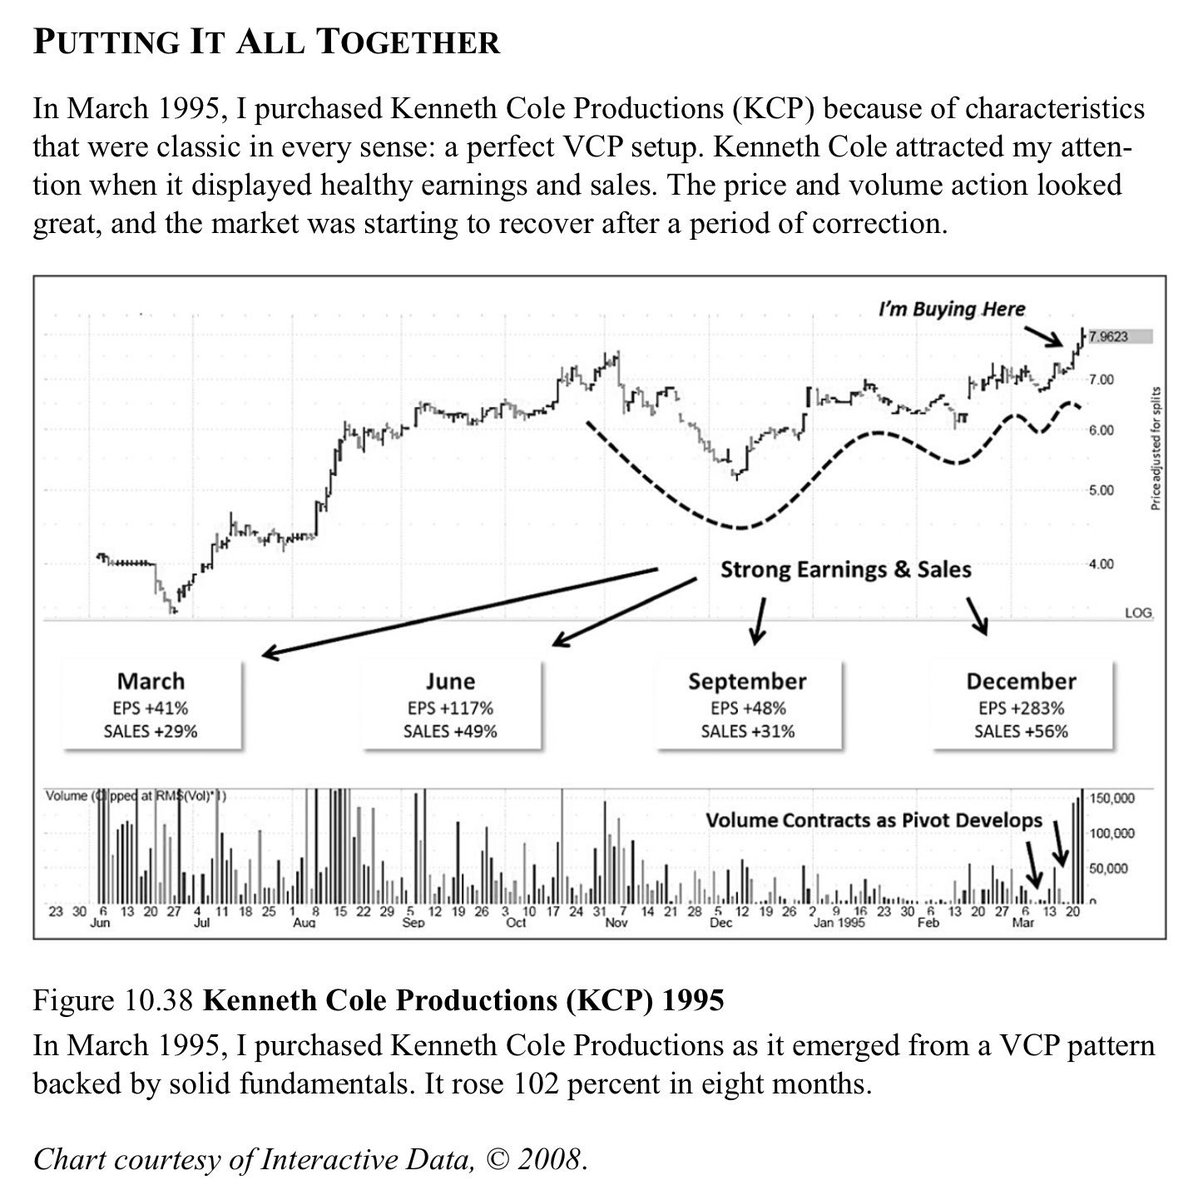
Here’s Mark Minervini coming into the ‘95 uptrend based on what stocks met his criteria. He didn’t get really aggressive until April ‘95 - had an incredible 413% return that year! From ‘Trade Like A Stock Market Wizard’ - Minervini 2013
Guru Dattatreya and Bhagwan Parashurama - The Bond of Guru and Shishya
In the luminous corridors of spiritual history, where the mundane dissolves into the sacred, there exists a relationship so profound that it transcends the boundaries of ordinary human understanding. The bond between Guru Dattatreya and his beloved Shishya Bhagawan Parashurama emerges as a celestial symphony of divine consciousness meeting prepared receptivity.
The Convergence of Cosmic Forces
When Bhagwan Parashurama, the embodiment of divine wrath tempered by dharmic purpose, approached the feet of Dattatreya Swami, it was not merely a meeting of Guru and Shishya, it was the convergence of cosmic forces ordained by the divine design itself. Dattatreya Swami, the Adi Guru whose very form contained the essence of creation, preservation, and dissolution, recognized in Parashurama a soul ripe for the ultimate transformation.
The Esoteric Transmission
In the secret chambers of spiritual instruction, Dattatreya Swami initiated Parashurama into the mysteries that cannot be contained in scriptures. The Guru's teachings were not mere philosophical discourse but living transmissions of shakti, divine energy that reorganized the very cellular structure of the disciple's being. Through the alchemical process of satsang (sacred association), Parashurama's consciousness underwent a fundamental metamorphosis.
"The warrior's axe, once a symbol of destruction, became in the Guru's wisdom a metaphor for the cutting away of ignorance. Each swing represented the severing of karmic bonds, each victory a step closer to the dissolution of the ego self into the vast ocean of pure awareness."
The Mystical Alchemy of Surrender
In the sacred laboratory of spiritual transformation, Parashurama learned the most esoteric of all sciences, the complete annihilation of the personal will in favor of divine will. This was not mere submission but a conscious offering of the ego self into the cosmic fire of the Guru's presence. Dattatreya, in his infinite compassion, received this offering and transformed it into pure gold of spiritual realization.
The Sacred Reciprocity
While Bhagawan Parashurama offered his complete surrender, Dattatreya Swami gave him something infinitely more precious, the recognition of his own divine nature. The Guru's love was not sentimental but transformative, burning away the disciple's limitations and revealing the eternal Self that was always present.
This sacred relationship reminds us that the Guru Shishya parampara is not merely a tradition but a living stream of consciousness that flows from the divine source through realized masters to sincere seekers. In this blessed lineage, the Guru's grace and the disciple's devotion create an alchemical transformation that awakens the soul to its true nature.
May this remembrance on Guru Purnima kindle in our hearts the same longing for truth and the same devotion that Bhagawan Parashurama showed to his beloved Guru Dattatreya Swami, for in that sacred relationship lies the key to our own spiritual awakening.
#Nifty goes to 30000 Plus wrote @sushilkedia
to our Susbcribers on a detailed analysis video.
Normally such research would cost upwards of 1000 INR, but with #RepublicDay available free for 72 hours. To get it:
a) Retweet
b) Follow us [We can DM you]
c) Nice replies Help
The reason @saylor claims Bitcoin is valuable digital property is because it's the only asset with a fixed supply. But anyone with a Solana address can create a meme coin with a fixed supply at practically no cost. The potential supply of fixed-supply digital assets is infinite.
Gann knowledge Day 1/100 .
Let's start from basics.
What is gann :-
Gann is a trading method developed by W.D. Gann that uses geometric angles and time cycles to predict price movements and identify support and resistance levels in financial markets.
Let's first start with gann angles :-
The 9 types of Gann angles, based on the slope of price movement, are:
1. 1x1 45 degrees
2. 1x2 63.75 degrees
3. 2x1 26.25 degrees
4. 1x3 71.25 degrees
5. 3x1 18.75 degrees
6. 1x4 75 degrees
7. 4x1 15 degrees
8. 1x8 82.5 degrees
9. 8x1 7.5 degrees
1×1 means that you can plot it on a graph as (1,1) and when you draw a line from the origin 0 you will get a 45 degree line.
Similarly, 1 x 2 on the graph means (1,2).
Now you can see the complete analysis of how to draw and apply on Trading View charts from our YouTube video:-
Already explained in depth:-
https://t.co/MwrbJkeXYu
Like and retweet as much as possible, this series will continue for the next 100 days.
#Gann #Stockmarket