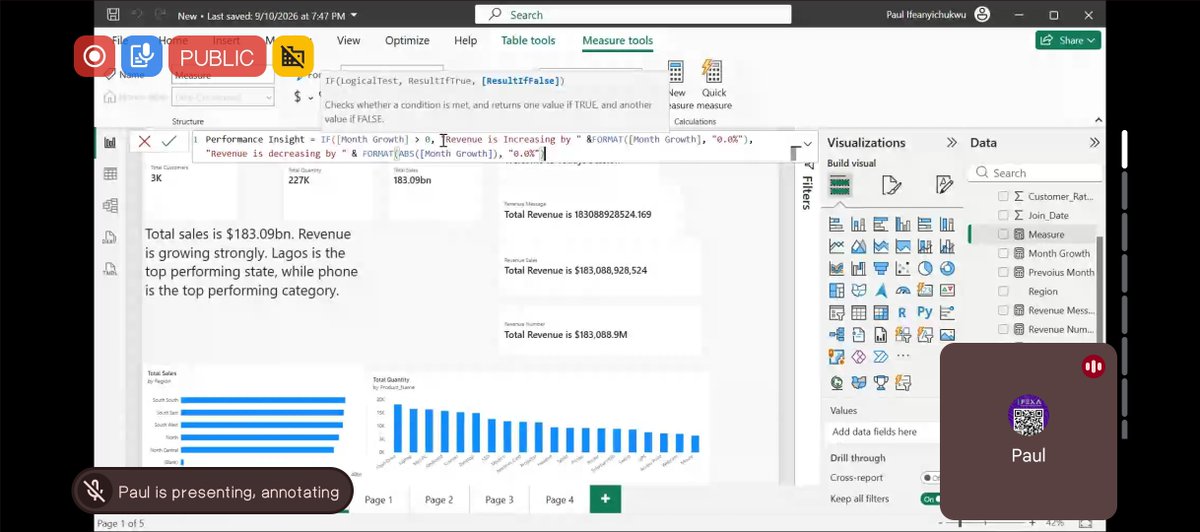
@Ifexaacademy@we_work_remote 4.Result: instead of "-0.12," the dashboard says "Revenue is decreasing by 12%." Way easier for stakeholders to digest at a glance.
5. Small DAX tricks, big UX difference. This is the kind of detail that separates a good dashboard from a great one.
#PowerBI#DAX#DataAnalytics
A thread on what I learned in today's Power BI session
1.We built a "self-narrating" dashboard, one that explains itself in plain English instead of making you interpret charts.
@Ifexaacademy@we_work_remote 2.The magic is a DAX measure using IF() logic:
IF(Growth > 0, "Increasing by X%", "Decreasing by X%")
3.Add FORMAT() to turn decimals into clean percentages, and ABS() to keep negative numbers readable in sentences.
And suddenly, data analysis becomes a whole lot more interesting.
Still a beginner. Still learning. Still building.
But honestly… I’m starting to see why Power BI is powerful.
#PowerBI#DataAnalytics#DataAnalyst#LearningInPublic
POV: You thought Power BI was just about making pretty charts… until you discovered DYNAMIC reports.
Long time, no post 😅
I’ve been busy learning and practicing Power BI, and one thing that really caught my attention is the difference between Static & Dynamic reports.
A static report basically says:
“Here are the numbers. Look at them.”
A dynamic report says:
“Go ahead, click around. Let’s see what the data is telling us.”
Filters change.
Slicers interact.
Numbers update.
Insights start appearing.
Today’s Power BI assignment is helping me understand how data connects behind the scenes. I’m learning how to build relationships between tables and structure my data properly before creating meaningful visuals.Still learning, still practicing, and getting better with every step.
Tough!!!, but today was about getting the fundamentals right, linking Sales, Product, and Region tables in Power BI so every insight downstream can be trusted.
They say cast the net well before you fish,same energy with data. Get your model right first, everything else follows.
A year ago I couldn't tell you what a pivot table was.
Today I spend my mornings cleaning messy datasets and my evenings learning SQL, because I got tired of just entering numbers, I wanted to understand what they meant.
Nobody hands you a "career change" moment.
Today’s class was all about getting introduced to Power BI
And honestly, I’m excited about what’s ahead.
Power BI can turn messy data into meaningful insights through data cleaning, transformation, visualization, dashboards, and reporting.
Coming from Excel, seeing how Power BI takes data analysis to another level was really interesting.
This is just the beginning of my Power BI journey, and I’m looking forward to learning how to build interactive dashboards, uncover trends, and tell better stories with data.
And this week, we started FILTER — learning how to pull exactly the data I need from a dataset.
Every formula I learn feels like another step toward becoming a better Data Analyst.
Learning. Practicing. Building. Improving.
#DataAnalytics#Excel#DataAnalyst
Last week, I was getting comfortable with Excel formulas. This week, we’re filtering data.
So far, I’ve covered: ✅ SUM
✅ SUMIF & SUMIFS
✅ LEN
✅ CONCATENATE
✅ IF
✅ AND / OR