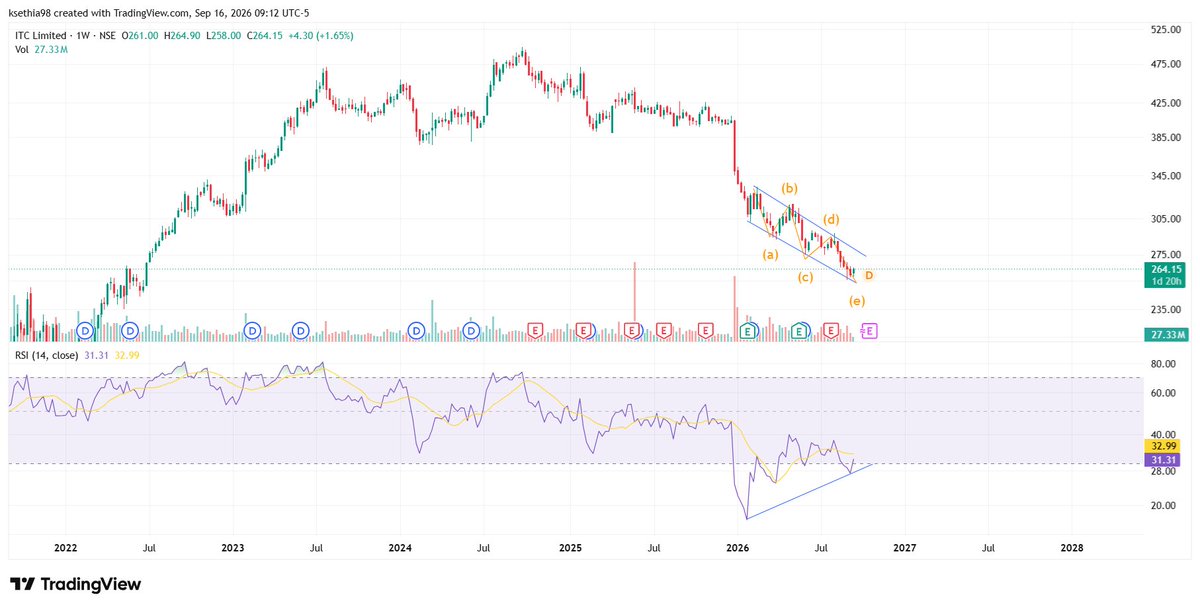
#ITC
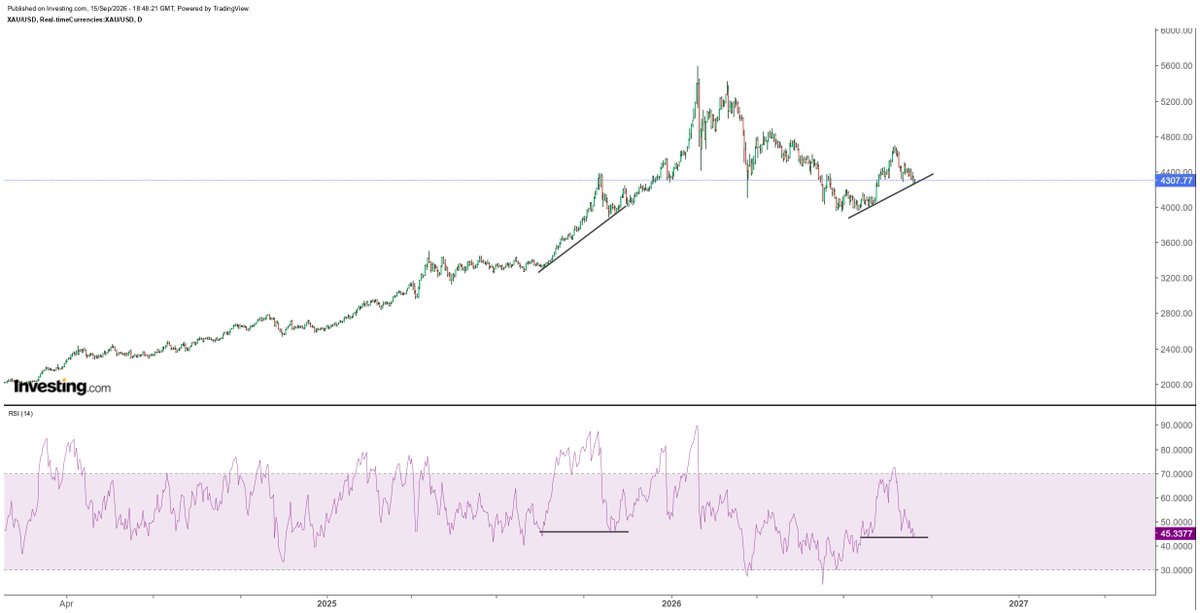
Major divergence observed on weekly charts. Next move begins once we breakout from this sloping trendline. If we dont, we continue to remain in this correction territory.
#ITC#FMCG#Commodities#Inflation#Silver#Nifty#Gold
#Nifty50
Well we did fill the gap around 23625 like I said we would and then we headed lower.
On the daily chart, there is no observed divergence yet and today was nothing but a dead cat bounce in my honest opinion. It might even continue into tomorrow.
However, on the 4H chart, there is a clear divergence that we can see.
BTW - Fed Interest Rate Decision today. This might influence the next move in Nifty.
#Gold #Silver #Fed #Nifty #EW #Technicalanalysis #Commodities
HFCL Update: Rejection Confirmed – Bearish Fakeout Playing Out ⚠️
Following up on our structural exhaustion warning, HFCL Limited has officially locked in a severe rejection at the multi-decade trendline, confirming that the initial push higher was a major macro fakeout.
Structural Setup: The price action failed to sustain above the multi-year resistance line and has broken sharply lower, printing a dominant weekly bearish engulfing candle down to 212.91 (-8.89%).
Divergence Playing Out: The massive bearish divergence we flagged on the weekly RSI (61.26) is now actively executing.
Momentum has collapsed cleanly under its internal trendline support, showing an aggressive exit of buyers.
Correction Targets: The stock has officially entered a deep corrective phase, with price rapidly accelerating toward our primary horizontal downside target at 171.17.
#HFCL #TechnicalAnalysis #TradingView #BearishRejection #EW #Stockmarketindia
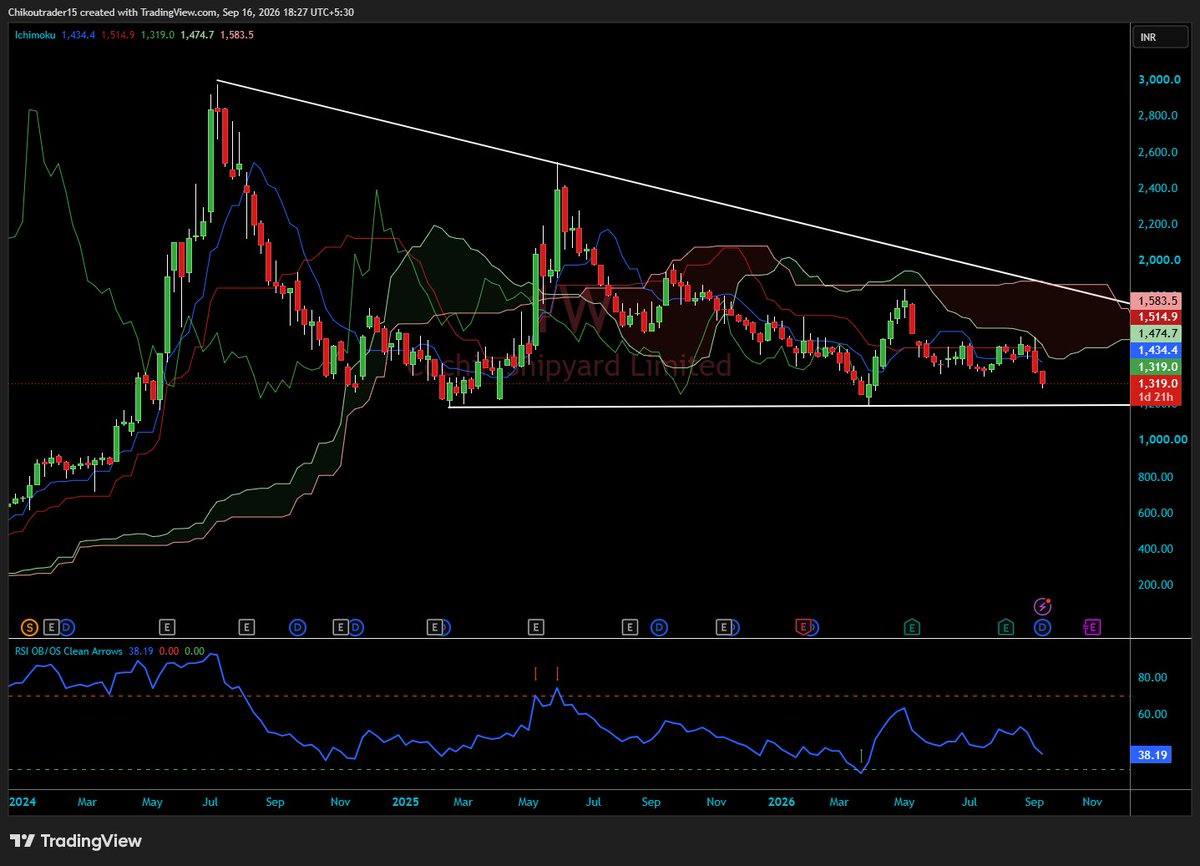
COCHIN SHIPYARD IS AT A MAKE-OR-BREAK ZONE
BOOKMARK THIS TWEET !!
#COCHINSHIP has spent almost 2 years compressing after the 2024 mania.
Now price is back near ₹1,300–₹1,320 - a zone that has repeatedly acted as a major floor.
What makes this chart interesting?
• Monthly structure is sitting almost exactly on long-term support
• Weekly RSI is only ~38 - momentum is weak, but not washed out
• Price is still below a huge falling trendline from the 2024 peak
• Immediate recovery zone: ₹1,430–₹1,515
• Bigger supply zone: ₹1,560–₹1,725
• A sustained move above that falling trendline could completely change the long-term structure
But the other side matters even more:
⚠️ If ₹1,280–₹1,300 breaks decisively, this 2-year base can fail.
That could open a much deeper correction.
So this is NOT a “buy because it fell” chart.
This is a decision-zone chart.
📌 Bookmark these levels:
₹1,300 = Survival zone
₹1,515 = First strength signal
₹1,725+ = Bigger trend-change zone
The stock that once went vertical is now doing the opposite:
Compressing. Testing patience. Building a massive decision point.
Because when Cochin Shipyard finally leaves this 2-year structure, the next move may not be small.
#CochinShipyard #DefenceStocks #StockMarketIndia #TechnicalAnalysis #Investing
📌 Note : SEBI UnRegistered, DYOR, refer Bio for Disclaimer.
FII NET SHORT FUTURE −2.91L looks huge.
It is not bigger than Jan 2025.
Why? Lot size changed.
Jan 2025 lot = 75
Now lot = 65
22 Jan 2025 peak
−3.50L × 75 × 23,155
= 2.63 crore Nifty units
≈ ₹6.1 lakh crore
FIIs were 18% long
15 Sep 2026
−2.91L × 65 × 23,119
= 1.89 crore units
≈ ₹4.4 lakh crore
FIIs are only 12% long
Yesterday is 72% of the Jan 2025 peak.
Smaller book.
More one-sided.
Only 9 days since 2025 were more short than yesterday:
13, 14, 16, 17, 20, 21, 22, 23, 24 Jan 2025
What Nifty did after shorts first crossed 3 lakh
(17 Jan 2025, Nifty 23,203):
7 days later 22,829 −1.6% shorts already covering
13 days later 23,739 +2.3% bounce
30 days later 22,125 −4.6% bounce failed
cash selling was still on
10-year record:
After FII net-short days, Nifty made ~6% a year
After FII net-long days, Nifty made ~17% a year
When FIIs flip from short to long, Nifty was up in the next 30 days more than 90% of the time
Jan 2025 = 2-week spike, then cover, then they flipped long in May
Sep 2026 = 16 months of shorts. Different beast.
So:
−2.91L is not a buy button
−2.91L is not a crash button
It means FIIs are hedged.
Retail is still long the other side.
If shorts start falling, bounce can start.
If cash selling continues, bounce can fail.
Trend is still down below the 200 EMA (~24,300).
Support map: 23,000, then 22,800, then 22,200.
Not advice.
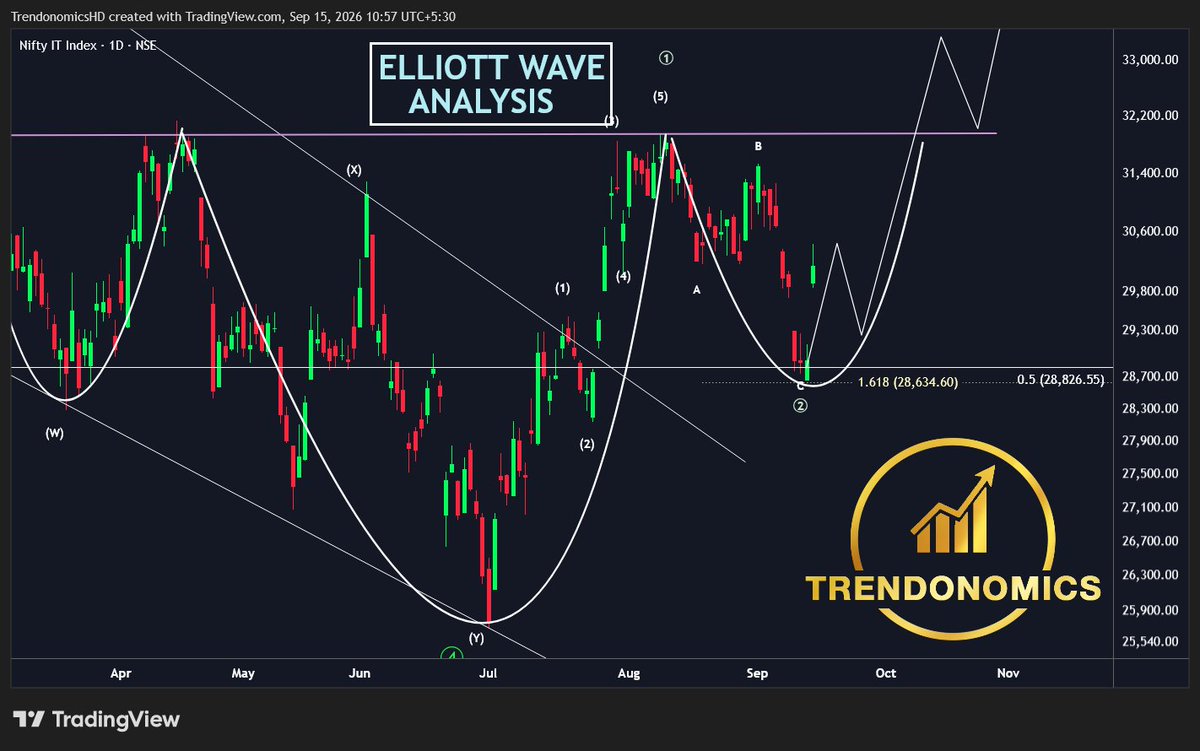
🚀 #NIFTYIT — WAVE 3 IS LOADING! 🌊
📈 Getting Ready for the 3rd Wave — Just as Projected.
📲 FREE Telegram:
👉 https://t.co/qKl0sr8ZC9
👉 https://t.co/QO2xtpFVYv
The Wave 2 correction may have done its job.
🔥 Now the next Impulse could be BIG.
👀 Keep #NiftyIT on radar.
🔖 Bookmark & ♻️ Retweet
⚠️ Not a buy/sell recommendation.
#NiftyIT #ElliottWave #Wave3 #ITStocks #TechnicalAnalysis #TRENDONOMICS
🚨 7 FRESH #BREAKOUT STOCKS FROM MY MULTIBAGGER SCREENER
1,669 STOCKS SCANNED.
ONLY 7 FRESH BREAKOUTS.
That is the edge of a good screener:
Less noise.
Fewer random charts.
Better focus.
🔖 Bookmark this list and track them.
Want the same system to find Multibagger, Swing and Positional setups?
👉 GET ACCESS to Multibagger Finder Screener + Indicator NOW : https://t.co/Y4xwJVHRxx
⏳ Ganesh Chaturthi special pricing ends soon.
1 Year: ₹5,999
≈ ₹16/day
#Multibagger #BreakoutStocks #StockMarketIndia
📌 Note : SEBI UnRegistered, DYOR, refer Bio for Disclaimer.
#COCHIN SHIPYARD. ON 11 09 26 THE TRADE GAVE A BREAKOUT N DID A HEADFAKE..POSSIBLY TO TOUCH THE ROUND LEVEL MARKED AT THE BASE OF TRENDLINE! THAT IS HOW LIQUIDITY IS HUNTED! ITS NOT BE MISS TRADE!
Infosys - Long-term only
My Accumulation Plan:
50% = 1000-1050 (200 EMA on M)
30% = 900-920 ( New Low in Market)
20% = 780-800 (Worst Case)
Disc: Do your own research. No Buy/Sell Advise.
#Infosys#Stockizen 🦚
TCS - Long-term only
My Accumulation Plan:
50% = 2000-2050 (200 EMA on M)
30% = 1800-1850 ( New Low in Market)
20% = 1600-1650 (Worst Case)
Disc: Do your own research. No Buy/Sell Advise.
#TCS#Stockizen 🦚
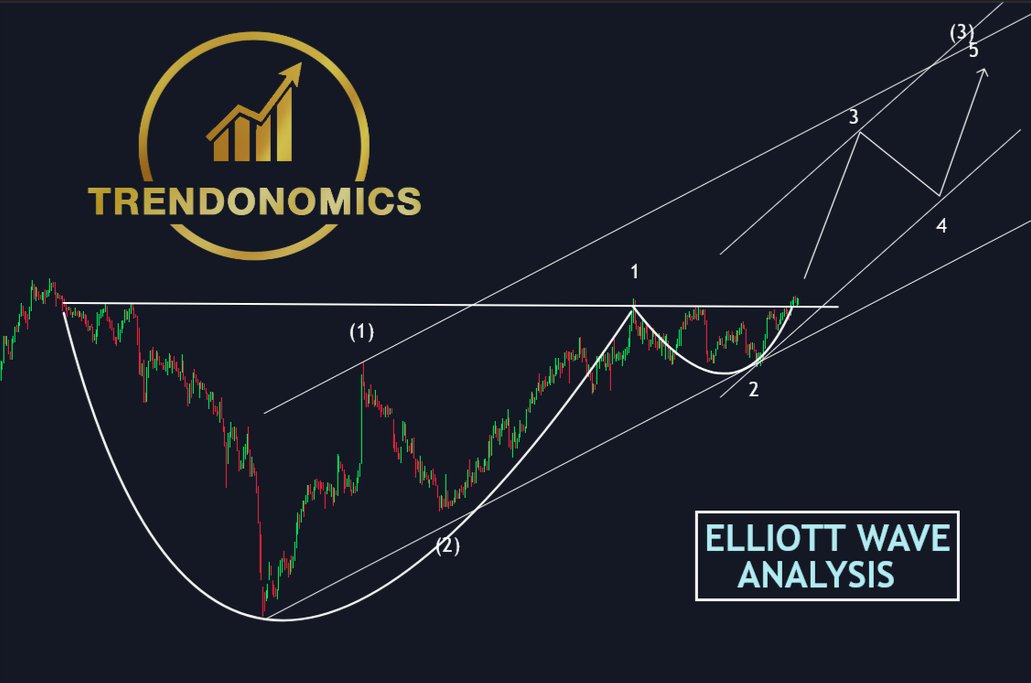
🏦 MULTI-YEAR BREAKOUT! 💥💥
📈 Multi-Year Breakout
☕ Cup & Handle Breakout on Monthly Chart
🌊 Wave 3 Candidate
📲Shared In my FREE Telegram Channel:
👉 https://t.co/qKl0sr8ZC9
A major long-term breakout with a potentially powerful Wave 3 Impulse ahead.
🔥 This is one to keep firmly on the radar.
🔖 Bookmark & ♻️ Retweet
🔗 https://t.co/QO2xtpFVYv
⚠️ Not a buy/sell recommendation.
#ElliottWave #Wave3 #CupAndHandle #Breakout #TechnicalAnalysis #TRENDONOMICS
#jeffereis is also bullish on #idea now 💥💥
keep adding for fresh entry as well
Target is all time high (off course it will take its time (5 years) its not gonna come tonight)
https://t.co/lC6E4LMFy3