ok fine i made some Pavement datavis
comparing setlists from the 2022-3 reunion to shows going back to the 90s
(ICYMI i went to 13 @pavement_band shows [17%] during the reunion)
not for the faint-hearted; know your versions of "Here" before entering:
https://t.co/tq9zvCxooD
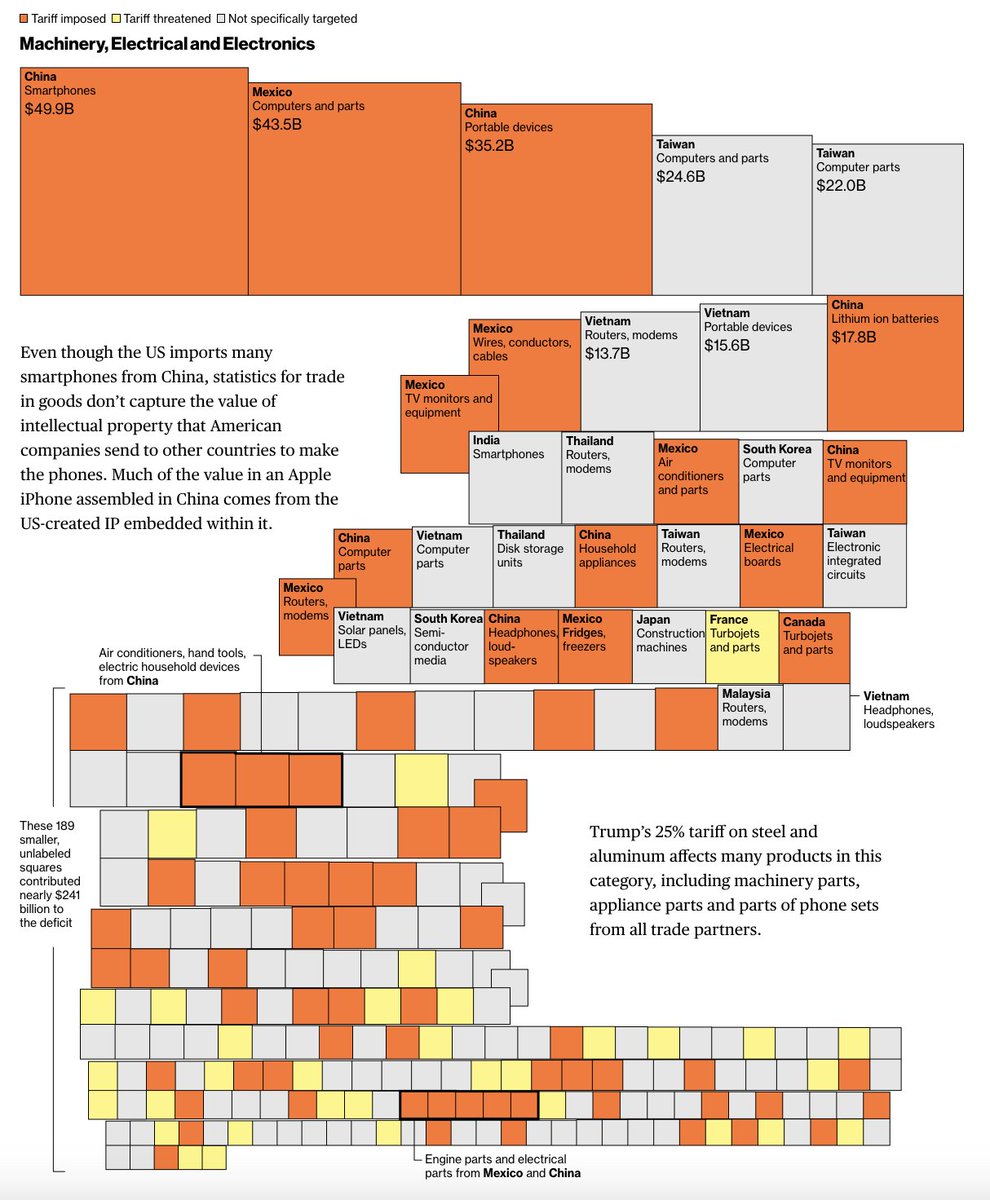
President Trump wants to reduce the $1.2 trillion trade deficit, so he’s putting tariffs on popular imported goods from smartphones to household appliances.
🔗🔁🟧🟨⬜️: https://t.co/7rv4YNkWEq
Trump wants to eliminate the US trade deficit by imposing tariffs on major trade partners. So what drives the deficit and who's actually getting hit? @raeedahwahid and I took a look at everything from toys from China to oil from Canada. gift link: https://t.co/hmfNZtbXxB
❄️🎄❄️🎄❄️🎄❄️🎄❄️🎄❄️🎄❄️🎄❄️🎄
when's the last time communities across the US have seen a white Christmas? for some folks, it's been decades.
❄️🎄❄️🎄❄️🎄❄️🎄❄️🎄❄️🎄❄️🎄❄️🎄
gift link: https://t.co/7EcdOUZV5l
we built a custom model to identify ships engaging in illicit ship-to-ship transfers of oil from optical and radar satellite imagery. read this story by @ClaraDFMarques@helloimserene@soonweilun and @YasufumiSaito.
🎁: https://t.co/R7H1C1PhVW
NEW! Our exclusive analysis of satellite images exposes how billions of dollars of sanctioned Iranian oil are flowing to China via ship-to-ship transfers on the sea 🛰️👀🚢🚢
https://t.co/Cc0UZgdpwS
Fun project w/ @k3blu3@helloimserene@ClaraDFMarques@soonweilun
Our state demographics + economic indicators section on state pages was a favorite — it is incredibly helpful context to each state’s results while comparing it to other states or national averages
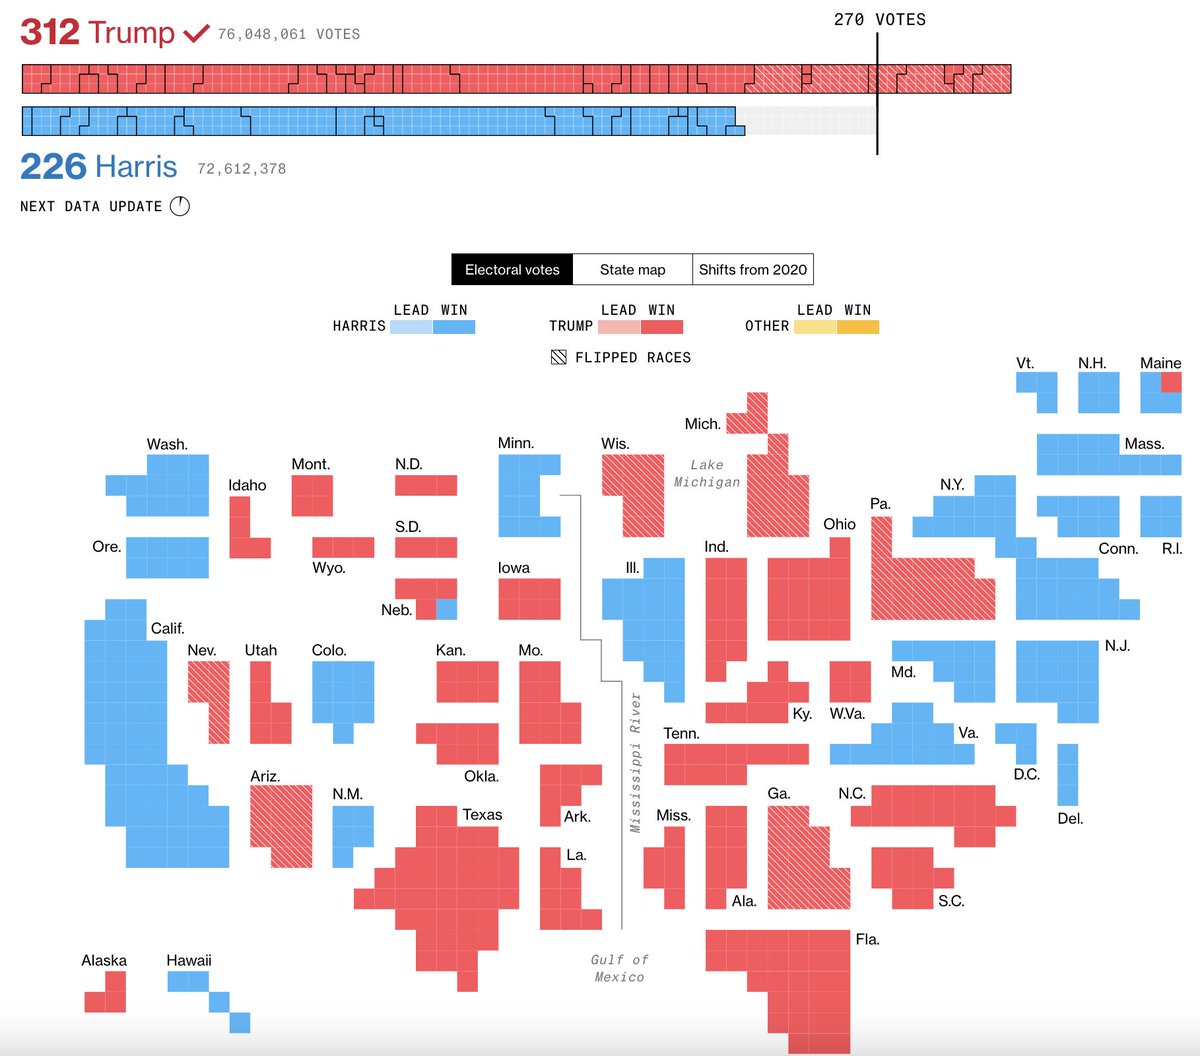
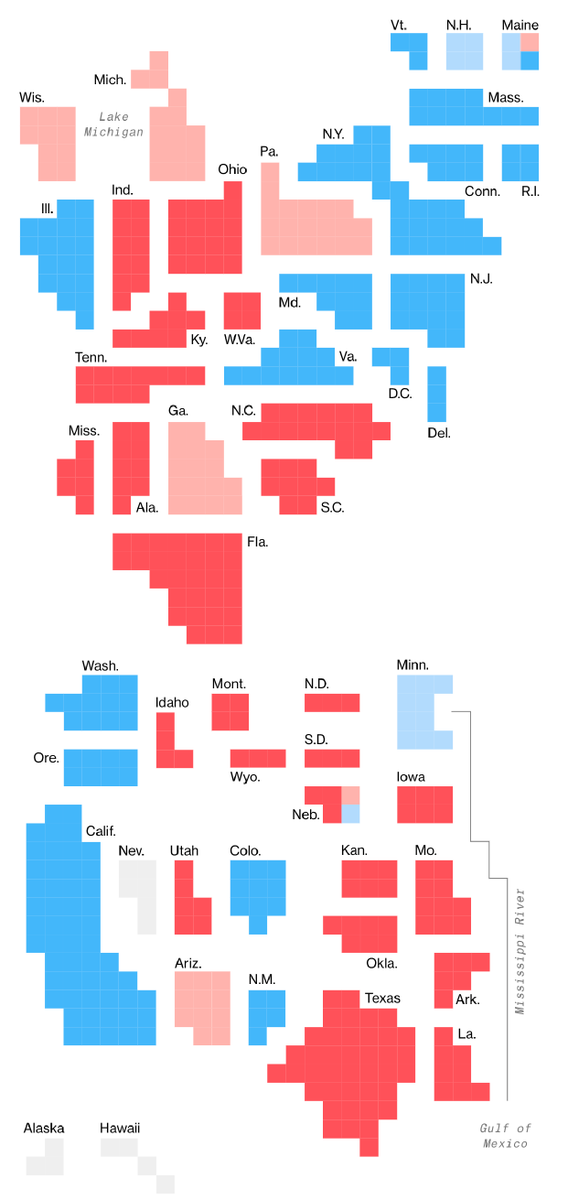
Cook Ratings are usually displayed as tables, but we switched to squares that would fill in based on the vote count to help users parse. You can quickly see who is leading and how much of the vote is in, as well as identifying races that were flipping
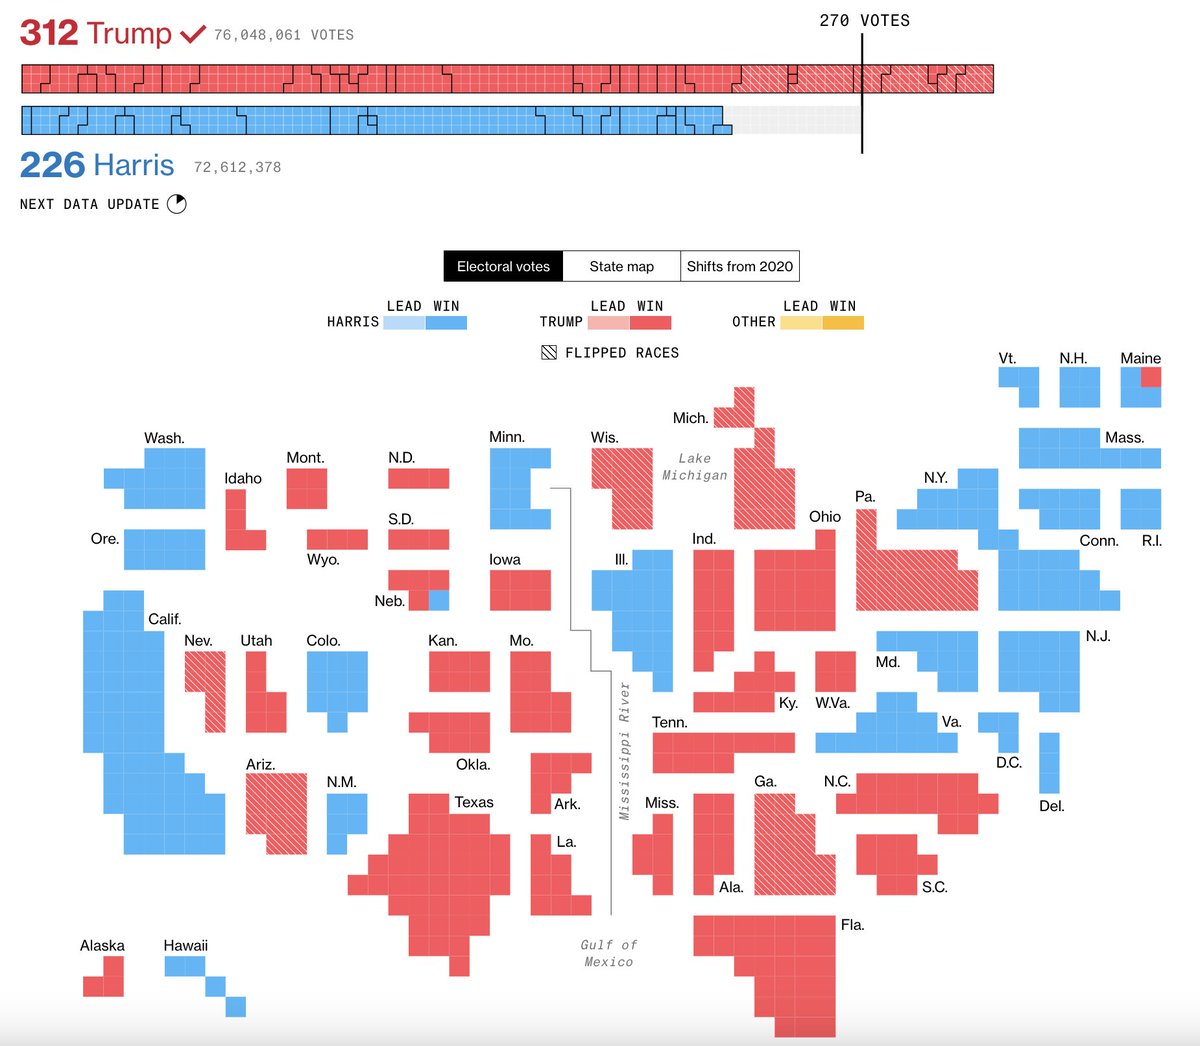
We wanted a balance of power graphic that showed a race to the finish line — and that used squares to mimic what you'd see on two of the cartograms. That’s how this Tetris-like graphic was formed
I’m really proud of the 2024 Election Results page that we designed and built at @BBGVisualData. There were a lot of new features for our pages this year 🧵 https://t.co/dur6uSQux4
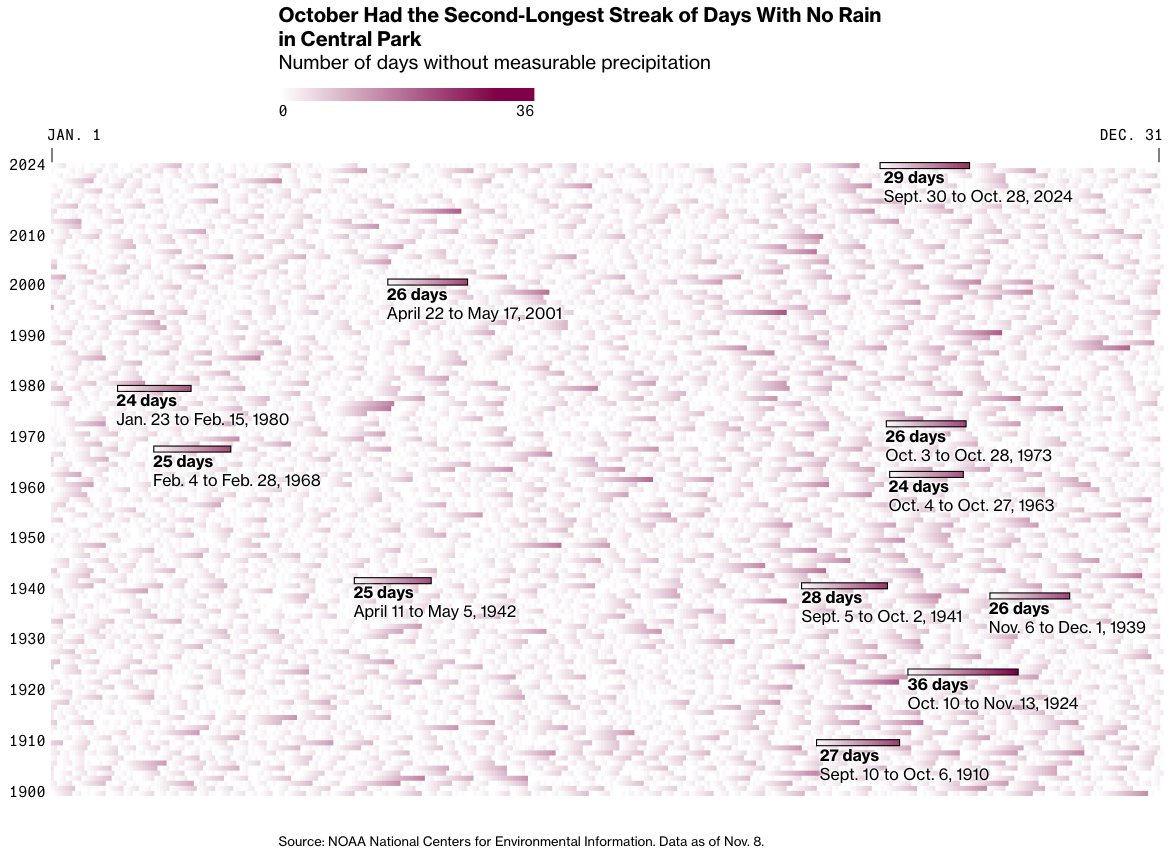
NYC is having the driest fall on record... only 0.01 inches of rain fell in October. There were 29 whole days with no rainfall, the second longest stretch in the city's history.
gift link: https://t.co/q1N1sejko5
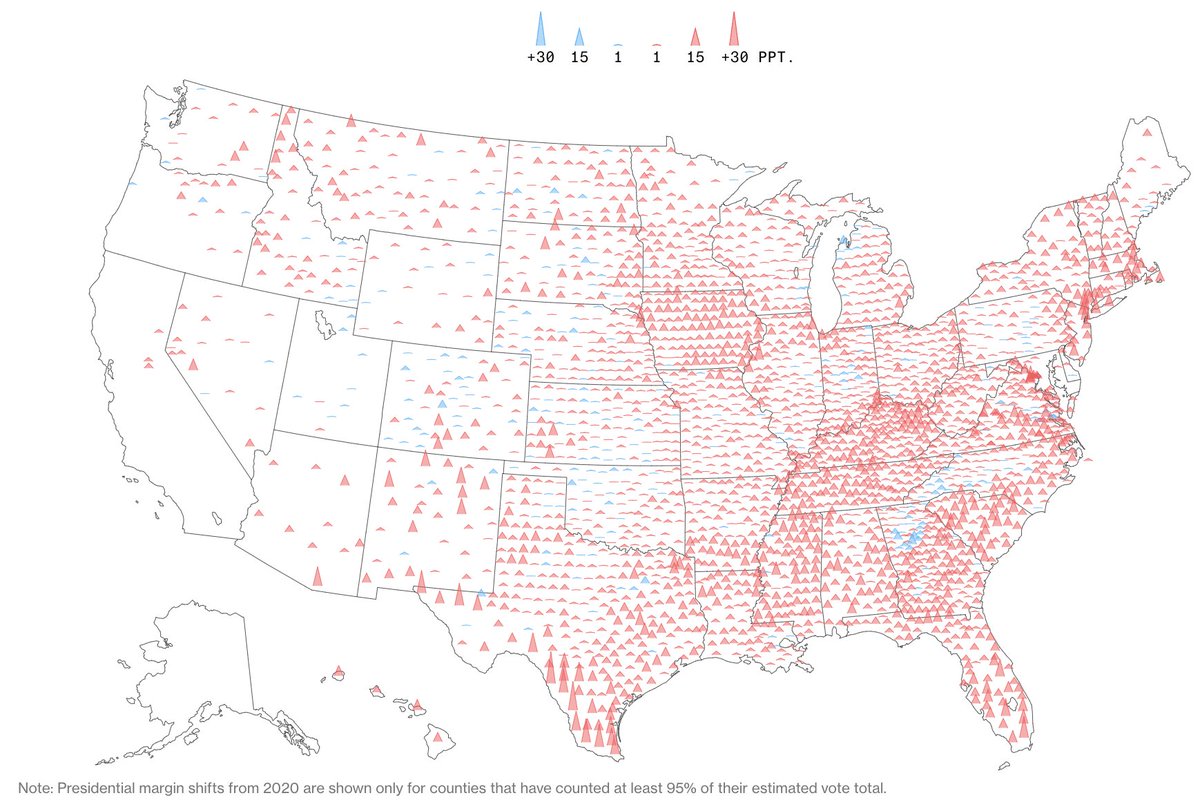
“The vote tally and Trump’s ultimate victory indicates that efforts to pin the fall of Roe v. Wade and subsequent abortion bans on him ultimately failed, even as most Americans continue to support reproductive rights.”
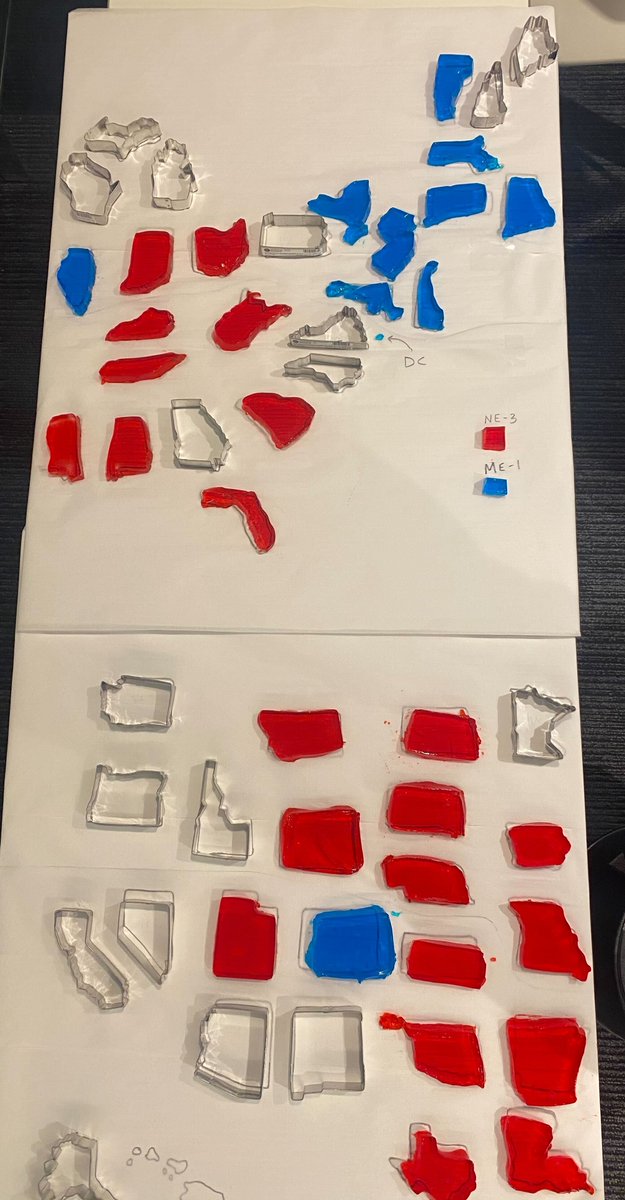
imp @BBGVisualData carto facts: we have a east-west mobile split mode, check out the results, see it all at once, also very important the jell-o map has a mobile mode to match
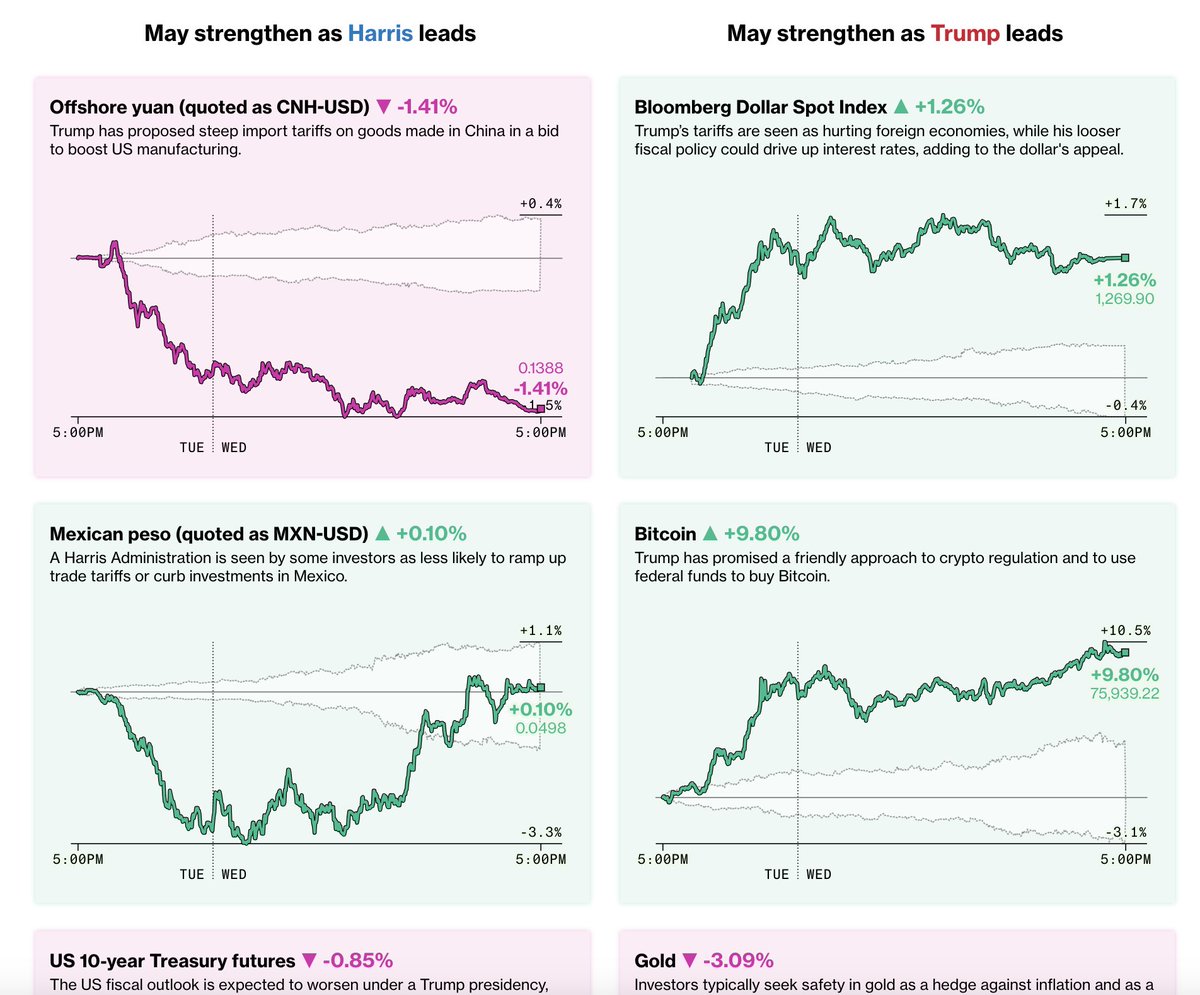
Bloomberg’s 2024 US Election Results: Live Market Reactions
👉 Track real-time prediction markets, crypto, global currencies, and Treasury futures alongside vote counts in key US presidential, Senate and House races 👈
🔗🗳️📈📉🇺🇸: https://t.co/ukSXPJJjpU
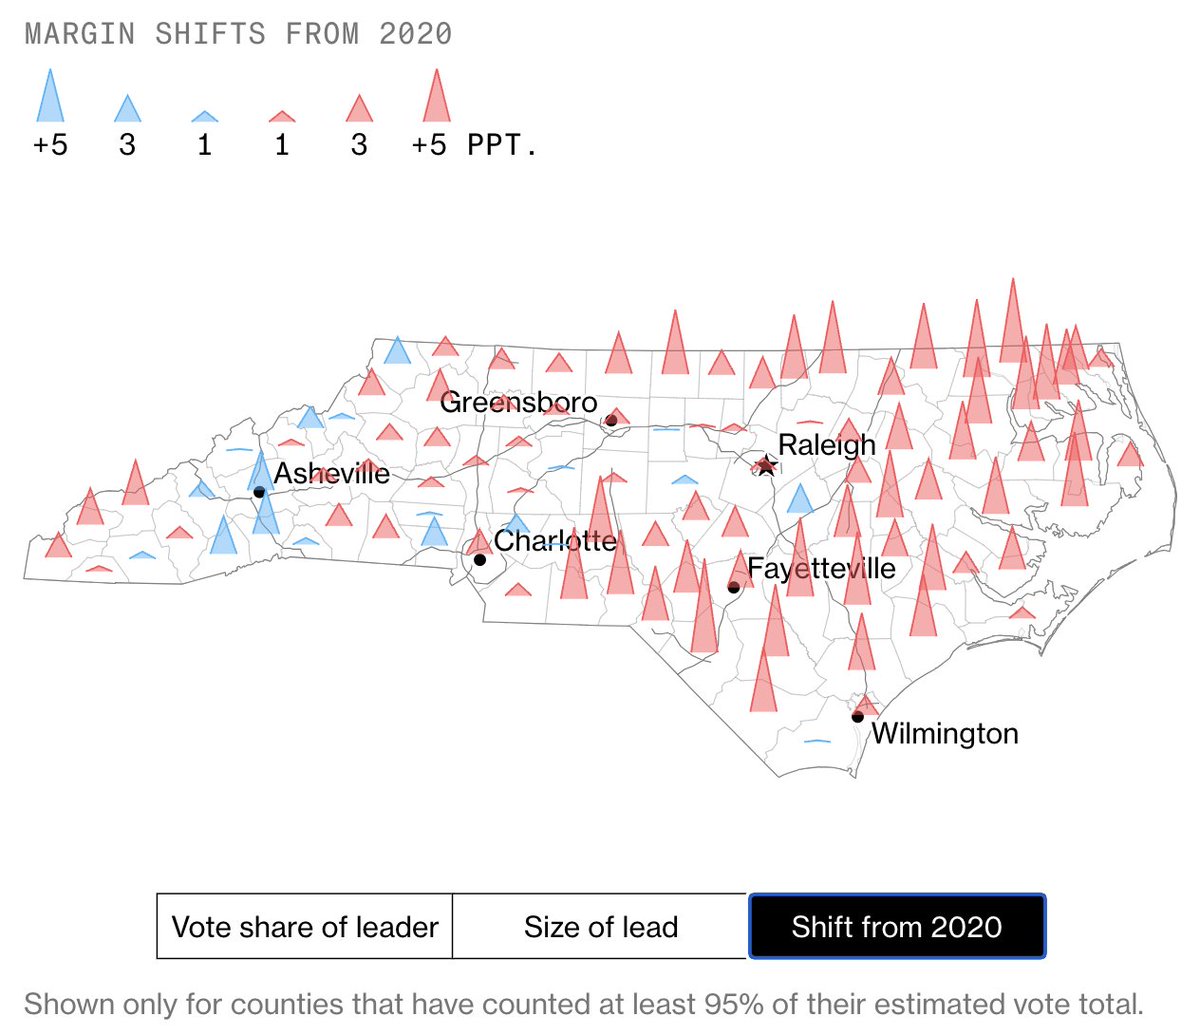
🧵🗺️📈📉 As part of @BBGVisualData's 2024 live election results pages, we've added a bunch of new features:
Highlights include poll closing time maps, real time tracking of prediction markets and an entire page following the results of 60 key ballot measures across the country.
The UK devised a clever but temporary way to insure flooding: subsidize high risk policies with low risk ones, and fund adaptation measures. We found 15% of the projects, covering ~ 6% of all at-risk homes, are set to complete before time runs out.
🎁https://t.co/jzGLmxULgx