Most traders are just providing liquidity for the 1%. 📉
They chase green candles. They trade FOMO. They listen to the news.
My edge? I don’t trade "feelings." I trade the architecture of the market.
What to expect from this account:
• Pure Geometry: No noise, no hopium. Just Elliot Waves & hard data.
• $BTC, $ETH, $SOL: Real-time structural breakdowns.
• Systematic Execution: Seeing the trap before it snaps.
Stop gambling. Start reading the tape.
Join the flow. Subscribe for the next move. 👇
🚨 WARNING: DO NOT JOIN THE SPACEX IPO!!
Read this before you touch it.
In 3 hours, SpaceX goes public at $1.75 TRILLION - the biggest IPO ever.
I've been trading for over a decade, and I have never seen them rewrite the rulebook like this
Nasdaq, MSCI, and the biggest brokers in America all bent their own rules for ONE private company
That doesn't happen by accident
Let me show you exactly what they did:
First, Fidelity dropped its minimum account size from $500,000 to $2,000
A 99.6% cut
Think about that:
The most exclusive door on Wall Street, thrown wide open to millions of small investors - days before the biggest debut in history.
Ask yourself one question
Why do they suddenly want YOU in?
Because somebody needs people to sell to.
SpaceX reserved 30% of the deal for retail
THREE TIMES the normal share
And even then, most people didn't get a full allocation.
So to grab more at Thursday's open, they're dumping everything else TODAY to raise cash.
That's half of the selling you're seeing.
The other half? The smart money front-running July.
Here's the trick:
SpaceX doesn't join the Nasdaq 100 on day one.
It joins 15 days later, because Nasdaq cut its own waiting period from 3 months to 15 days
Just for this.
The moment it joins, every QQQ fund on Earth is FORCED to buy.
$22–27 billion in automatic buying.
Translation: imagine 50 buses all forced to pull into the same gas station on the same morning.
The funds know the stampede is coming.
So they're selling now to free up cash for it. Retail selling. Institutions selling. At the exact same time.
THAT is your selloff.
Now here's the part nobody will say out loud:
When the most connected money on the planet builds a $1.7T exit door and hands the keys to the smallest investors in the market…
That's NOT generosity
That's distribution at the top.
We've seen this movie twice:
- 2000 Dotcom
- 2021 SPAC mania
Insiders cash out at insane valuations while the crowd chases the hype.
The math ain't mathing.
So you've got two choices in the next 48 hours:
Chase the most expensive IPO in history at the open…
Or read the prospectus and realize you might BE the exit.
The next few days will be INSANE, but don't worry - I'll break down every move as it happens, like I always do.
Like it or not, I called every major top and bottom of the last decade publicly. I'll call this one too.
Many people are going to wish they followed me before June 12, 2026.
Soon, you'll understand why.
Make or break moment for #Ethereum. 🧵👇
When evaluating the ultimate relative strength formula - $ETH vs. the Top 7 Global Mega-Caps (NVDA+MSFT+AAPL+TSLA+GOOGL+AMZN+META) - we find ourselves at a historic crossroads.
🔍 Key Technical Breakdown:
The 5-Year Floor: ETH is currently testing a massive macro buyer block. This is a crucial defense zone that has successfully held without a single breakdown for the last 5 years.
The Bull Case: If buyers manage to defend this historical support, it will lay the foundation for a brand-new, powerful mid-term bullish trend.
The Bear Case: A clean breakdown below this level is the ultimate danger zone. If this support fails, ETH will likely follow the "ADA scenario" — a painful, capitulatory multi-month bleedout.
⚠️ The Verdict:
We are sitting on the edge of a knife. This specific relative strength level will dictate Ethereum's trend for the rest of the year. Accumulation here offers an asymmetric risk-to-reward ratio, but tight risk management is mandatory.
Are you buying the blood here, or waiting for confirmation? Drop your bias below! 👇
#ETH #Crypto #TechnicalAnalysis #Macro
Is $Altseason finally loading? The charts are screaming yes. 🧵👇
Looking at the Altcoin Dominance chart (👇👇👇), a massive structural shift is officially underway.
🔍 Key Technical Breakdown:
The Breakout & Retest: Altcoin dominance has cleanly broken above its long-term multi-month trendline resistance. The current local pullback is a textbook retest of this broken trendline, flipping it into solid support.
The Target: If this support holds, momentum is heavily favoring a major rally. We are likely tracking towards the 24% target level by late Q3 / early Q4 2026.
The Verdict: The mid-term risk-to-reward ratio for accumulation is exceptionally high. The probability of a strong altcoin rally from these levels is significantly elevated.
📈 Strategy:
The "BUY" zones between 16% - 18.25% provided the ultimate macro accumulation floor. Now, the path of least resistance is officially shifting upward. Keep your eyes on the orange resistance block near 24.08% as the first major take-profit zone.
Are your bags fully packed, or are you still waiting? Which alts are you betting on for this leg up? 👇
#Altcoins #Crypto #TechnicalAnalysis #Altseason2026
Is the macro bottom for this #BTC correction finally in? 🧵👇
If we look at the ultimate relative strength formula — $BTC vs. the Top 7 Global Mega-Caps (NVDA+MSFT+AAPL+TSLA+GOOGL+AMZN+META) — a very clear macro picture emerges (👇).
🔍 Key Technical Takeaways:
The Massive Triangle: Bitcoin is currently compressing inside a giant macro multi-year triangle.
The Golden Golden Pocket: Price has just tapped the crucial 0.618 - 0.786 Fibonacci buyer block.
Historical Strength: In the previous cycle, BTC didn't even drop to the 0.618 level. This indicates that the probability of Bitcoin breaking down below $56,000 remains extremely low.
⚠️ The Line in the Sand
Holding this 0.618 - 0.786 zone is absolutely critical. A weekly close below the 0.786 level would trigger a major invalidation, potentially opening the door for a prolonged 5-7 year macro bear market (a full-scale historical correction).
As long as this green block holds, the structural bull market remains intact. Wave V is still the ultimate target. 🚀
What’s your take? Are we bouncing from here or breaking lower? 👇
#Bitcoin #Crypto #TechnicalAnalysis #Macro
🚨 MAJOR BITCOIN MACRO SIGNAL 🚨
The #BTC 1W Stoch [120] just crossed into the oversold buy territory for the first time in 3 years.
Take a close look at "👇👇👇"-every time this indicator drops to these levels, it marks the ultimate spot accumulation zone before a major cyclical trend reversal.
Smart money is building positions here. 📉⚡️📈
$BTC #BitcoinCrash #CryptoTrading
*NFA.
🚨 NEW $BTC BUY SIGNAL 🚨
The Daily RSI [120] has just triggered a rare buy signal for #Bitcoin.
Looking at the historical data in "👇👇👇", every time we hit these levels, it has marked a prime macro accumulation zone before the next massive leg up.
Current prices are looking incredibly discounted for long-term investors. Are you accumulating here or waiting? 👇
#BTC $BTC #Crypto #TechnicalAnalysis #BitcoinCrash
*Not financial advice.
$BTC is currently testing key mirror support levels formed by the highest peaks of 2021.
🔍
The local bleeding might be over for the week. However, the next few days are critical:
🔹 The Bull Case: We need a weekly close ABOVE $66,900 (major volume level) to secure the bounce and invalidate further downside.
🔹 The Bear Case: Fail to reclaim $66.9K, and a weekly close below it confirms a more complex correction. This opens the door for a drop toward $56,000 over the next 2 months.
Updating my local scenario soon. Watch the weekly close carefully.
Where do you think we close this week? 👇
#Bitcoin #Crypto #TechnicalAnalysis #Trading
$ETH Facing Key Resistance Confluence ⚙️
Ethereum is currently battling 3 major resistance levels:
1️⃣ H1 RSI [120] trendline
2️⃣ Local price trendline
3️⃣ Volume profile level at $2,117
A clean breakout above this zone flips the $2,000–$2,117 area into solid support, confirms a local trend reversal, and opens the doors for a massive run toward $2,500+.
Eyes on the charts. Patiently waiting for confirmation. 📊
#ETH #Ethereum #CryptoTrading #TechnicalAnalysis #Altcoins
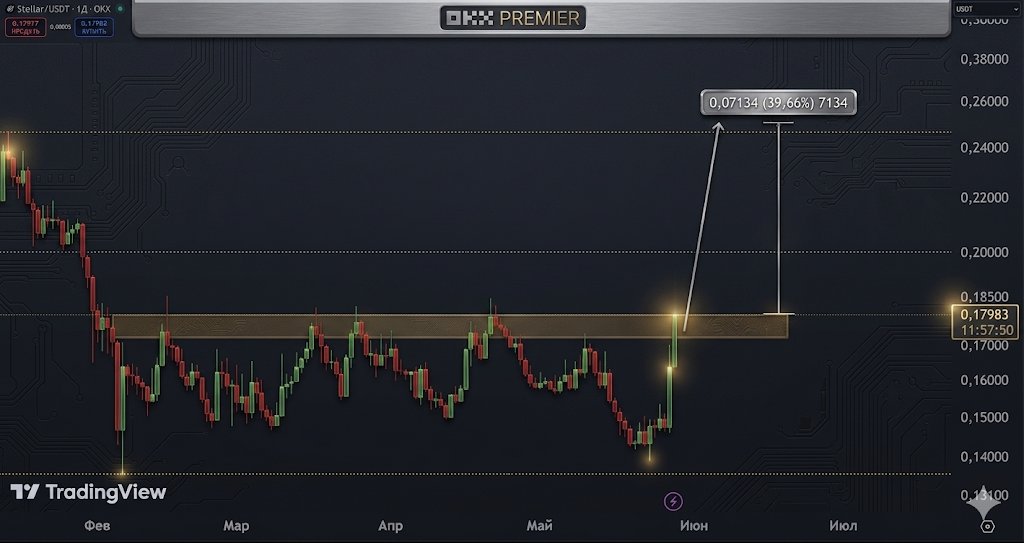
$XLM Breakout Mode 🚀
Stellar is currently breaking through the upper boundary of its accumulation range. If we secure a daily close above $0.18, the path clears for a potential +40% move toward the $0.25 target.
Full structure on the chart below. Watching the daily close closely.
#XLM #Stellar #CryptoTrading #Altcoins #TechnicalAnalysis
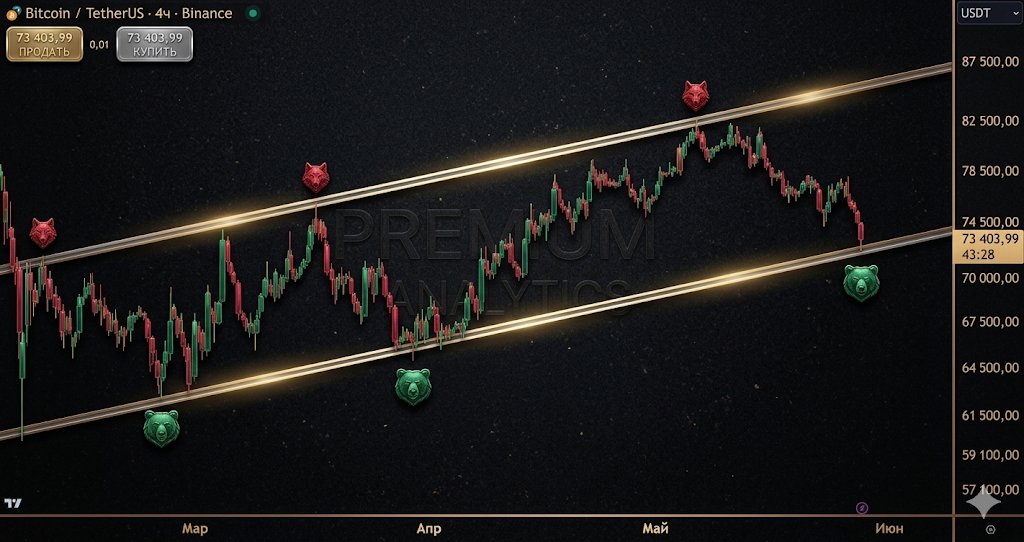
$BTC Update: Critical Level 🚨
We have officially reached the lower boundary of the ascending parallel channel.
Watching closely for a reaction here. A bounce confirms structure; a breakdown opens up lower targets. Stay patient.
#BTC#Bitcoin#CryptoTrading#TechnicalAnalysis
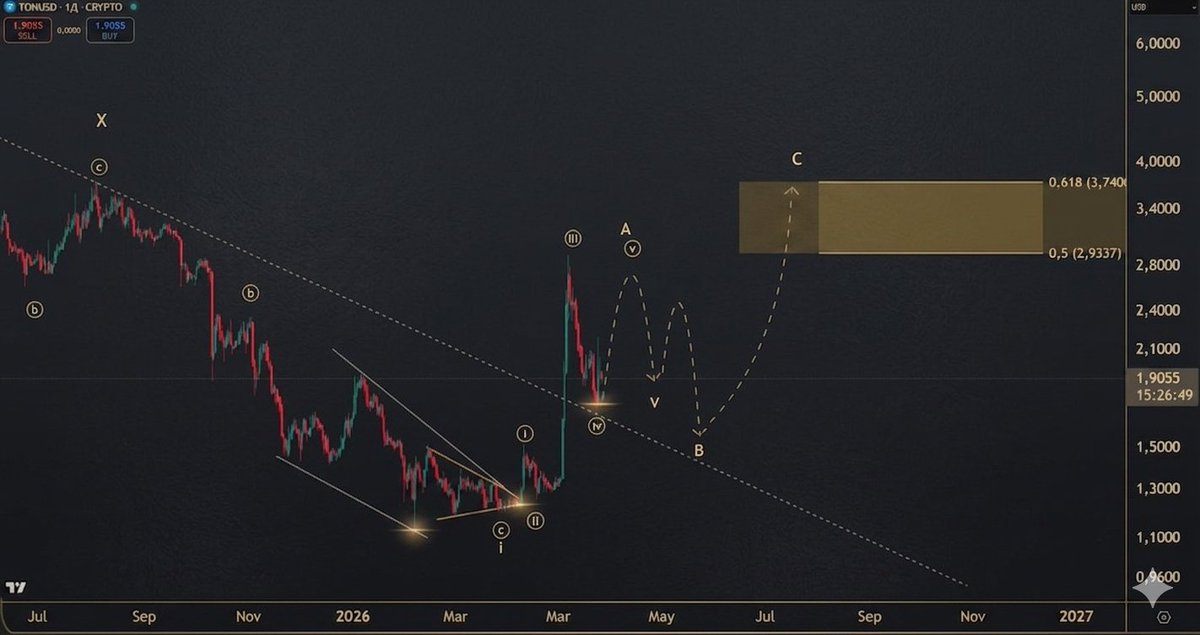
$TON Analysis: Retest in Progress 📉
We’ve pulled back to the broken trendline resistance. Given how aggressive this drop was, wave (v) of A will likely be truncated.
The primary scenario remains active. Eyeing late July / early August to hunt for mid-term long entries.
#TON #CryptoTrading #ElliottWave #TONUSD
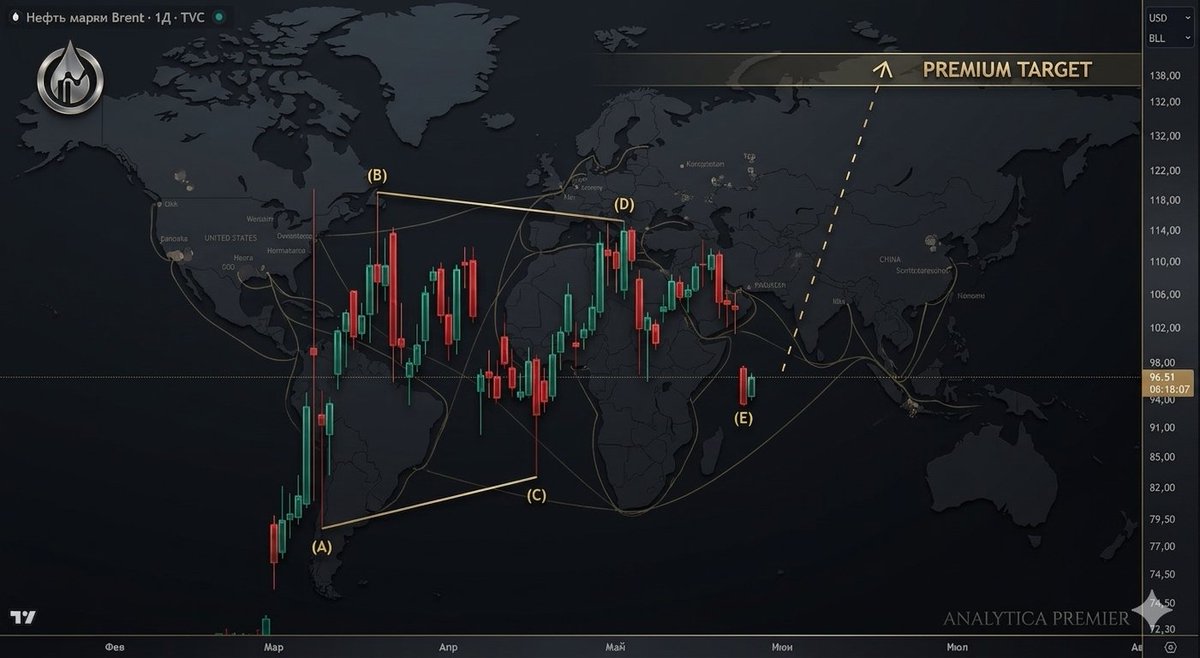
🛢️ $BRN (Brent): 1-Year Setup Holding Strong, Ready for Upside
On the Daily (D) timeframe, the planned correction is officially complete. Current market structure signals the end of the pullback and a resumption of the bullish momentum.
🎯 Next Target: retesting and breaking the local high at 138.00.
Technical structure looks solid. Long bias remains intact.
#Brent #CrudeOil #Trading #TechnicalAnalysis #Commodities
⚠️ $WTI is priming for a massive breakout. Are risk assets ready for a dump?
Crude Oil is packing energy inside a textbook ascending triangle. A breakout here likely triggers a swift, aggressive local dump across the entire risk sector (Crypto + Equities).
💡 The Hedge Play:
If you're heavy on crypto, going long on oil upon a clean breakout above $106/bbl looks like a textbook hedge.
If $106 cracks, oil flies, offsetting the temporary bleeding in BTC and alts. Eyes on the level. 📈
#WTI #Macro #Crypto #Bitcoin #TradingDYOR
$ETH correction looks complete. Buyers are stepping in, and the probability of a reversal is high.
The next 48 hours are critical: we need to reclaim and hold $2,200. If we push above this level, the macro scenario toward $2,500+ is officially confirmed.
Eyes on the charts. 📈
#Ethereum #ETH #Crypto #Trading
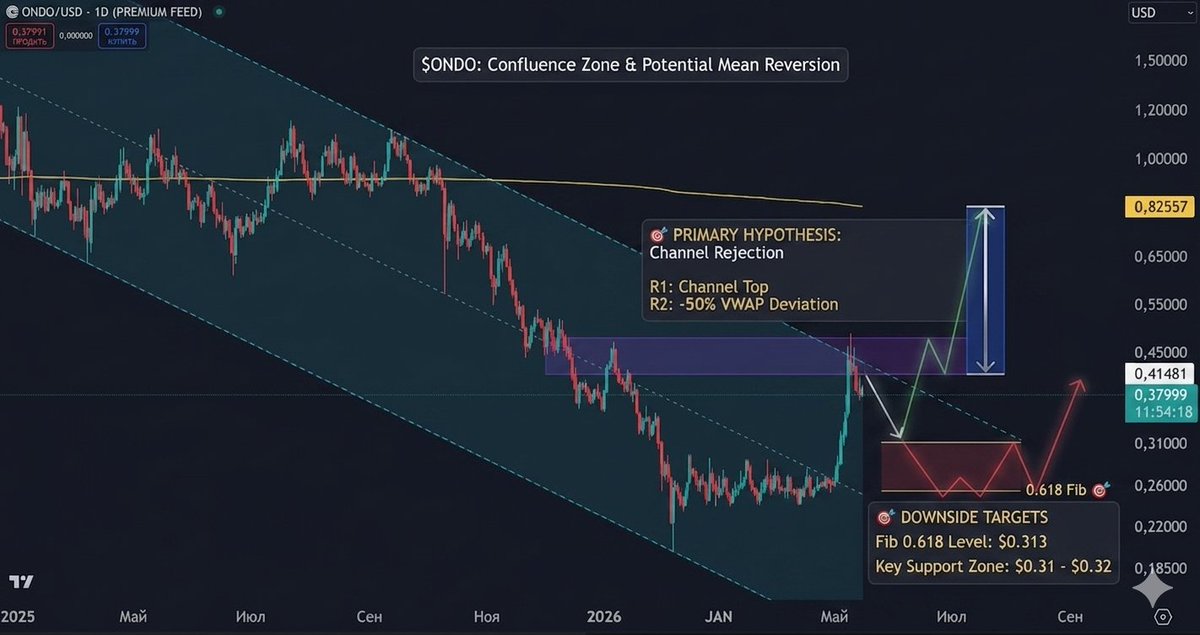
📉 $ONDO Technical Analysis: Local Top In?
$ONDO is currently respecting a descending parallel channel, with the recent pump stalling exactly at the trendline resistance and the -50% VWAP level.
Historically, this setup triggers a mean reversion. Here’s what I’m watching:
🔍 The Bearish Case (Short-term)
Target: A retracement to the 0.618 Fibonacci level (~$0.313).
Outlook: Expecting a cool-off over the coming weeks as liquidity gets swept lower.
🚩 The Big Picture
While the local volatility is great for traders, the macro outlook remains cautious. The probability of a new global bull trend starting this year is low.
Verdict: Great for scalp/swing plays, but not the ideal entry for a long-term "moon bag" just yet. Stay patient.
What’s your move? Buying the dip at $0.31 or waiting for a breakout? 👇
#ONDO #CryptoAnalysis #TradingView #Altcoins #RWA
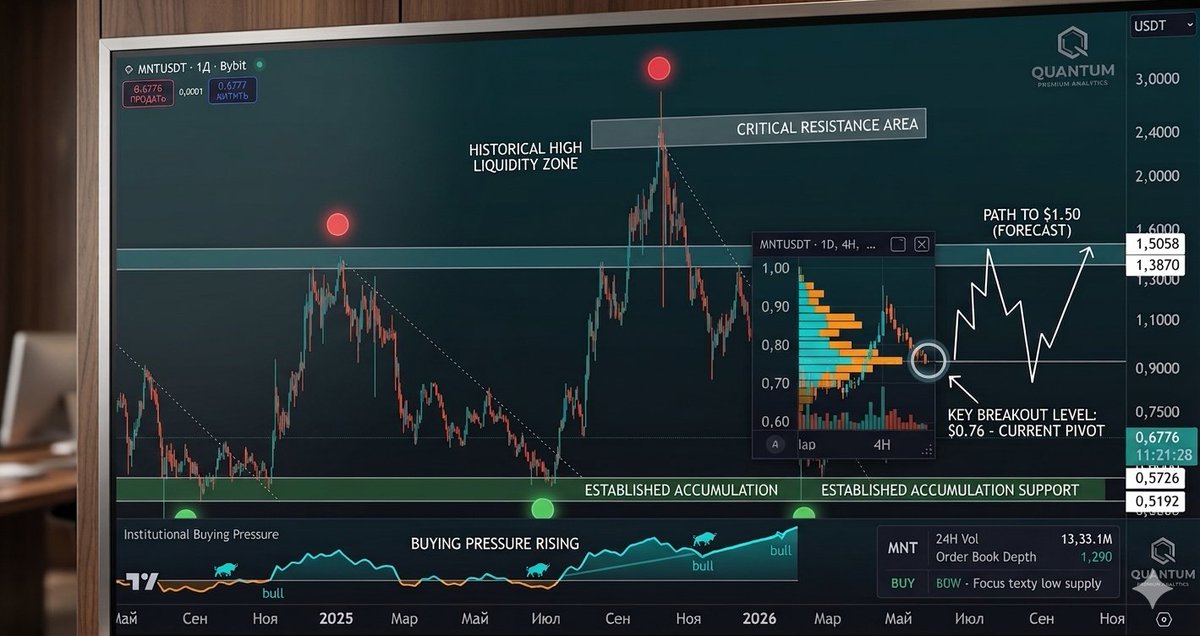
💎 $MNT (Mantle) – Primed for a Breakout
The sell pressure on $MNT has completely dried up. With such thin order books, pushing the price back above $1.00 will be incredibly easy once the momentum shifts.
The Setup:
Accumulation: Strong buyer presence visible on lower timeframes.
The Trigger: A clean break above $0.76 will likely ignite a fresh parabolic wave.
Target: Looking at a move toward the $1.38 - $1.50 resistance zone.
The chart is screaming "calm before the storm." Don't sleep on this rotation. 📈
#Mantle #MNT #CryptoAnalysis #Altseason #TradingSignals
💎 $XRP: The Calm Before the Storm?
Price action is still compressed within a well-defined range. Trading inside this sideways chop is a gamble—patience is the ultimate edge right now.
The Game Plan:
🚀 The Trigger: A clean breakout and flip of the red resistance zone at $1.512.
🎯 The Target: Once that ceiling breaks, expect a parabolic move toward the 0.618 Fib level near $1.80.
I’m keeping a close eye on the $1.512 level. If the bulls reclaim this, things could move very fast. 📈
Status: Sidelines until confirmation. ⏳
#XRP #Ripple #Crypto #Altcoins #TechnicalAnalysis #TradingSignals
📉 $BTC: Bull Trap or Distribution Phase?
The 4H chart is showing signs of exhaustion. We've officially broken below the ascending trendline that has acted as primary support for weeks.
Key Observations:
• Structure Break: Solid candle close below the dynamic trendline.
• Momentum Loss: Selling pressure mounting after failing to maintain local highs.
• Target: A liquidity sweep toward the $74k - $72k zone looks highly probable to clear out late longs.
Are you bidding the dip now, or waiting for a retest confirmation? 👀👇
#Bitcoin #BTC #CryptoTrading #TechnicalAnalysis #Bearish
🚀 Bitcoin: The 190-Day Breakout is Here!
For the first time in 190 days, $BTC has reclaimed the Short-Term Holder (STH) Realized Price. This is a massive shift in market structure.
The Analysis:
Historically, the STH Cost Basis acts as the "line in the sand" between bearish accumulation and bullish expansion. Staying above this level confirms that new capital is back in control.
Key Levels to Watch:
The Trigger: A weekly candle close above $78,000.
The Target: If we hold this level, the door swings wide open for a run toward $86,000+.
The momentum is shifting from pain to gain. On-chain data doesn't lie—the bulls are finally breathing again. 📈
#Bitcoin #BTC #Crypto #OnChain #BullMarket #TradingView
@TedPillows Clean structure! $BTC.D has been trending up for so long that people forgot how fast alts can run when it finally breaks down. Do you think this drop will be triggered by ETH strength or a general market rotation?