I just created this ICT Time elements + Macros @tradingview indicator that shows:
- ICT Macros
- Sessions
- Silver Bullet windows
- Market Opens
- Next 4h candle open
- Opening Range
Like + comment "TIME" and I'll DM it to you
(Make sure to be following)
I created this FVG + IFVG indicator with ChatGPT 5.5.
It's completely open source, so if you want to build on it or use the logic for your own indicator or strategy you're free to do so.
Let me know if you want it and I'll send you the link.
Follow me to enable me to DM you.
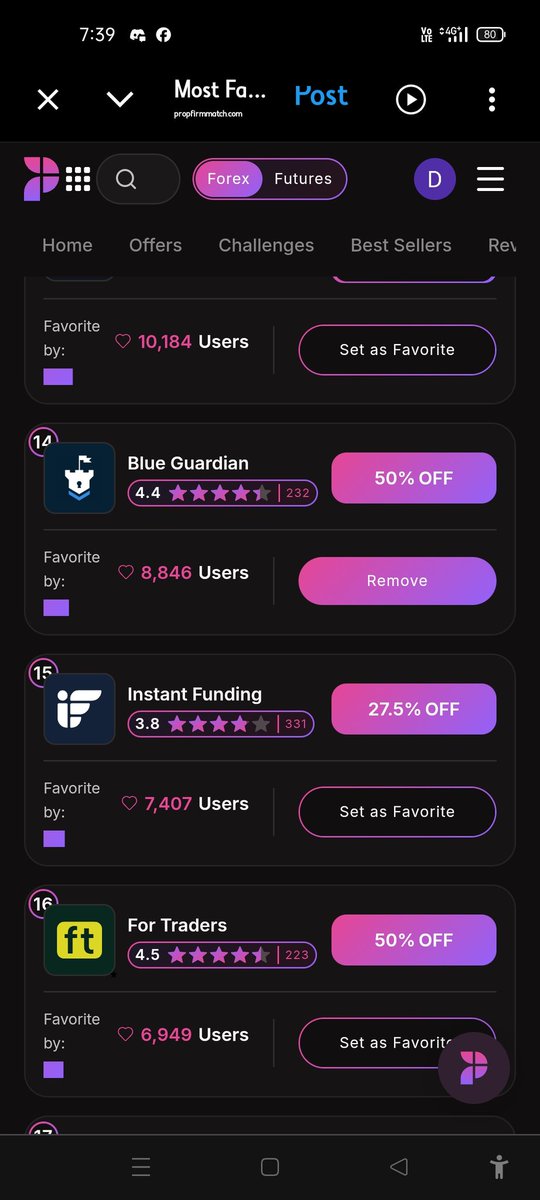
Let's host 2x5k giveaway. You MUST quote tweet our pinned post with it.
1. Follow @blueguardiancom, @guardianfutures, @guardiantvlive and @HirenFX + turn on notifications
2. Like, retweet and tag 2 friends
3. Add us as favorite firm at https://t.co/2Bm5tENlEW
4. Join HirenFx : https://t.co/LprCXhggNB
Winners Announce In HirenFx Discord🔥
🚀 My favorite GFT feature is Instant Funding and the simple trading system.
Great experience so far!
Thanks @Goatfunded and @EdwardXLreal 🙌
#GFT#Trading
Great experience with the GFT support team! Fast response and very helpful support. Really appreciate it.
Thanks @Goatfunded & @EdwardXLreal 🙌
#GFT#Trading
🎥 Fractal Chaos Bands in cTrader - how they work and how to use them
In this video, we explore Fractal Chaos Bands (FCB) in cTrader - a volatility-based indicator designed to help identify price trends and potential reversals by marking key high and low points in the market using fractals.
You’ll learn where to find Fractal Chaos Bands in cTrader, how to customise their appearance and visibility, and how the indicator forms upper and lower bands using fractal highs and fractal lows.
The video also shows how traders use Fractal Chaos Bands to:
• Identify bullish and bearish market conditions based on the slope of the bands
• Recognise sideways or consolidating market conditions when the bands move flat
• Spot potential breakout opportunities after narrow band conditions
• Interpret price breaks above or below the bands as signs of possible bullish or bearish momentum
📍 Timecodes
00:09 - Introduction: what are Fractal Chaos Bands
00:49 - Where to find Fractal Chaos Bands in cTrader and how to customise the settings
01:10 - How Fractal Chaos Bands are formed using fractal highs and fractal lows
01:44 - Using the bands to identify trending and sideways market conditions
02:54 - Spotting bullish breakout opportunities with narrow bands
03:37 - Identifying bearish breakout signals with Fractal Chaos Bands
- Learn more about the Fractal Chaos Bands https://t.co/zYVkMYUTe1
- Join Discord - https://t.co/KwuQbrw2dh
Don’t forget to like and share your thoughts in the comments!
_____________________________________
👉 Start Trading with cTrader - https://t.co/chQIER1Ve3 👈
🎥 Polynomial Regression Channels (PRC) in cTrader
In this video, we explore the Polynomial Regression Channels (PRC) in cTrader - an indicator that fits a polynomial regression line to recent price data and creates a channel around it to help identify market direction and potential dynamic support and resistance levels.
You’ll learn where to find the PRC in cTrader, how to adjust its settings and appearance, and how the indicator plots a curved, non-linear channel based on recent price data.
We also look at how traders use the PRC to interpret different market conditions. The video shows how the indicator can help identify bullish, bearish and ranging markets, spot overbought and oversold conditions when price moves outside the channel, and analyse pullbacks in trending conditions when price retraces towards the opposite band.
The walkthrough also includes a breakout example, showing how traders may watch for a shift in the channel direction together with price breaking above a prior high.
📍 Timecodes
00:09 – Introduction: what are Polynomial Regression Channels (PRC)
02:00 – Where to find the PRC in cTrader and how to customise its settings
02:27 – Using the PRC to identify bullish, bearish and ranging market conditions
03:07 – Spotting overbought and oversold conditions with the PRC
03:56 – Using the PRC to analyse pullbacks in trending markets
04:30 – Reviewing a breakout example with the PRC
- Learn more about the Polynomial Regression Channels - https://t.co/74uZpDlvQI
- Join Discord - https://t.co/N23Rt86kcx
Don’t forget to like and share your thoughts in the comments!
_____________________________________
👉 Start Trading with cTrader - https://t.co/chQIER1Ve3 👈
cTrader: How the forex and gold trading platform protects you from scam
Built on the Traders First™ principle, cTrader sets trusted, reputable brokers and prop firms apart from scammers. This video explains 10 ways cTrader protects traders from manipulative practices and promotes fair, transparent trading.
👉 Start safe trading with cTrader - https://t.co/chQIER1Ve3