$10M Raised Public Testnet is LIVE
This could be one of the easiest early testnets to add to your wallet history... and it only takes 2-3 minutes
🪂 @Stripchain Testnet
>>How to Participate
🔗https://t.co/J9pS3gYQmR
~ Connect your EVM wallet
~ Claim Testnet Tokens
Inside the dashboard, copy your testnet wallet addresses for:
• Bitcoin (Testnet)
• Ethereum (Sepolia)
• Solana (Devnet)
• Sui (Testnet)
Then claim free testnet tokens from the available faucets
~ Start Testing
• Click Mint Synthetic Assets
• Bridge/mint assets from BTC, ETH, SOL, or SUI into StripChain
• Once completed, convert the assets back again
• Repeat with different supported chains to generate more testnet activity
⚠️ Only use testnet tokens. Never send real mainnet assets
If StripChain launches an incentive program or future airdrop, early testnet users could have an advantage
I'm already testing it. Are you?
#StripChain #Testnet #Airdrop #Crypto #Web3
$SOL, just like the last two cycles, it's likely leading the way for the majors again.
$SOLBTC looks to be printing a bottom right here at the OTE zone, while $SOLETH is following through on the May plan and breaking out of its base.
The weekly EMA 12/25 on SOLETH is about to golden cross, likely next week.
For context: the last golden cross was Oct 2023, and the most recent death cross was Jan 2025. This would be the first flip back since.
When SOL starts leading, it usually means one thing: liquidity is quietly coming back.
This is the most honest article on prop firms I have written. No fairy tales. No "get funded in 5 days" nonsense. Just what works, when to wait, and how to size.
Pop
https://t.co/1n5ADYPvjz
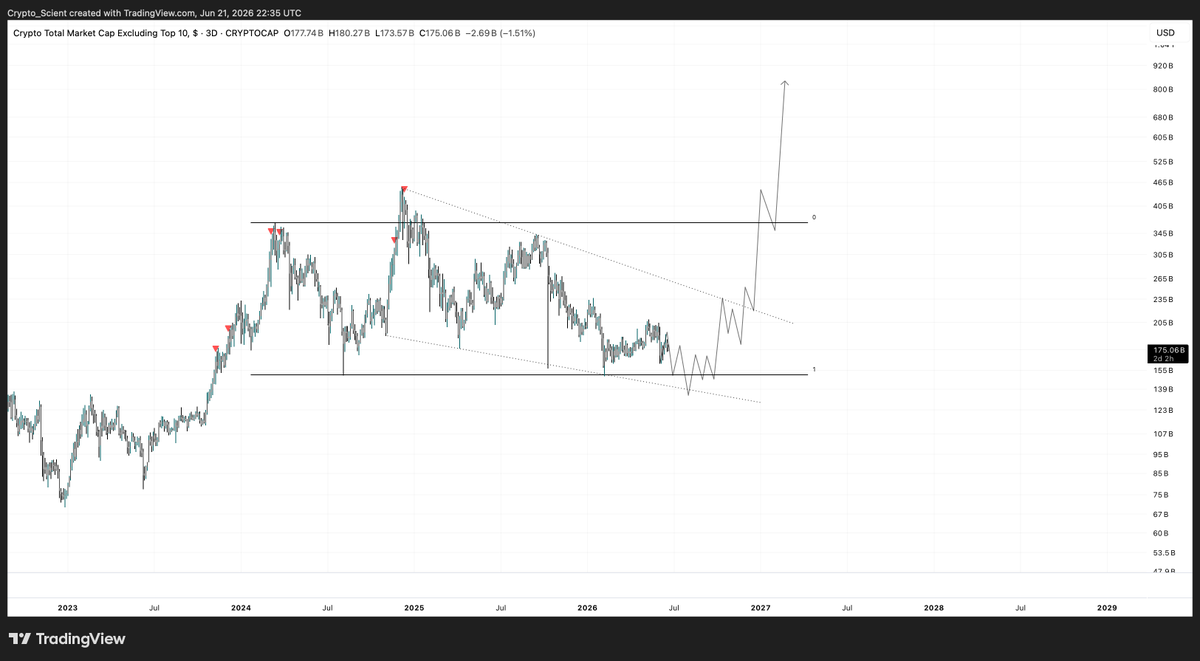
My macro view on #Altcoins
This is a multi-year reaccumulation forming inside this falling structure imo.
We're sitting near the lows. I think we get one more capitulation flush toward the bottom of the channel, the kind that makes everyone give up on alts completely……and that's the low it sends from.
Reclaim that level, break the structure, and this whole thing expands hard. The asymmetry down here is exactly what you want — everyone hates alts at the bottom, which is the point.
Also, Don't take the path timeline seariously. I Will be looking for a three drives pattern or some sort of deviation at the RLs to confirm the bottom.
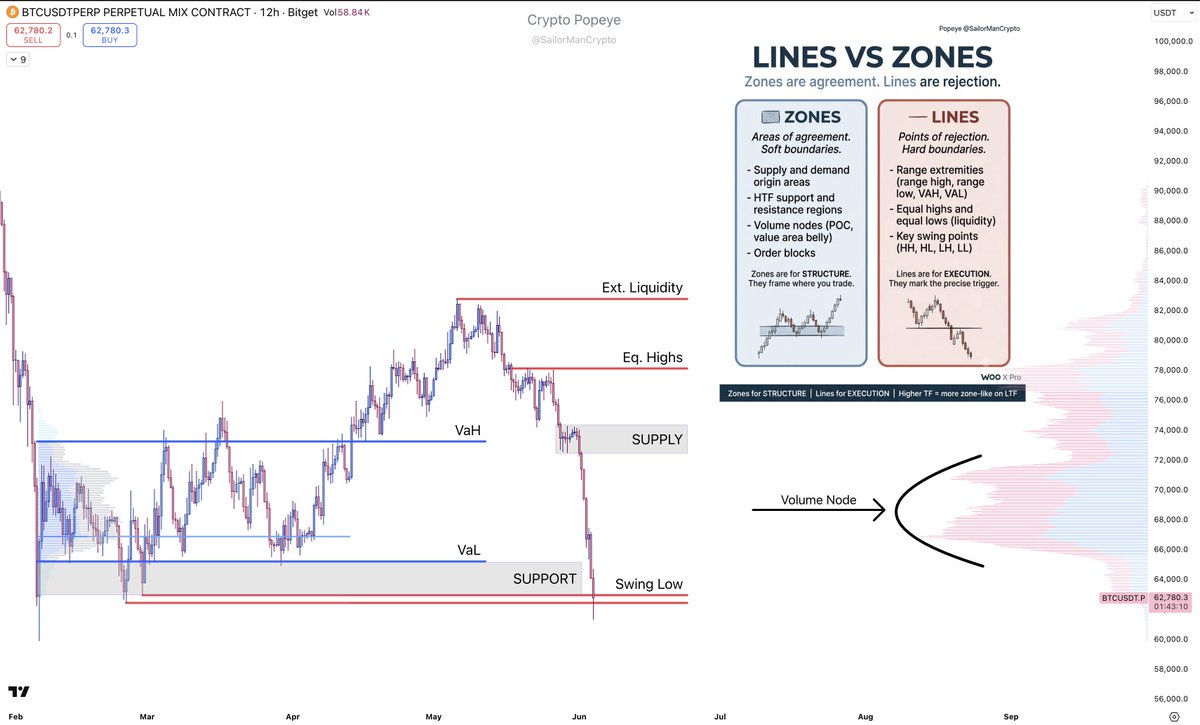
When to Mark Lines and When to Mark Zones - Cheat Sheet
This post is sponsored by WOO X Pro. Trade with zero fees on spot: https://t.co/iWxTrgYsA3
Most traders mark price levels the same way no matter what they're looking at. That is why their charts look messy and their reads are inconsistent.
The fix is simple: zones and lines do different jobs.
𝗭𝗼𝗻𝗲𝘀 𝗮𝗿𝗲 𝗮𝗴𝗿𝗲𝗲𝗺𝗲𝗻𝘁. Where the market camped, accepted, traded back and forth. Soft boundaries. Mark a zone when you see:
- Supply and demand origin areas
- Support and resistance regions, especially HTF
- Volume nodes (POC, value area belly)
- Order blocks
𝗟𝗶𝗻𝗲𝘀 𝗮𝗿𝗲 𝗿𝗲𝗷𝗲𝗰𝘁𝗶𝗼𝗻. Where the market sharply turned. Hard boundaries. Mark a line when you see:
- Range extremities (range high, range low, VAH, VAL)
- Equal highs and equal lows (liquidity)
- Key swing points (HH, HL, LH, LL)
𝗛𝗼𝘄 𝘁𝗵𝗲𝘆 𝘄𝗼𝗿𝗸 𝘁𝗼𝗴𝗲𝘁𝗵𝗲𝗿:
Zones are for STRUCTURE. They tell you where you would want to trade.
Lines are for EXECUTION. They tell you the precise level for entry, stop, and target.
You do not pick one or the other. You map zones first to frame the picture. Then you mark lines inside or at those zones for the trigger.
𝗧𝗶𝗺𝗲𝗳𝗿𝗮𝗺𝗲 𝗻𝘂𝗮𝗻𝗰𝗲:
The same level can be a line on HTF and a zone on LTF. A swing high looks like a clean line on the 4-hour but reveals itself as a zone on the 5-minute because the wick takes multiple candles to form. Same with VAH and VAL.
Rule of thumb: the higher the timeframe you derived the level from, the more zone-like it behaves when you drop down.
𝗖𝗼𝗺𝗺𝗼𝗻 𝗺𝗶𝘀𝘁𝗮𝗸𝗲𝘀:
- Drawing a supply zone as a single line. You will get wicked through every time.
- Marking equal highs as a zone. You lose the liquidity precision.
- Treating an HTF S/R level as a sharp line on LTF execution. Use it as a zone and let price work inside it.
- Using lines where zones belong and vice versa. The whole framework starts with knowing which is which.
Levels are not all equal. Some are areas of agreement. Some are points of rejection. Treat them differently and your reads get cleaner overnight.
Popeye
WOO X Pro, zero fees on spot: https://t.co/iWxTrgYsA3
Hot narratives attracting liquidity and giving clean setups with working levels right now.
In descending order based on the quality of the setups.
AI: $FET, $WLD, $NEAR, $TAO, $VIRTUAL
Compute power enabling AI: $RENDER, $AKT, $GRASS, $EIGEN
Privacy — $ZEC, $XMR, $DASH
RWA — $ONDO, $INJ, $HBAR
Stablecoin tokens — $XPL, $SKY, $ENA
These are the sectors where price is actually respecting structure. Some reasonable liquidity is there worth trading.
Couple ppl in the comments got close to guessing, but the exact odds are less important than the methodology for deriving them.
Let’s dive in
If the price of ETH today is $2300, then the maximum odds that a contract for “Will ETH hit $4600 in 2026” can rationally be is 50%
Why?
Because the EV of holding the underlying asset until it hits the contract’s strike price, can never exceed the payout of the prediction market.
So if the expected value of simply holding ETH until it hits $4600 is a 100% return, then regardless of when the contract expires, it will would be irrational for the payout from the contract to be less than that in percentage terms.
If the prediction market odds are $0.50, the potential payout from this bet would be a 100% return.
But no rational trader would ever buy the contract at those odds because they could simply hold ETH, and receive the same payout if it does reach $4600, without the expiry risk.
The prediction market can expire worthless, but the underlying asset retains some value no matter what. ETH may even be worth more than it is today at the end of 2026, yet the prediction market will still expire worthless if it’s not above $4600.
If the contract for ETH hitting $4600 in 2026 ever trades at say 51c, you could simply buy ETH, borrow against it, and then buy an equal $ value of shares in NO, and capture a guaranteed return.
It’s a free arb.
So now that we understand the maximum bound for a binary option’s odds, what is its true value?
If the contract is trading at 30% or 30c, instead of taking the odds at face value, we should compare its payout to the EV of the underlying trade.
While ETH is at $2300, we know that the odds are capped at 50%, so a logical way to interpret the true odds is to look at what the plain odds are relative to the cap.
- $0.30 plain odds
- $0.50 max value
- the odds are priced at 60% of their max value
Basically one could argue that the market is pricing the true odds of “ETH hitting $4600 in 2026” at closer to 60% !!!
You can run this experiment yourselves, I bet you won’t find a single prediction market where the payout of from the contract is less than the EV of the underlying trade.
If the EV of the underlying trade is a 10x, then the odds for a contract on the asset hitting that strike price are capped at 10%. And the true odds are closer to what ever the contract payout is in percentage terms relative to that cap.
The most intuitive way to view this is from a sentiment perspective.
The closer the payout of the prediction market is to the EV of the trade, the more bullish the market is on the event actually happening, and vice versa.
So why does all this matter?
Because it can improve your trading judgement.
Next time you see a headline claiming the chances “Bitcoin hits $200,000 in 2026” are 15%, you’ll know how to interpret the odds a lot better!
PREDICTION MARKET RESEARCH JUST GOT KILLED BY ONE .MD FILE.
The .md file in the video plugs any AI agent into 1,800 live data sources -> Polymarket orderbooks, satellite imagery, vessel tracking, NOAA weather, SEC filings, sports lines, and the top 100 KOL wallets.
It's @preftrade.
No APIs, no scraping, no signup and no card.
An agent with this installed doesn't ask "What's the price".
It pulls the orderbook depth on Polymarket, cross-references vessel positions in the Strait of Hormuz, scans the latest SEC filings on the names mentioned, and watches what the top 100 KOL wallets did in the last 4 hours.
Before it makes a single call.
The numbers are insane:
> $0 in API fees.
> $0 in data subscriptions.
> 670+ capabilities behind a single endpoint.
Every datapoint with full provenance back to the source.
The mechanism is wild too: It's called Preference.
An MCP server that gives any AI agent structured access to prediction markets -> Polymarket, Kalshi, Hyperliquid, dFlow AND the real-world signals that price them.
Your agent asks one question, gets the full picture before it acts.
It goes way past Polymarket: Smart-money mirroring on the top 100 wallets in real time.
Cross-venue arb scanners and event-driven agents that watch tanker traffic in the Strait of Hormuz and trade oil-linked markets.
Backtesting pipelines over historical data plus the world signals that moved each market.
The model was never the bottleneck. The data was.
One agent, one .md file and Live world data on tap.
-> https://t.co/ljPv4Et7sr
Retail still has 12 CoinGecko tabs open.
Agents already have the orderbook.
Full info and guide at https://t.co/jwRPxReFrs.
Don't forget to save.
Only a few Altcoins have;
- Good EMA structure
- Above Y/O
- Constructive PA
Expecting slow summer with chop/down (depending on macro/ $ES) but a few outperformers that put in good structures earlier than others.
Introducing the unified TypeScript and Python SDKs, now in beta.
One consistent surface for Polymarket discovery, market data, trading, account data, and realtime streams.
Python ships with both async and sync clients, so you can choose the model that fits your app.
Docs: https://t.co/nVPUGgnTUV
Coming soon: unified API, Rust SDK, and React SDK.
Our goal is to build the best developer tooling for Polymarket integrations.
Feedback welcome: drop it in the discord dev channel, reply here, or DM me.
bitcoin:native
"Weekly Analysis"
The weekly trend remains bearish as long as the weekly 12/25 EMAs are capping price. This should not be a surprise as I have been extremely vocal about treating this range as re-distribution.
There are also similar confluences to the 28th of March 2022 fractal where price traded above the weekly bands while the weekly stochastic RSI was overbought and the RSI was retesting the mid-level.
But the most important part of this comparison is the fact that in both scenarios the context is bearish.
"Daily Analysis"
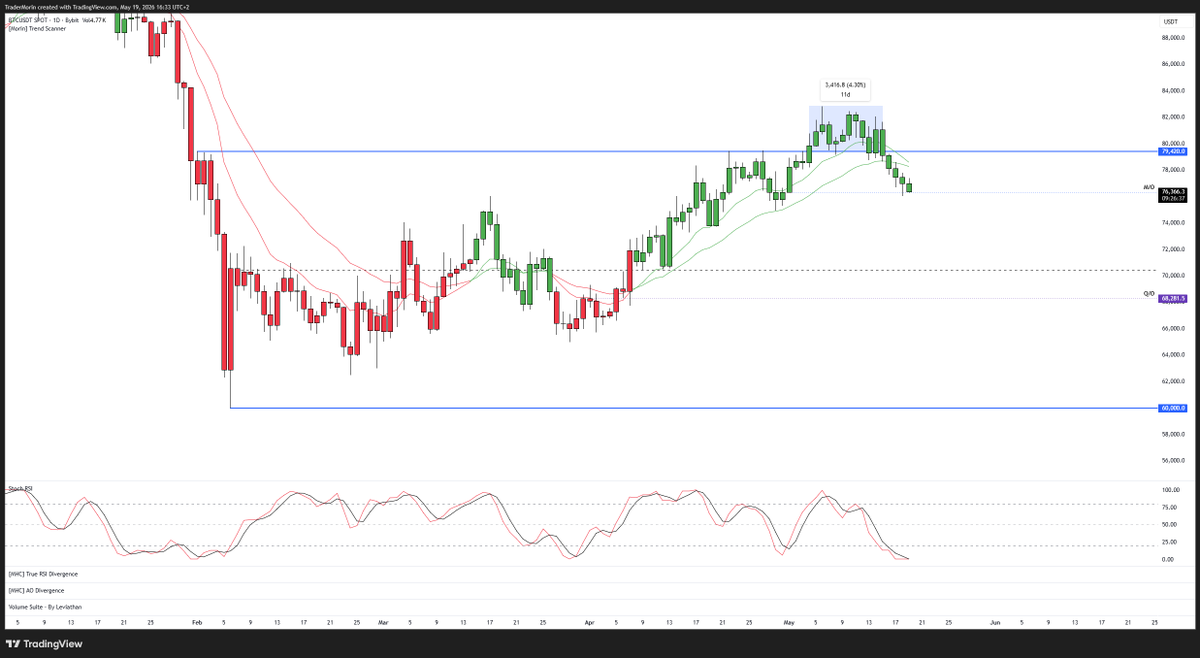
After spending 11 Days above the range high without any real follow through to the upside, we have accepted back into the range thus confirming the deviation.
Price is also below the Daily 12/25 EMAs, what I want to see next is the bands cross bearish and secondly is for the bands to act as resistance on the way down. Similar to the end of January 2026.
Daily Stochastic is oversold, most would assume price is due a bounce but then most don't understand that you must adjust how you use some indicators according to the market context.
We are in a HTF downtrend, and we just accepted back into the range after a failed breakout. The daily stochastic RSI is very likely to remain oversold as price continues to trade lower.
"4H Analysis"
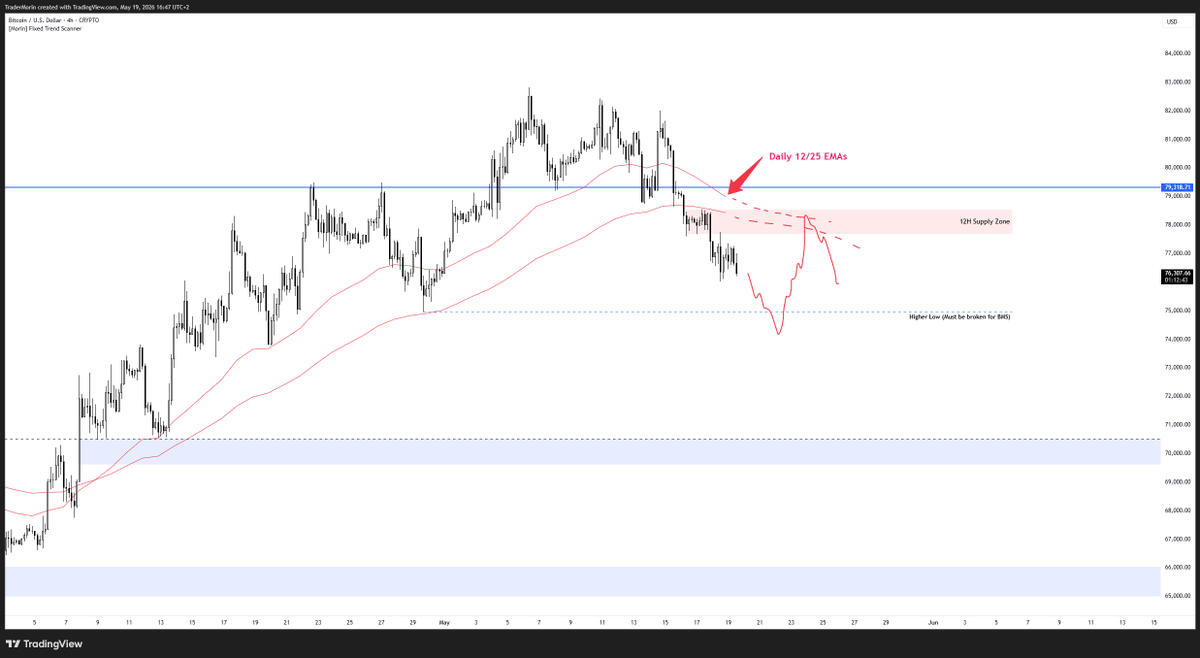
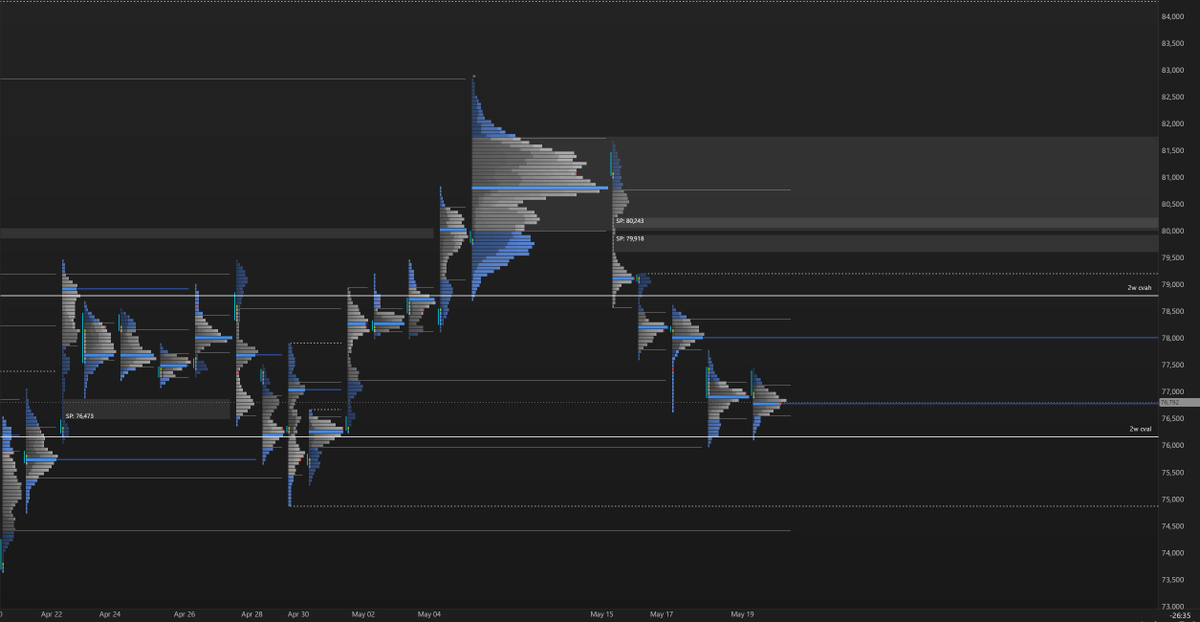
There is a H12 supply zone around 78k which is where I will be looking for possible mean reversion setups if we trade back into that region.
You probably have also noticed how I have market out where the daily 12/25 EMAs are and that is because they can provide a secondary form of confluence for the trade setup.
At 75k is where we had the final Higher low so ideally, I want to see that level broken to confirm the shift in market structure (This just gives me more confidence to hold the short).
Main target for my swing short is 66k as that is where I believe we are likely to see a relief bounce. There is a level prior that I will be observing which is 70k, this is also where I will look to close the mean reversion trade.
If you found value from this breakdown then I would appreciate any Likes / Comments / Retweets! 🫶