You see there is only one constant. One universal. It is the only real truth: Causality. Action, reaction. Cause and effect. BTC owner since 2013. Zoom out.
We all want to be masters of the 1 minute chart. CT thrives on posting daily trading. But I dont say it enough: Zoom Out! The goal here is to survive. Trade the MONTHLY chart. Buy below 50 RSI, sell at 95 RSI. Retire on the beach. If all goes well, you are here:
June home builder sentiment and survey results are in. Top themes: 1) A lot more new home buyers cancelling. 2) Price cuts becoming fairly common. 3) Drop in demand finally cooling construction cost pressures (builder layoffs also happening). Market commentary to follow…
Whether they were novices or old hands, buyers all chased the same models:
⌚️Rolex Daytona
⌚️Patek Philippe Nautilus
⌚️A Audemars Piguet Royal Oak
By March, the holy trinity of the most hyped watches was trading for many multiples of their retail prices https://t.co/Ejak7PsFia
KPMG predicts that used car prices can drop 30% as more supplies hit the market and Ally Financial predicts a 20% drop.
The timing is a bit uncertain but it looks like it's going to unravel in the next 12-18 months.
The crypto industry is desperate to hire.
There is, however, a shortage of talent. Do you have what it takes?
Read more from #FutureofWorkWeek, presented by @Nexo: https://t.co/GjPDXPjl5y
I believe that there is a massive short opportunity for $ETH at ~$1200 over the next 2 months.
We still have not seen real capitulation yet and July / August are lining up to be potentially the worst months.
Here is how I am thinking about things 🧵
Crypto winter is here ❄️. I was on the @Coinbase board until 2021 and led its Series D for @IVP. I’ve lived crypto cycles since 2013. Here are my predictions on how and when this crypto winter will end, and how to emerge stronger. 🧵👇/1
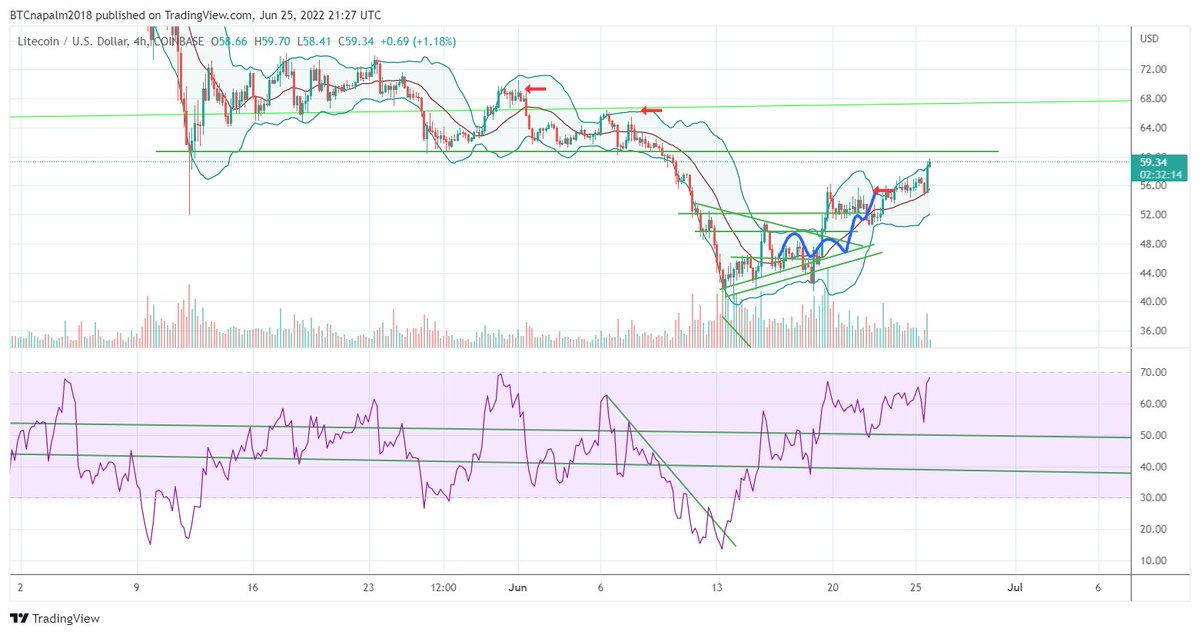
You dont have to ask twice @alisun0302 Here is the 4hr $LTC update chart you've been waiting for. 🙃😆Nailed the overbought resistance failure. Now lets see if $52 holds in the channel.
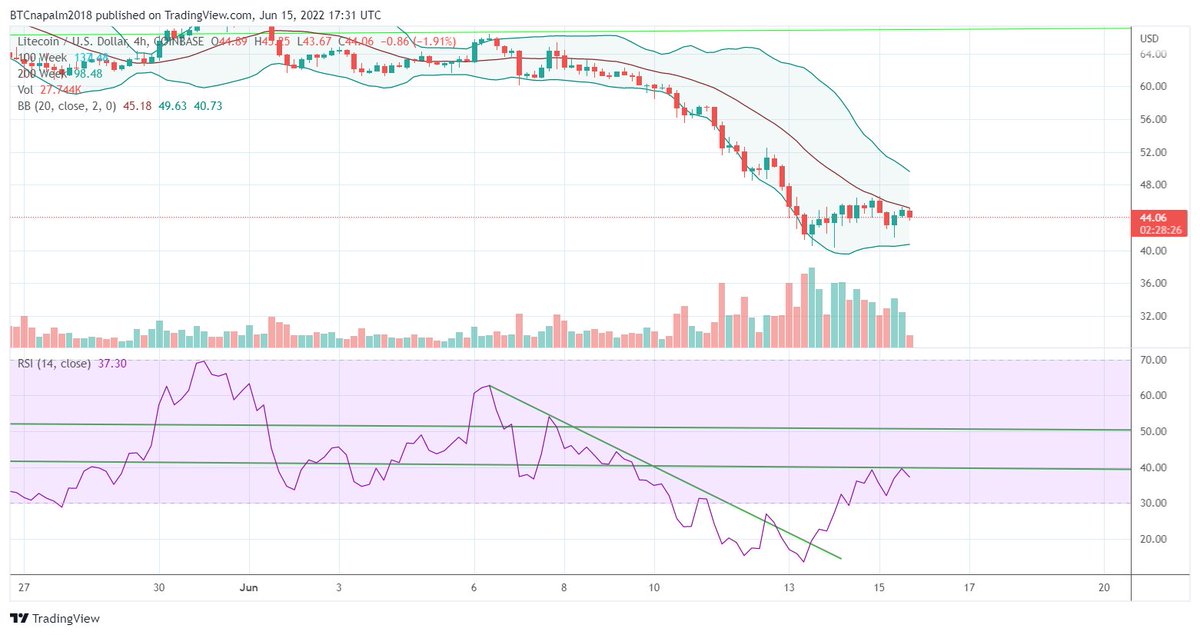
$LTC 1day: This chart clearly shows that the MA needs to be reclaimed to show a momentum change. Every touch since loosing $120 has been rejected. BUT notice this is the most tests since. If it falls & $50 holds, expect $60 LTC next.
If you are trading the 1d $LTC chart instead of the 4hr, This is a technical breakout and dips are for buying. (id like to see a couple candle closes to confirm its not a fakeout) It should test the upper BB at $65