🚨 The time has come! 🚨
This is THE zone to go FULLY IN for the next parabolic leg — straight into the Yellow Rainbow Zone 🔥
$200,000 Bitcoin in the next 2 years is inevitable. 💎🙌
Even if we miss the upper red band, the Yellow target is the highest-probability move by far.
The setup is crystal clear. Time to load up — RIGHT NOW! ⏰
Chart: Bitcoin Rainbow Projection by @LeoMathHeart
Elon Musk: "A lot of people would say, can solar energy really provide the energy that we need? A lot of people don't perhaps appreciate that solar energy is already the source of the vast majority of Earth's energy.
Without solar power, we would be a frozen ice ball at about 3 or 4 degrees above absolute zero.
So really, all we're talking about for solar electricity is taking the tiny, tiny bit of energy that humanity needs for electricity, which I emphasize is super tiny compared to the amount of solar energy that hits the Earth,
You could generate all the electricity that the United States needs with about a 100 mile by 100 mile grid of solar power. So you just take like a corner of Arizona, and that would be all the energy that the United States needs."
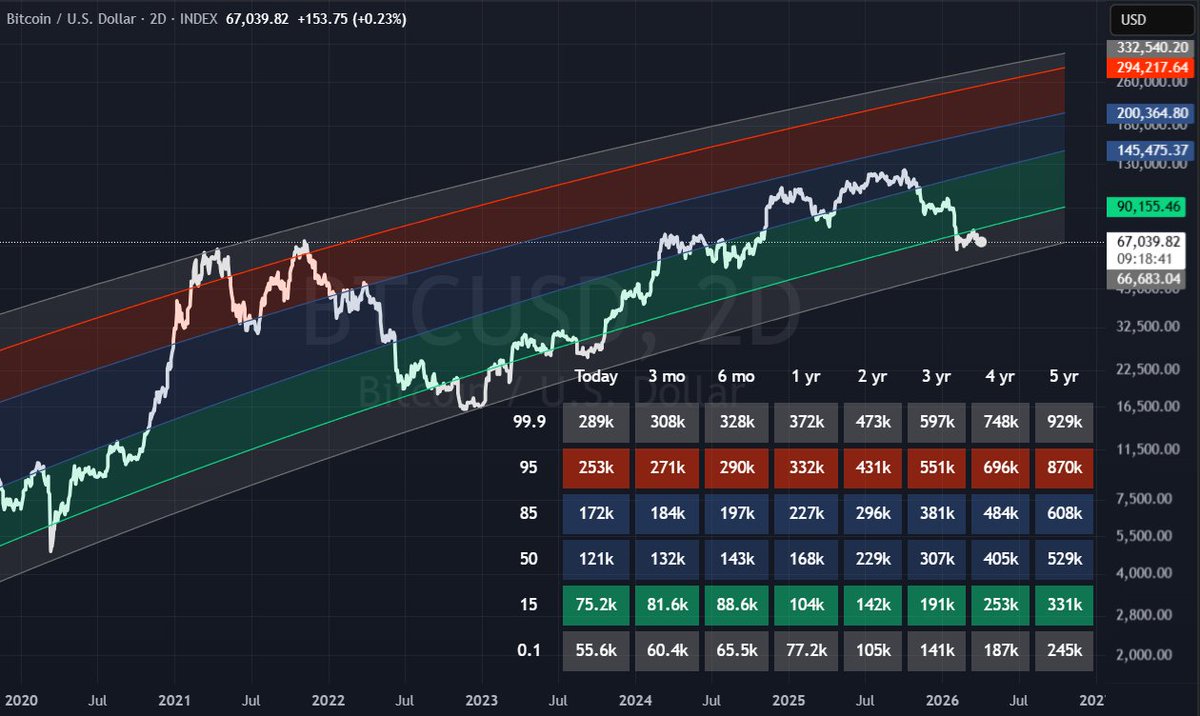
And here's your out-of-sample validation on Bitcoin Power Law graph extended to 2035:
- By 2030 the central trend sits in the $400K–$600K range.
- By 2035 it reaches the $1M+ zone.
PS: Using same power law with real daily market data via the Polygon API and strict year-end closing prices (i.e., resampled but essentially the same).
Using out-of-sample validation on the Bitcoin Power Law dramatically increases trust in its predictive power.
I fitted the model only on data up to 2018, then tested it on the completely unseen 2018–2026 period. The power law still predicts the long-term trajectory with shocking accuracy. This isn’t curve-fitting. It’s real predictive validity. The Bitcoin Power Law just passes one of the toughest tests in quantitative finance.
Most models collapse outside their training window.
The Power Law doesn’t. That’s why you should pay attention.
The model, trained on early Bitcoin history, continues to track the long-term trajectory remarkably well through the bull and bear cycles, even as prices hit new all-time highs.
Blue dots: Actual Bitcoin price (approximate yearly levels).
Red line: Power law model fitted only on data up to 2018.
Dashed line: Training cutoff - everything to the right is pure out-of-sample prediction.
🚨 In the early 2000s, a 1-hour MIT lecture quietly revealed more about quantitative trading than most people learn in an entire Wall Street career.
Most people will skip it.
It comes from Jim Simons the “Quant King” and instead of hype, he breaks down how real edge is built.
Watching it changes how you think about markets.
He shows that trading isn’t about predictions it’s about probabilities. The best strategies don’t try to be right every time, they focus on being consistently right over time. Small edges, repeated at scale, beat big guesses.
He also makes it clear that data means nothing without structure. Anyone can collect data very few can turn it into signals. The real advantage comes from models, discipline, and removing emotion from decisions.
And the biggest shift? Thinking like a system, not a trader. The winners aren’t reacting to the market they’re building machines that do.
That’s why this MIT lecture is worth your time.
Bookmark it. Watch it no matter what.
It might be the most productive hour you give your week.
$BTC Never wrong (super rare actually). This is all you need to outperform everyone. And I update it once a week here for free. 🙏
This macd indicator signaled HTF trend flips only 12 times in 5 years!
We are SO near a flip. I'd estimate this bear market only has 35-60 days left to it. One last big dip should make the bottom. Remember, HTF is the big money.
This chart has perfectly predicted the current Bull Trap to $72K.
We’re exactly halfway through the bear cycle, and $BTC will dump to ~$41,000 in May.
Bookmark this chart and check back in 6 weeks.
3 things happen at the end of bear markets.
1) price cleanly breaks the cost basis of recent investors (circles).
2) idle smoking of hopium gives way to rabid clicking of the BUY button chasing the price
3) this raises the cost basis (red line transitions to green)
Bitcoin still isn’t as low as previous bear markets.
Even though Bitcoin has been in the lowest zone of the power law for two months now, it’s still not as deep as in prior bear markets.
Price would have to drop around 15% to match previous bear markets.
Bitcoin’s Floor is the Real Story.
Using a more conservative 5.8 floor exponent, and anchoring today’s floor at $65,971, the floor still rises to:
$91.5K in 1 year
$167K in 3 years
$289K in 5 years
$936K in 10 years
The floor reaches $1M around July 2036.
It is about 38.6% over the next year.
The long-run CAGR from $65,971 to $1M over that path is about 30.2%/yr.
Everyone watches the price.
Almost no one watches the level Bitcoin refuses to stay below for long.
It is time compounding underneath the asset.
Bitcoin continues to hold on to the $65-$70k range as it is trying to form a base following its mild winter from $126k to $60k. The current level is supported by the technicals (previous highs) as well as the Bitcoin/gold ratio and the deviation of Bitcoin from its power law curve.