- HTF VSA analsyis (chilling in the meantime) -
I'm gonna show you something very interesting that you can use for your analysis as well, trying to capitalize independently if you have a more passive or aggressive method.
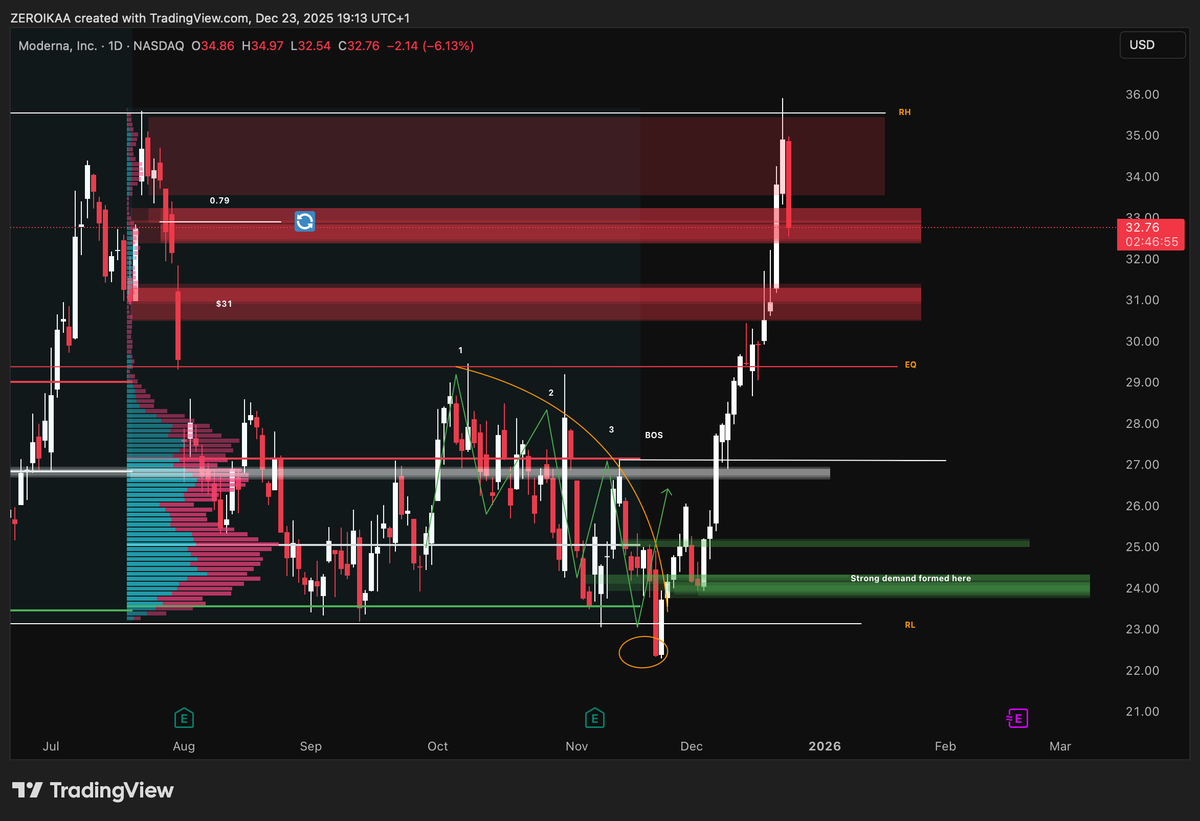
In here you can see the chart of MRNA that I shared in my channel on the 9th of October (first suggestion to look into it was in May).
Now my approach here was super simple.
I was not trying to predict a short-term move or chase momentum, what I was focused on was where price was sitting within the HTF range and what the volume was telling me about intent.
From that perspective, price was clearly trading deep in a HTF discount where risk asymmetry began to favor buyers rather than sellers.
What immediately stood out to me was the behavior of volume relative to price.
As price continued to trade sideways to slightly lower, volume consistently expanded without producing meaningful downside continuation.
That lack of efficiency was critical.
If sellers were in control, increased volume should have translated into a clean expansion lower, but Instead, each push down was met with absorption and that was a classic sign that supply was being absorbed rather than distributed.
❗️In market mechanics, high volume at extremes must always be interpreted in context:
- At premium levels, it often signals distribution.
- At deep discounts, it more commonly reflects accumulation
I was not expecting an immediate breakout because accumulation rarely/never looks impulsive..it is typically slow and frustrating because is designed to exhaust participants before any expansion occurs.
The longer price builds acceptance in this zone, the more meaningful any eventual displacement becomes. (save this for later)
Now the analysis between tick volumes and price was one factor, but also the correlation with the VP in range was key.
A large portion of traded volume was building below EQ, creating a developing high-volume node in the discount area.
When price spends time and transacts heavily in a zone, it indicates agreement between buyers and sellers, which is a necessary condition for accumulation.
Now if you pay attention, a lot of supplies were mitigated between EQ and RL (notice 1-2-3) and for that reason, since accumulation was heavy and prolonged, the displacement formed has been violent.
No pullback has been provided because each internal supply was mitigated and above each high shorts were positioned and squeezed, generating more fuel and contributing to the violence of the impulse.
Result? +50% in 2 weeks, deleting months of sideways and boring price action.
This is why you need to learn how to use VSA together with VP to form a thesis.
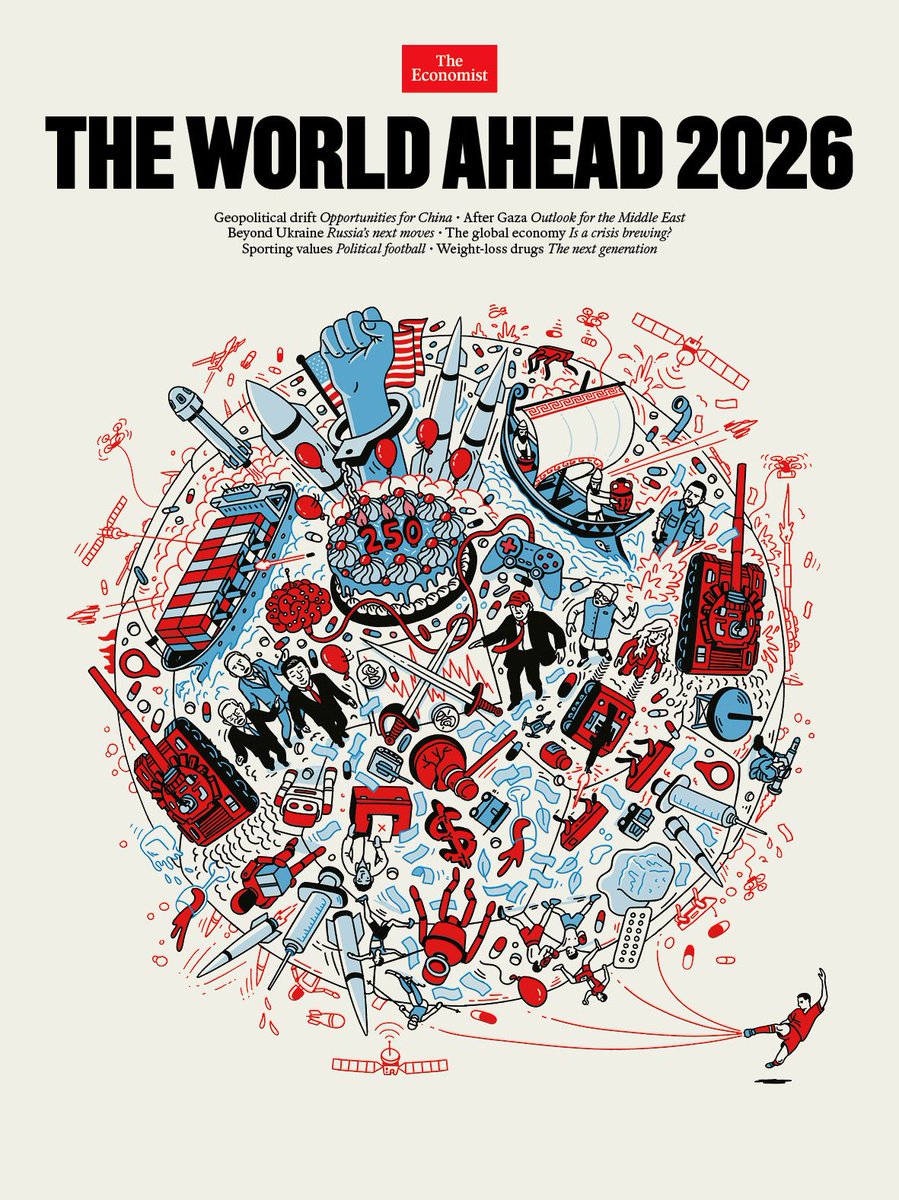
👁️ The World Ahead 2026 👁️
I want to offer you my personal intepretation of the last cover of "The Economist" which has raised a lot of questions, so I will try to do my best in order to decipher it with an eye on financial markets. (long post but well worth it in my opinion)
- Main thesis -
The central thesis of my interpretation is that the cover of The World Ahead 2026 depicts a world being structured to function under permanent instability.
War, economic stress, technological disruption, health intervention, cultural conflict..everything is part of an interdependent mechanism of a single system where instability is the operating condition through which power is exercised and maintained.
This is why the illustration is so crowded.
If you think about, nothing exists on isolation, right?
♻️Military conflict bleeds into economics, economics into health, health into technology, technology into culture, and culture back into politics.
The absence of clear boundaries is not a "mistake of the author" but its a message: separation itself has ended.
The thesis, therefore, is not that chaos is imminent, but that chaos has been domesticated making it more predictable, governable, and in some cases (most of them) economically productive.
Just look around you..the system adapts populations to volatility through continuous intervention: policy, media, medicine, and technology.
"What?"
Well:
- Conflicts are contained rather than concluded
- Economic stress is offset rather than eliminated
- Social tension is redirected rather than reconciled
What we can extract, therefore?
That seen through this lens, the cover functions as a declaration of a "new normal", communicating to its intended audience that the future will not be defined by grand solutions but by adjustments and control within limits.
The task of power in 2026 is not to restore order, but to operate effectively inside disorder so everything that appears on the cover, from missiles to medicines, from financial symbols to cultural icons serves this single idea, in my opinion.
- Element by element -
1. Globe as a soccer ball ⚽️
As we can see the world is drawn like a soccer ball and this is a clear metaphor tied to the 2026 FIFA World Cup that will be co‑hosted by the U.S., Canada, and Mexico making sport a global stage for "soft power" and identity.
Now what I'm thinking is that the iconic figure of Ronaldo kicking the ball may be interpreted less as an athlete and more as an emblem of institutional power, demonstrating how deliberate interventions can set a globally interconnected system in motion, exactly as he does with the ball, bringing volatility on the table.
Start date: 11th June 2026
End date: 19th July 2026
I would keep an eye on the start.
2. U.S. flag behind a large birthday cake 🇺🇸
This is a clean reference to the U.S. 250th anniversary in 2026 that should put America at the heart of global history.
However in here we have an important factor to pay attention at, which is the juxtaposition of celebration and crisis as the cake is surrounded by "doom" elements like missiles, war ships etc meaning, in my humble opinion, that the country may not be immune to global shocks.
3. Raised fist + broken gavel ✊
With the U.S. flag slightly behind, this likely means societal tension, possibly unrest and friction between authority and civil populations (BLV docet) where the cracked gavel denotes weakened institutions.
As an implication, political legitimacy and justice systems will be under strain with implications for policy consistency and economic confidence.
4. Missiles across the sky + tanks on globe 🪖
These are straightforward references to military conflict and armament escalation both ongoing and potentially emerging.
Tanks and missiles together imply multi‑domain warfare (land and strategic weapons) showing conflict as a pervasive backdrop of world affairs, not isolated crises. (remember what we were saying in the beginning?)
Conflict becomes background noise rather than a singular shock.
From an investment standpoint, this favors sectors tied to defense, energy security, logistics, and commodities.
5. Red/blue code 🔴📘
Something that people may not notice is the intended colors to represent the drawing.
Red is a color used to express danger and tension and in this context could be interpreted as a conflicts between countries and therefore, strong volatility.
Blue instead, flags authority or governance and based on my belief, it can signal the forced introduction of a new technology to gain control. (CBCDs?)
Essentially, competing forces, so think of it like a chessboard where red pieces create pressure or threats, and blue pieces try to contain or manage that pressure.
6. Syringes/pills 💉💊
In here we have oversyzed syringes and scattered pills dispersed around so this should represent:
- The rise of biotech, drugs, defensive stocks
- Potential pandemics/flu
- Potential vaccination campaigns, innovations etc
Medicine/healthcare should be a primary narrative.
7. Brain plugged into a gaming controller 🧠🎮
To me this is a clear reference to AI (human integration) and possible digital control.
It shows that attention, perception, and decision-making are increasingly engineered within interconnected systems so control over information and behavior becomes a core domain of power, with, as you can imagine, direct implications for economics, governance, and social stability.
Deep fakes? Algos driving your interest?
It may be just the beginning.
It may be not stupid to consider as investment chips, cloud, cybersecurity, and platform providers..
8. Ancient style boat⛵️
A boat is by de-facto a symbol of movement, transition and exploration of the uncertainty.
Because the boat is anachronistic compared with the other elements, it likely isn’t meant to point to a specific 2026 event, but rather to hint that long‑standing historical currents, traditions, or ideas continue to influence modern dynamics.
If we assume that 2026 will be a year of changes and especially in a context of technological disruption, geopolitical tension, and volatility well..we have a +1.
9. Melting ice cubes 🧊
On the external part of the globe we can find melting ice cubes which are an ideological representation of climate change and overall enviornmental instability.
Alone is a reason to pay attention because climate change is widely recognized as a systemic risk to financial markets (supply chain, harvests, production costs) that may affect asset values across specific sectors.
It may also signal another reason to pay attention to "new solutions" in the agricultural landscape.
If this is the case, I would look into alternative agriculture, water, energy infrastructure, and climate adaptation..
10. Geopolitical tensions & financial markets ⚔️
The thing that jumps out immediately below the cake is a chart with swords crossing each others, likely mirroring the trade war between China and U.S.
The chart clearly appears chaotic, with peaks and troughs emphasized, creating a sense of volatility and tension..but the predominant color is red, and this alone is a powerful sign.
Red implies risk, pressure, or threat and it can be associated with loss, drawdowns and negative sentiment, aka economic impact.
11. 3 extras I noticed 🛰️ 💸🤖
- Satellites likely meaning global observation, surveillance, connectivity and space-defense
- Money printing that can flash bank interventions and stimulus as the dollar is "cracked"/broken currency indicating structural fragility in global currencies and overall economy
- Robots/dogs/drones that may be interpreted as automation and replacement of humans in the production chain/companies + further adoption of robots in our daily lives
--------------------------------------------------------
👁️Bottom line and considerations:
In reality, the cover of "The Economist" isn't an overall mistery to me and this simply because I had the perception of a potential very turbulent year explained here https://t.co/Och3W6SScg so it goes hand in hand with the thesis.
However, despite my expectations for an overall complicated year, I believe that at least the Q1 will be positive and this is not based on some details in the cover but is explained in my charts https://t.co/30DQbmSsxa and their liquidity dynamics, so before a potential collapse I see us performing well.
"Any other indication?"
Something that may be added is BTC seasonality/cycle.
If we consider:
- Top2top -> 1490 days (first cycle)
- Bottom2bottom -> 1430 days (first cycle)
- Top2top -> 1431 days (second cycle)
- Bottom2bottom -> 1431 days (second cycle)
Then, if this is the top (we may even get a new high but this doesn't change the overall idea) then our bottom should be in late 2026 and considering everything we stated above, well..we have a good recipe.
This post will updated step by step as we transition into the next year looking quarter by quarter to see what we have and how things are evolving.
If you like this post and find value in it, the like and repost buttons are just a few centimeters below.
Think rationally.
From a smart money perspective, pushing the altcoin market down makes sense unders so many aspects..strategically, psychologically, and dynamically.
First, consider sentiment as a resource.
Retail capital is not infinite, but more importantly, retail conviction is not infinite.
Smart money understand that price alone does not break participants, time and repetition do.
Repeated cycles of dumps followed by weak, unconvincing pumps are far more effective at exhausting market participants than a single large crash.
Each failed bounce reinforces learned helplessness.
Each rally that fades teaches people that “altseason is always cancelled.”
This is not accidental, It is conditioning.
For years, the dominant narrative has been: Bitcoin leads, then capital rotates into altcoins, then altseason follows, especially when Bitcoin is at or near ATH.
That narrative became widely accepted, overly anticipated, and heavily positioned for.
Once a narrative becomes consensus, it becomes exploitable.
When Bitcoin reached new highs and altcoins failed to outperform, then instead collapsed, it created maximum cognitive dissonance.
The market moved against expectations and that is far more damaging.
People did not merely lose money, they lost confidence in their framework for understanding the market, which is optimal.
If altcoins had rallied aggressively alongside Bitcoin, liquidity would have fragmented, volatility would have increased, and distribution would have been more difficult.
By suppressing altcoin performance, capital remains concentrated, narratives remain confused, and retail remains uncertain and reactive.
There is also a structural aspect.
Many altcoins are thinly traded relative to Bitcoin, heavily held by speculative participants, and reliant on sentiment rather than cash flows.
That makes them ideal instruments for sentiment manipulation.
You do not need to sell relentlessly, you only need to sell at the right moments..into hope, into relief, into expected breakouts. The goal is not immediate price collapse, but erosion of trust.
The repetitive pattern we saw (sharp dump, slow grind, weak pump, renewed dump) serves a specific function.
❗️IT CREATES EMOTIONAL FATIGUE❗️
People begin to exit not because they are forced out on margin, but because they are mentally done. They stop paying attention. They stop believing. They sell not at panic lows, but during boredom and frustration. That is the cheapest liquidity.
This environment also reshapes narratives retroactively.
Instead of “altseason is coming,” the dominant discourse becomes “alts are dead,” “only Bitcoin matters,” or “this cycle is different.”
Again, from a positioning standpoint, this is ideal. When the majority abandons an asset class psychologically, the risk-reward asymmetry quietly improves.
Importantly, this does not require coordination or conspiracy. Incentives alone produce this outcome. Large players benefit from lower volatility during accumulation phases, from narrative confusion, and from retail being positioned incorrectly for extended periods of time. Markets are adaptive systems, not moral ones.
Before major expansions, belief must be broken. Expectations must be inverted. Participants must be convinced that what they were waiting for will not happen.
That is why the current state of the altcoin market feels irrational only if you view it through a linear, price-only lens. Through a psychological and dynamical lens, it is entirely rational.
The market is not punishing people for being wrong on direction. It is punishing them for being early, crowded, and emotionally invested in a narrative that became too obvious.
Think rationally.
👁️This is yesterday BTC short execution on NYO. (+ considerations)
There are some very specific nuances especially on the nature/pattern of the moves.
Watch, enjoy and share if you think it's a valuable content.
✍️When the price of an asset moves into an HTF (or even MTF) supply, demand, or breaker, you need to understand the context before taking a decision.
The level itself only tells you where liquidity may sit but it does not tell you how participants are behaving around it.
This is why tools such as CVD, funding rates, and open interest become essential.
They reveal whether the move into the level is driven by genuine initiative, forced positioning, or merely a lack of liquidity.
In order to explain it better, I'm gonna use a recent example.
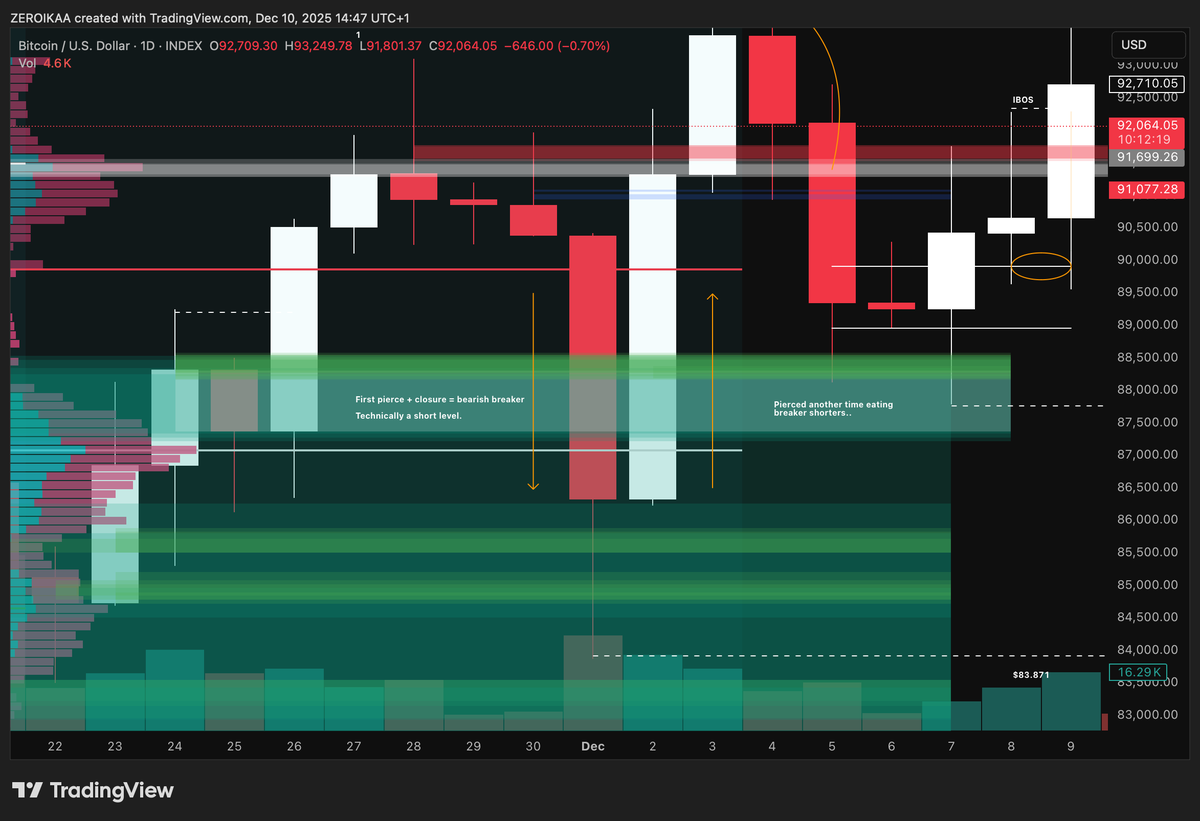
In this BTC chart posted above, you can clearly see that the price decided to pierce for the first time a previous demand closing below and therefore confirming the breaker formation.
Technically speaking, that was a level to short, right?
I already discussed about the importance of contexualizing levels in premium/discount here https://t.co/7FrjmrJZIy but if we look deeper and we observe the broader narrative building on external metrics, they suggested why it wasn't a proper level to take.
During the prior HTF move to the downside in fact, we had a strong reset in these metrics:
- Funding shifting from highly positive to healthier conditions
- Open interesting coming down as the majority of longs were closed
- Spot CVD selling heavily, true..but at HTF demand, signaling absorption rather than continuation
- Aggregated liquidations signaling a cluster of huge longs being flushed out
Were those metrics pointing out for shorting more (the breaker on isolation) or instead favoring longs?
This is one of the reasons why S/D/BB fail from time to time, because without market context they remain pure isolated levels.
Something to note down, study and share.
With the monthly close now behind us, it’s time to focus on some key considerations regarding the USDT D. and its potential impact on BTC market structure.
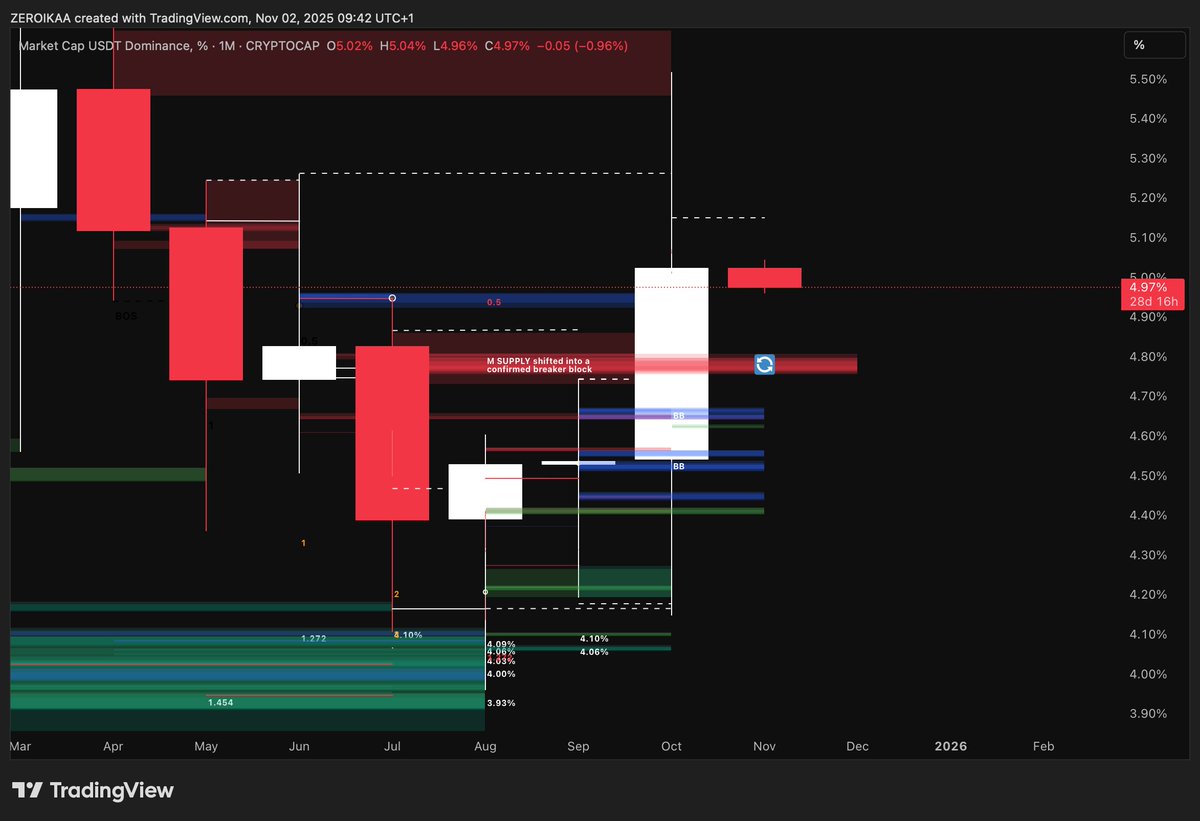
As previously highlighted, the 4.78% zone represented an important monthly supply level, a technical area that required close attention during the close.
The goal was to see a monthly close below this level to confirm a bullish continuation, but that did not occur, leading instead to the formation of a breaker block.
This means that the same area, which previously acted as a supply zone, now serves as a potential base for a technical bounce, and consequently, as a point of distribution for Bitcoin.
It is therefore essential to closely monitor the monthly reaction in this zone, because even though we already have confirmation of a structural shift, it’s not impossible for the current breaker to evolve into a double or even triple breaker.
These are rare occurrences, but not unheard of, as demonstrated by SOL weekly breaker shifted into a triple one.
Right now, we have BTC in a distributive phase and USDT.D in an accumulative phase, which makes such developments less likely but still possible.
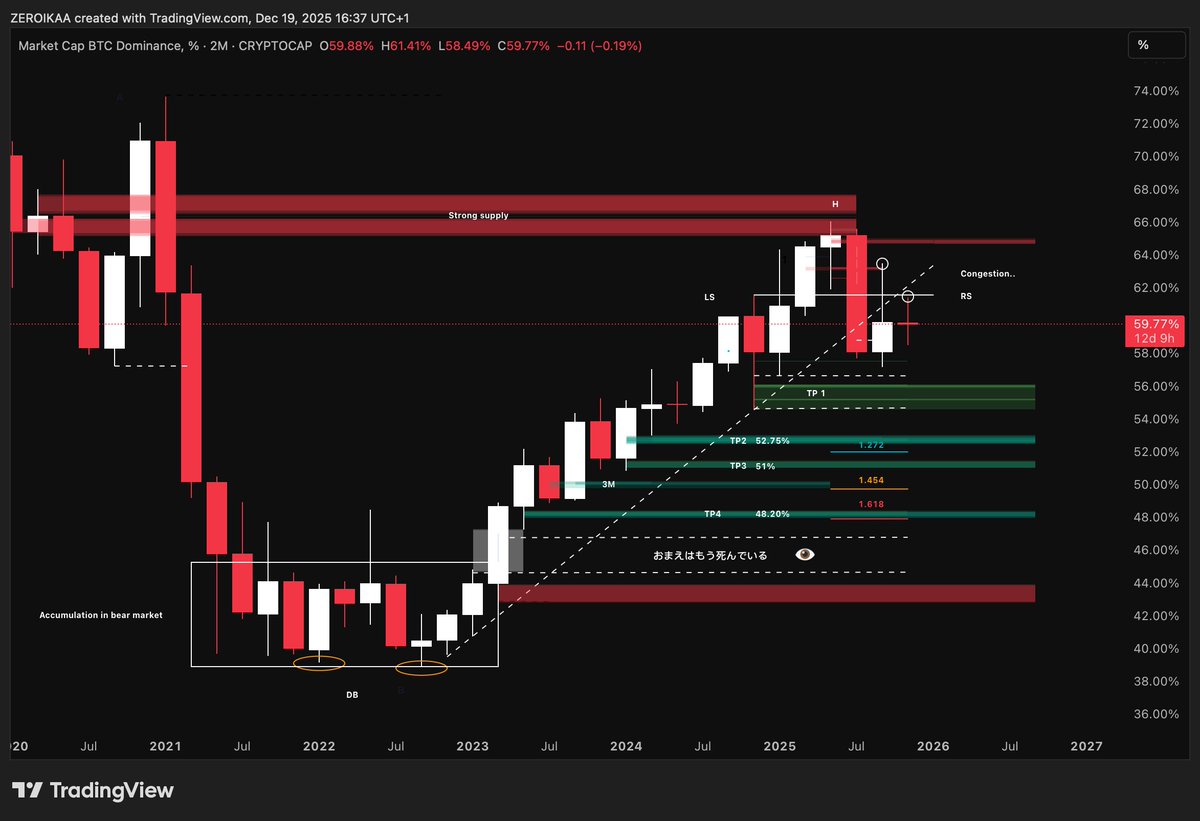
Regarding Bitcoin, we have discussed many times how, from a broader perspective, it remains in premium levels.
The potential bounce on USDT.D could therefore trigger a reaction in BTC, giving us valuable insight into the market’s true strength.
If that reaction proves weak, it may signal a deeper structural reversal and the confirmation of a bear market.
At the current stage, however, despite maintaining a bearish outlook on BTC, there is still no technical confirmation of a bear market, as no significant structural lows have yet been broken.
Given this context, my personal approach will be to consider a short position, as it makes sense from a technical standpoint.
Nevertheless, I’ll keep an open mind and remain flexible in case of a potential double breaker scenario, which would require reassessing my strategy as price action unfolds.
Announcement.
During the last 1.5 year, I worked incredibly hard to build something truly tangible to a space dominated by wolves disguised as sheep, always respecting my core values: transparency, kindness and, hopefully, humbleness.
I've written dozens of educational content publicly and I've built privately my channel, brick by brick, hour per hour with the only goal of helping people to succeed and this, considering the amazing results that I saw even from novice, has been achieved.
Knowing that I can impact for the good their lives is the biggest blessing and motivation I can be covered with.
Following my passion therefore, I'm proud to announce a new format to be released soon:
Tsukuyomi live sessions.
What it will be about?
Together with my partner @studentoffew we will host live sessions that will include:
- Market updates & considerations
- Trading sessions
- Q&A
This will likely (hopefully) boost the comprehension of many through the roof as it will also include some special bonus content that I will keep them as a secret for now.
"Will you raise the price therefore?"
No, I don't need to.
I'm doing well in life, I'm satisfied with what I'm making from investments and trading and asking for more would turn abundance into excess, gratitude into greed.
I'm doing all of this because I like to as it's my primary passion and I genuinely love to help "my" people.
I hope that you will appreciate this new format/product.
Thanks for your attention.
👁️Many people have asked me: 👁️
“Mate, what’s your strategy? How do you actually trade the market and which tips can you give me?"
Today, I want to share my approach with you and not just the mechanics, but the mindset, the discipline, and the long-term vision that are often overlooked. (I believe this can help you if you're struggling)
The truth is, trading isn’t just about techniques or spotting levels.
It’s about psychology, discipline, and clarity.
Life already pressures us with work, deadlines, family, and constant notifications.
Why should we turn trading into another source of anxiety?
Many people chase excitement in the market, seeking adrenaline, fear, or euphoria.
I seek the opposite, therefore calm, coherence, and simplicity as profit doesn’t come from tension, but it comes from staying still while the market moves around you.
My goal is to build a clear, repeatable, and sustainable approach that doesn’t add stress to an already busy life.
You already know I rely mainly on SMC so I won’t get into explaining them.
Now everyone can spot levels with some practice, but the real edge comes from contextualizing them, understanding why certain order blocks work while others don’t, and being able to interpret accumulation, distribution, and other complex market dynamics.
It's crystal clear that execution is where many traders make mistakes.
Often, it’s not analysis that fails, but timing.
Prices often approach key levels, absorb liquidity, and only afterward move in the intended direction forcing early entries to get stopped out.
Waiting for confirmations? Absolutely, it increases the probability of success, even if it occasionally skews the risk/reward ratio.
However, there are two main ways to execute trades: high leverage and low leverage.
After years of experience, I’ve chosen the second path, but why?
Because it allows me to give the market time to form reliable structures, manage my risk effectively, and trade calmly and clearly without unnecessary stress.
-----------------------------
Psychological connotation 🧠
-----------------------------
Yes, I know what you're thinking: "I scroll social media and I see plenty of people flexing 100xs longs/shorts and this forces me to think I'm not enough"
I get it.
Every time you open Instagram or TikTok, there’s someone showing off their massive wins, their luxurious lifestyle, their fast gains and it’s easy to fall into the trap of comparison, to start thinking that slow, steady growth isn’t exciting enough, that your discipline isn’t “doing enough.”
Social media is a highlight reel, not reality.
You’re only seeing the wins, the celebrations, the moments that make for clicks and likes.
Rarely do you see the drawdowns, the stress, the emotional battles, or the countless trades that didn’t work out.
Comparing yourself to curated 📷snapshots is a psychological trap.
It can push traders toward reckless decisions, over-leveraging, or chasing trades for the thrill, just to feel like they “measure up.”
The truth is, calm, disciplined, consistent trading doesn’t make for flashy Instagram stories, but it builds real, sustainable wealth.
You don’t need to impress anyone online.
The real victory isn’t in showing off a 100x trade, it’s sticking to your method, following your plan, and letting compounding work quietly and steadily over time.
The people who scream the loudest on social media are not necessarily the ones winning in the long run, they’re the ones who make the market look exciting while masking the real risk behind it.
My mantra is simple: plan, execute, and profit (hopefully)
Behind these 3 words lies a precise methodology.
Planning means analyzing HTF for key levels, identifying liquidity zones, contextualizing them, and defining invalidation points where a trade idea no longer makes sense.
My execution often happens on the same timeframe of the level I'm trading (waiting for closures within the level), but I also look into MTF where I confirm operational signals such as accumulation, BBs, or FVGs completion.
Risk management is essential.
My stop loss is always at the invalidation level, never arbitrary.
Position size is based on the risk per trade, and I never average down or improvise.
❗️Trade management is equally important ❗️
I move my stop to breakeven when a trade moves in my favor, take partial profits at key levels, and let the remainder run to maximize potential moves.
For instance, if price rebounds from an order block and breaks a supply, I start to trail below that supply that has now became a breaker, letting the rest ride toward the next liquidity area.
Compounding and leverage are where long-term growth truly shines, in my opinion.
Many people think success comes from big wins using high leverage and while this can be a great integration (open low lev/when in profit trail/remove the margin/increase the leverage) what I prefer is a slow, consistent progress.
----------------------------------
👁️Example
---------------------------------
Imagine two traders, both starting with 10K.
Trader A decides to risk 1% of their account on each trade, aiming for a 2:1 reward-to-risk ratio.
That means for every $100 risked, they aim to make $200.
After 50 trades with a 50% win rate, their account grows steadily to around €12,800.
After 100 trades, it reaches approximately $16,400.
His growth is gradual, almost unnoticeable day to day, but remarkably consistent.
Even a string of losses doesn’t shake his account significantly as he can keep trading calmly, stick to his plan, and let compounding work in their favor over months and years.
Now consider Trader B.
Trader B decides to take bigger risks, 5% of their account per trade, with the same 2:1 reward-to-risk ratio.
That seems exciting because the potential gains are enormous.
One winning trade could make $1,000, 10 times more than Trader A’s typical win.
After 50 trades with the same 50% win rate, the account has the potential to reach $34,000.
After 100 trades, it could surpass $100,000.
Sounds incredible, right? But the problem here is that high leverage comes with high stress.
Just imagine if Trader B hits 10 consecutive losses, which is not unlikely.
That would wipe out 40% of their account in a very short period.
Emotionally, he's riding a rollercoaster made of fear, frustration, and desperation creep in, and his decision-making suffers.
One bad reaction could undo weeks or months of progress.
The key takeaway is that compounding only works if you remain disciplined over years.
Leverage can amplify gains, but it also amplifies psychological pressure.
So, I keep it simple where the majority of my trades are made with bigger size and lower leverage as I can clearly manage them understanding if the price is invalidating my setups or not, looking for a powerful compounding over months/years.
Trading is complex enough already and I don't want to make it harder.
I aim to reduce stress, maintain clarity, and trade with discipline. I don’t chase tomorrow’s big win. I focus on building today so I can reap rewards in the years ahead with this extra business.
I believe that true victory isn’t a single profitable trade but it’s sticking to your method consistently, even when the market tests you.
This is how I trade.
$DOGE:
Compression is identified when price advances with decreasing displacement, meaning each push covers less ground than the last.
Candle bodies get smaller, overlap increases, and swings form converging structures such as, in this case, a clean tightening channel.
In an uptrend, highs still "print" but extend less, while lows climb closer, visually squeezing price.
This shows weakening momentum and order buildup, often right into a demand zone, making a sharp breakout likely once balance shifts.
Add the MMXM HTF model and you have a powerful cocktail.
Here we go with assets that are breaking out as mentioned in the post above, where OTHERS D. was the clue.👁️
"Now it's important to consider that OTHERS D. can float around the range coming back for the EQ or slightly below but this doesn't change the fact that it's not distributive in my opinion and the BTC D. reverse correlation helps in this context."
This information was important because the EQ was in the VAH zone and when you start building structure above the POC and slightly below VAH (context is key) this is often an hint for higher since the market is accepting the zone as fair value.
The “random pops” that have begun surfacing are not isolated anomalies, but rather symptomatic of a deeper shift beneath the surface, given the increasing number of them.
These moves are particularly significant because they’re happening in an environment defined by disbelief.
There’s still no euphoric sentiment behind them, no herd enthusiasm, and no obvious catalyst.
Instead, they emerge quietly, almost as if the market is testing liquidity pockets, forcing participants to reassess their biases, in my opinion.
In a true distribution phase, strength like this would almost immediately get sold into, leading to cascading weakness, but here, we’re seeing strength being sustained, absorbed, and even reinforced (supplies being flipped becoming valid breakers 🔄) which strongly suggests a different phase of the cycle is in play.
Structurally, the picture is just as compelling.
Prices remain well below their HTF equilibrium levels (for the majority) trading in discounted zones where the logic of “distribution” simply doesn’t fit.
And this accumulation doesn’t announce itself with obvious trends, otherwise it would be too easy.
It manifests as sideways chop, frustration, and a string of rallies that seem “random” and “unconvincing” to most participants.
Any sign of strength is dismissed as manipulation or a trap, but zooming out, this skepticism is the fuel that powers the next phase because real accumulation thrives in disbelief, not in optimism.
Each move higher flushes out shorts, draws liquidity, and quietly confirms that demand is alive beneath the surface, from what I'm seeing.
The bigger picture here is rotation.
However, as more of these moves stack up, the illusion of randomness will give way to recognition but by then, much of the discount opportunity will already have been absorbed.
There's still some work to do especially for its "sister" OTHERS, but if we perform a weekly closure above 8.10% then my targets of 8.53% + 9.83% will likely be in play.
I'm showcasing my ideas step by step so you can read my thought process and hopefully find value from.
✍️Whenever the price of an asset approaches a demand or supply zone, you may expect an immediate reaction to validate strength.
You see price touching the area and anticipate a sharp rejection or bounce, as if the market is obligated to respond instantly, but in reality, sustainable movements often don’t happen this way.
For a move to carry weight and last, it is usually better to see the market spend some time within the zone rather than snapping away from it impulsively.
The reason lies in how orders are actually processed.
A demand zone is essentially a cluster of buy orders waiting to be triggered, while a supply zone is a cluster of sell orders.
These zones are not magical price levels, they are concentrations of liquidity.
When price tests them, the interaction between resting limit orders and incoming market orders determines the outcome.
If price touches the zone and immediately rejects it, that usually means only a thin layer of orders was triggered, often enough to create a short-lived reaction, but not enough to sustain a lasting move.
Once those orders are absorbed, the zone loses strength, and price often comes back to test it again or even break through.
By contrast, when price actually spends time within the area, a different process is unfolding.
Orders are being absorbed gradually.
Smart money often cannot fill their positions all at once without pushing the market aggressively, so they allow price to hover inside the zone, absorbing liquidity and executing over time.
During this period, new participants also join the "battle", reinforcing the zone and creating a healthier balance of supply and demand.
When the market finally leaves after this absorption phase, the resulting move is more likely to be sustainable, because it reflects deeper order flow rather than a shallow reaction.
This is where a common misunderstanding arises: traders sometimes confuse “spending time in the zone” with “repeatedly testing the zone.”
❗️They are not the same.
When price consolidates within the zone, orders are being filled and liquidity is actively exchanged, which strengthens the foundation for the next move, but when price keeps leaving the zone and then returning to test it again and again, each touch tends to consume resting orders and deplete the zone’s strength.
Over time, these repeated stabs weaken the area, making it more likely to break.
So the difference is subtle but crucial if you want to level up.
Consolidation inside a zone is constructive as it suggests absorption and accumulation.
Multiple rejections with constant retests are destructive as they erode the liquidity that gave the zone its power in the first place.
This is why the most reliable supply and demand zones are not necessarily the ones that spark the most dramatic reactions.
They are the ones that allow price to breathe and to build up genuine order flow before moving away.
Time for a crucial update on this metric, since plenty of you asked me about it.
"Brother what do you think? Is it over?"
Let me clarify my thoughts.
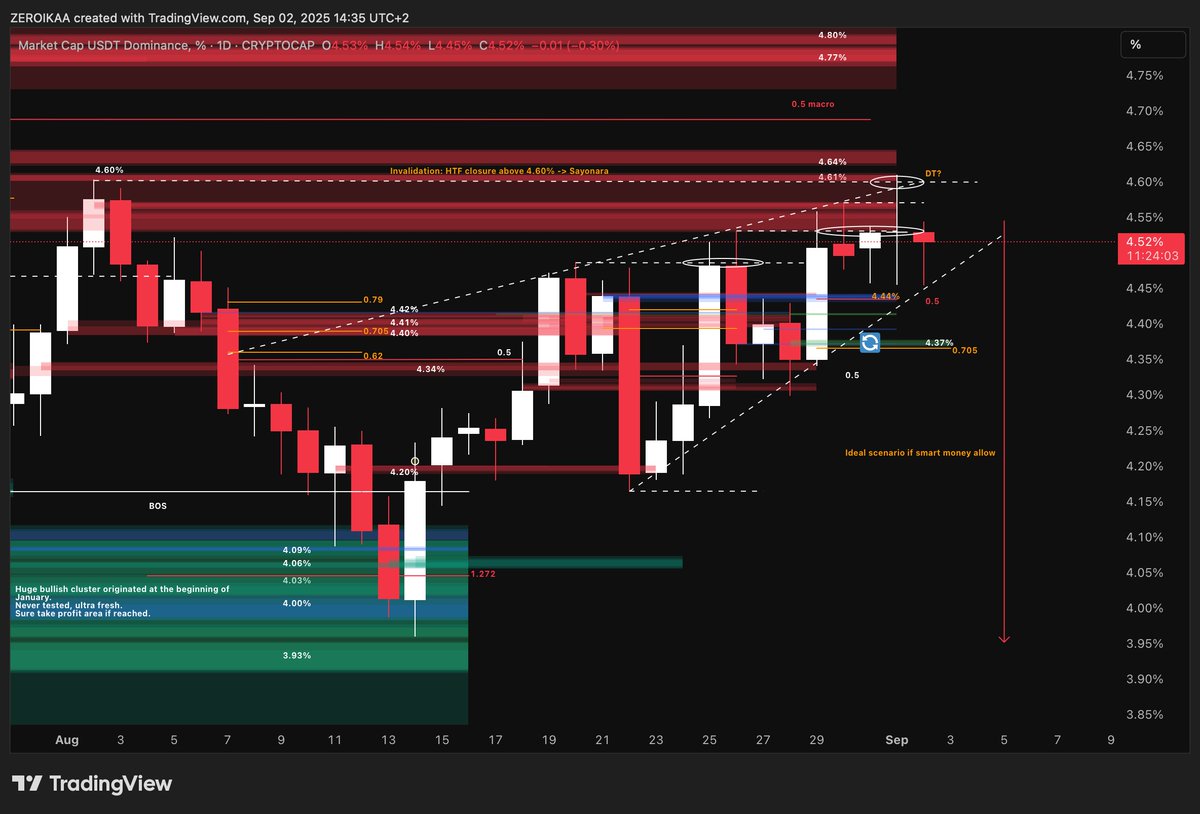
In the previous update we were seeing it reaching the key area near the 4.40% zone, my primary HTF target for reloading more on spot and start eyeing some longs.
From that moment we saw another rise melting the level but if you read the update I was mentioning: "As long as the 4.49% high isn't reclaimed on HTF, I can't be bearish."
This didn't happen as we formed consecutive daily SFPs above every new high formed (and if you want to know more about this I leave you with a post that I made recently) ->
https://t.co/bSrs5nsGqw
However, the most important aspect in this context is that we took 1 of the 2 "last key areas" for a reversal: the 4.61% one (apologize if I didn't mention it in the previous update, I marked it on my charts later) and this has occurred with another SFP, something that matters a lot...but why?
Well, the big conjunction here could be found in the opposite side of the market where most charts (T2/OTHERS/OTHERS D.) have taken their major levels alongside plenty of HTF breakers on individual altcoins.
I also already shared my view on OTHERS D (accumulation in my opinion) and to validate this scenario a strong breakdown of the USDT D is required.
Also, something to note aside is that, "retailistically" speaking, we have a potential HTF rising wedge in the making, with the metric converging into the crucial area, also forming a potential DT.
Considering the decline of BTC from the highs (average of -13%) this is the moment where to expect a reversal, in my opinion.
Could we still see another pump toward 4.64%?
Yes, everything is possible (and this would likely match the 106.700 key area on BTC -> FRVP high volume + liquidation level + MTF breaker) but what we don't want to is seeing a closure above 4.60% as it would compromise the whole structure on majors regaining almost a 2M range.
For me, that would likely mean the ultimate signal that the absolute top on BTC is likely in, therefore de-risking everything from spot and start looking for HTF shorts.
However, this is not a scenario that I'm tracking and I'm leaning toward another swing to the upside until proven otherwise.
To the downside we have a 4.37% fresh demand that I'm eyeing as partial TP and based on the reaction I will adjust, considering that it could be flipped and utilized as a breaker for going lower (tbe).
Let's see what we got and if we can complete our plan at 100%.
August monthly candles on both BTC and TOTAL1 need to be monitored and taken into consideration, in my opinion.
I already discussed about my BTC overall view in this post https://t.co/Lw2iNux5hd and the last closure is strengthening the thesis.
Technically speaking we can identify this formation as a clean tweezer top, a pattern where both candles share approximately the same high with similar bodies size, hinting at absorption and potential trend reversal.
While the pattern/name alone doesn't mean much, I believe that context matters a lot and if we take it with a broader perspective, this acquires more validity.
We come in fact from an uptrend that started in December 2022 that has already produced an average of a +700% in a context where returns are clearly diminishing.
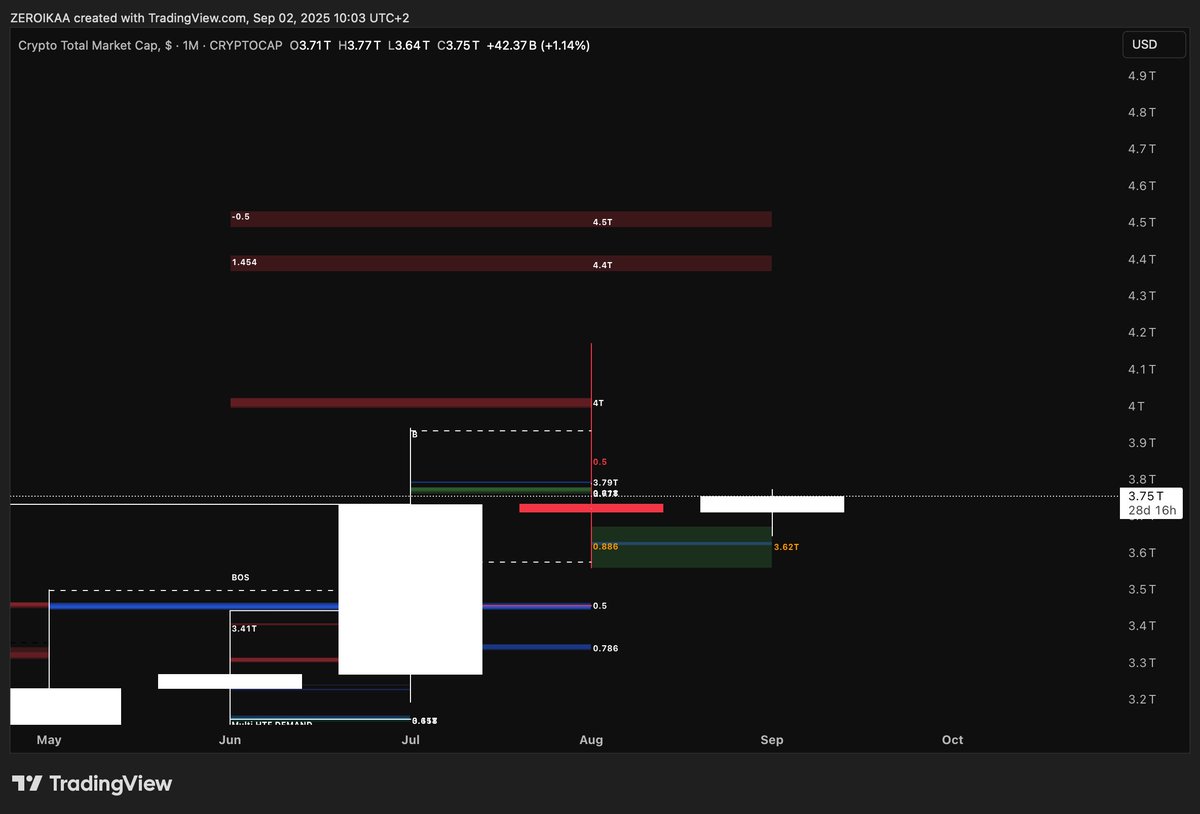
As you can see, also T1 is displaying a clean monthly SFP reaching the significant mark of 4T (target I discussed months ago) with a very thin body candle and a long wick.
This doesn't mean lower from here as this is a monthly TF and there could be still another impulse in confluence with the plan I shared on the USDT D, potentially reaching the fibs you see in my BTC chart and 4.4/4.5T on T1, but this should regardless suggest you to be extremely careful and that, overall, is not the time to buy Bitcoin for the long term as the trend is weakening.
Different topic is the altcoin one where T2/OTHERS are positioned slightly better and might hold another macro leg up before concluding their cycle.
Sharing my thoughts here with you as a reason to not get absorbed into "supercycle" or "up only" things that might slaughter you.
Pay close attention.
During the last update we saw the touch of the 4.20% semi-HTF level and where, as per the post written above, I opened MTF longs and added a bit of spot.
As mentioned, it wasn't an optimal level and later on, this area has been flipped as a clean breaker that served as continuation into the 4.34%/4.40% key region, one of the best zones to reload "more heavily".
If you remember well, when the USDT D approached that zone there was a lot of fear given by the fact that it was closing above the bearish breaker, but the multi timeframe analysis i posted https://t.co/FXKk1hTWX3 should have clarified the situation, suggesting you to pay attention to the broader perspective instead of being focused on one single daily candle.
Result?
Fast aggressive drop into the 4.20% area due to the "rate cuts".
Price action always moves first, news comes later only to justify it.
Now, as you can see, the 4.20% has been utilized to push it back toward the 4.42% where most liquidity has been left behind and where a 3W supply has been formed.
In "symbiosis", several majors came back to test their bullish breakers: T1/T2/T3/OTHERS/ETH and for this reason, as long as they hold and the 4.49% high isn't reclaimed on HTF, I can't be bearish.
I can't be bearish especially because the BTC D. has broken below the 2M demand and this creates the assumption for continuation on altcoins and on ETH as well, retest or not retest of it.
Given the amount of liquidity absorbed during these moves and if we see continuation as I expect, I will not look for shorting the 4.06% freshly formed demand, but more on a 🔄 of it, ideally post 3.98% BOS and HTF closure.
Based on my projections, if this is the final swing, an area to pay close attention should be contained in the 3.81%/3.63% area where the 3.69% is a significant level to monitor.
Hope that this thread made you level up since, by following it, you would have been able to catch corrections and favorable accumulation zones based on a systemic approach.
Let's see what we have next and if we can complete the HTF plan.
@IamZeroIka Absolute masterclass, privilege to watch you work and thank you for being generous with your knowledge so everyone can learn and grow. Much respect.
I want to share with you a very valuable educational content extracted from the telegram.
Yesterday, in confluence with the view on USDT D, we started to build up a long thesis.
In the previous posts I discussed about the situation in which several majors were already taking their key levels (T1/T2/ETH1!/OTHERS) and, by pooling all together, we moved our attention to the Bitcoin price action.
If you read my previous posts, I suggested to put the attention to the 110/111K area (that wasn't a must but something to consider), but why?
Well, because under previous lows there's a lot of liquidity allocated given by stop losses (remembering of David Paul's words, god bless that man) so that was a significant area to pay attention at.
Before the Jackson Hole, BTC started to dip below the previous lows and a very important signal was given by the volumes.
In fact, during the sweep of the lows, a very nice cluster of volumes on the 4H TF appeared..what it meant? That buyers/bulls were stepping in with aggression.
When a market is in a downtrend in fact, what you really want to pay attention to is how the candles and the volume work together.
So if sellers are still in control, you'll usually see strong pushes down with real conviction behind them.. big red bodies and solid volume but when that pressure starts to fade, the signs often show up as shrinking volume and candles with longer lower wicks.
That tells you sellers are trying to drive the price lower, but buyers keep stepping in to absorb it.
If this keeps happening and the candles stop making much progress to the downside, the downtrend is losing steam and the setup for a bounce becomes more likely.
It doesn't guarantee one, but the shift in "energy" between sellers and buyers is what creates the conditions for a reversal or at least a relief rally, thus the cluster of volumes mentioned.
Logically, you can't take this in isolation since the risk of seeing a liquidation cascade is very high, but if you're able to build up a thesis with context (the most difficult thing, more than execution probably) you can surely create solid plans that can lead to high profitable outcomes.