📊🌳🔥 echarty now supports flame (or icicle) charts
A simple way to explore deep hierarchical trees interactively
🔗 https://t.co/2b16Udg5Tq
#rstats#datavis#datavisualization#Rlanguage
✨ Chart items customization directly from data!
Set data columns for symbol, size, color, label, opacity, fonts, etc.
Echarty now supports v.6 of ECharts, take a look at some new chart types:
🔗 https://t.co/U0UBaPdR9o
#rstats#datavis#datavisualization#Rlanguage
📊👨🏼💻 Introducing Coder - R code scaffolding for charts. Most ECharts types covered.
Easily edit and plot, export to JS editor.
Install latest echarty and type 'demo(coder)'.
🔗 https://t.co/gIsRAPpeQx
#rstats#dataviz#datascience#datavisualization#mapping
📊👩👧👧Hierarchical data and charts in R
Study on various data structures and chart presentations
Live article 🔗 https://t.co/yyi1tOGxil
Morph demo 🔗 https://t.co/QarNTfl9UG
#rstats#dataviz#datascience#datavisualization
📊🌍💵 Top foreign countries holding US Treasuries during 2022
Total holdings per country, percent and amount changes, matching choropleth maps.
Integrated charts and maps with animated transitions.
Live 🔗 https://t.co/0TyY49pgcX
#rstats#dataviz#datascience#mapping
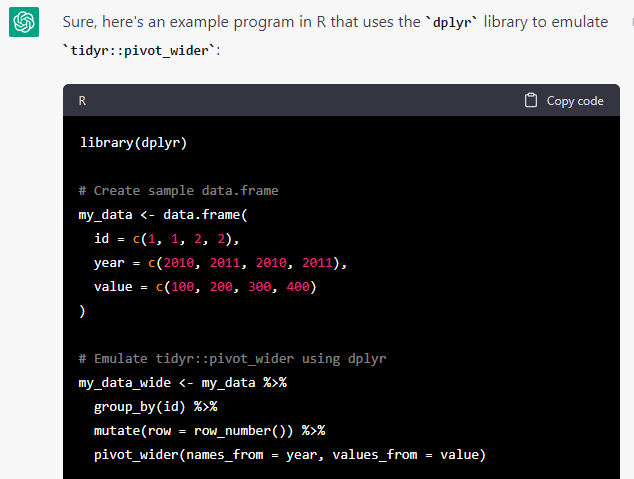
🐙 chatGPT writing R code... almost there
It can do the simple, how about the hard ?
Click the link to see the result:
🔗 https://t.co/8D97PeYu7c
#rstats#datascience#chatGPT