@Albert_618 Not taking any side, but curious on what is your motivation in doing such a long post to expose someone. If I was in your spot I couldnt care less about what other people do....
@IamZeroIka Some guys have been saying "we are still early" for as long as you scroll back on their timeline…shorting the tokens they promote has been a profitable strategy for me though :)
Remember that if you like this content and want to learn how to take setups, how to read the market and grow (even if you're starting from scratch) the channel is always open: https://t.co/Rrg8esB3tW
You will find explanations, charts, videos, a supportive community and my whole Notion which is basically a trading course that I'm giving out essentially for free.
- HTF VSA analsyis (chilling in the meantime) -
I'm gonna show you something very interesting that you can use for your analysis as well, trying to capitalize independently if you have a more passive or aggressive method.
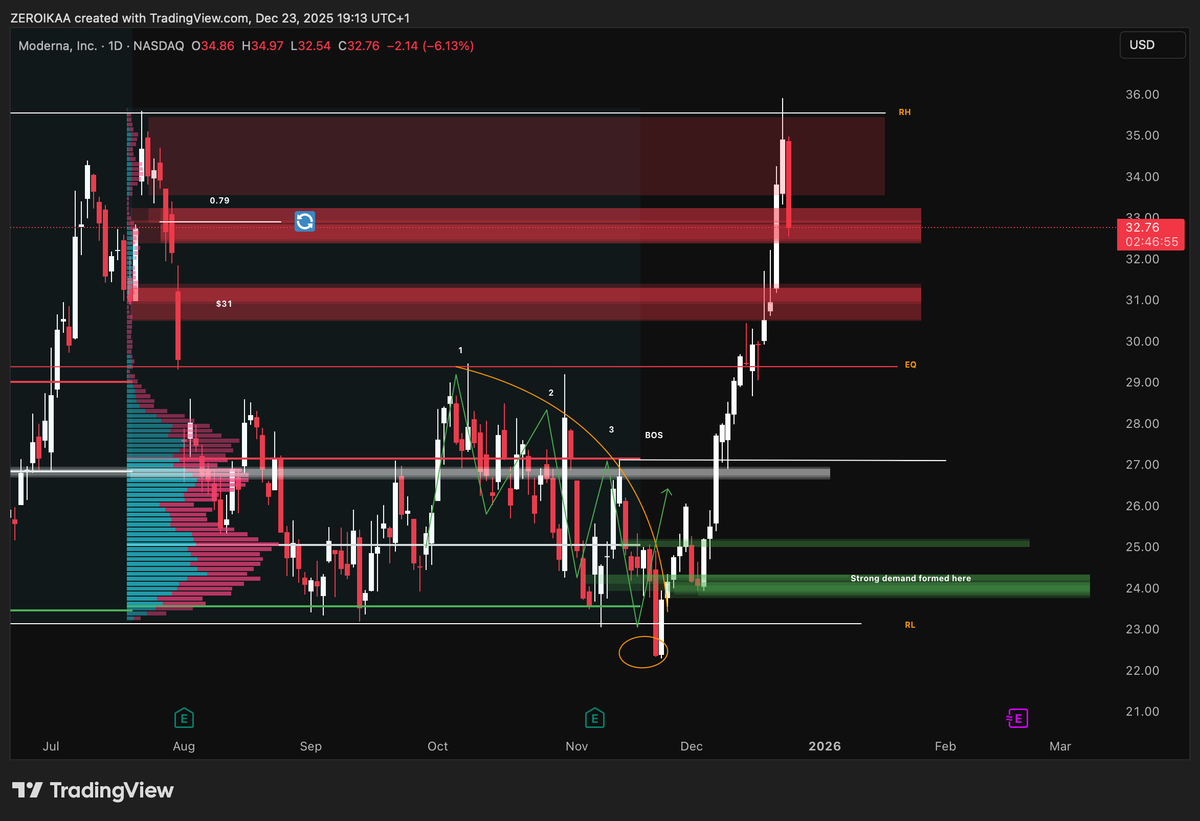
In here you can see the chart of MRNA that I shared in my channel on the 9th of October (first suggestion to look into it was in May).
Now my approach here was super simple.
I was not trying to predict a short-term move or chase momentum, what I was focused on was where price was sitting within the HTF range and what the volume was telling me about intent.
From that perspective, price was clearly trading deep in a HTF discount where risk asymmetry began to favor buyers rather than sellers.
What immediately stood out to me was the behavior of volume relative to price.
As price continued to trade sideways to slightly lower, volume consistently expanded without producing meaningful downside continuation.
That lack of efficiency was critical.
If sellers were in control, increased volume should have translated into a clean expansion lower, but Instead, each push down was met with absorption and that was a classic sign that supply was being absorbed rather than distributed.
❗️In market mechanics, high volume at extremes must always be interpreted in context:
- At premium levels, it often signals distribution.
- At deep discounts, it more commonly reflects accumulation
I was not expecting an immediate breakout because accumulation rarely/never looks impulsive..it is typically slow and frustrating because is designed to exhaust participants before any expansion occurs.
The longer price builds acceptance in this zone, the more meaningful any eventual displacement becomes. (save this for later)
Now the analysis between tick volumes and price was one factor, but also the correlation with the VP in range was key.
A large portion of traded volume was building below EQ, creating a developing high-volume node in the discount area.
When price spends time and transacts heavily in a zone, it indicates agreement between buyers and sellers, which is a necessary condition for accumulation.
Now if you pay attention, a lot of supplies were mitigated between EQ and RL (notice 1-2-3) and for that reason, since accumulation was heavy and prolonged, the displacement formed has been violent.
No pullback has been provided because each internal supply was mitigated and above each high shorts were positioned and squeezed, generating more fuel and contributing to the violence of the impulse.
Result? +50% in 2 weeks, deleting months of sideways and boring price action.
This is why you need to learn how to use VSA together with VP to form a thesis.
@SatoshiFlipper WTF you talking about, countless alt made X10 and more since the last bear market....you cant expect the top 5000 to go X20 all at once and then give you an indicator to sell all at the top.
@IamZeroIka That live trade alone in the dojo paid for the last year and a half of subsription, all of that within half an hour of price action...keep it going !
@MariusSm1th You not taking much risk, all of those IMX, Super, Beam, etc, are all so low already that the only possible way is UP....or fall into oblivion :)